Bathymetric Mapping – Natmap’s Unfinished Program
Major revision by Charlie Watson, July 2022,
from original by Paul Wise February-October 2014, updated by Charlie Watson, June 2015
Introduction
When first envisaged, National Mapping’s Bathymetric Mapping program was planned to run for some 10 years at a projected cost of $18 million. The Bathymetric Program was approved by Cabinet Decision 206 of 11 March 1970. The final cost of work completed was $12 739 700 (in 1970 Dollars). Progressive expenditure and sounding progress is shown in Annexure A. Commenced in 1971, by 1987 after 17 years of steady progress within annually reduced budgets, it was thought that at the current level of funding the bathymetric mapping program could have been completed within five years. However, it was not to be!
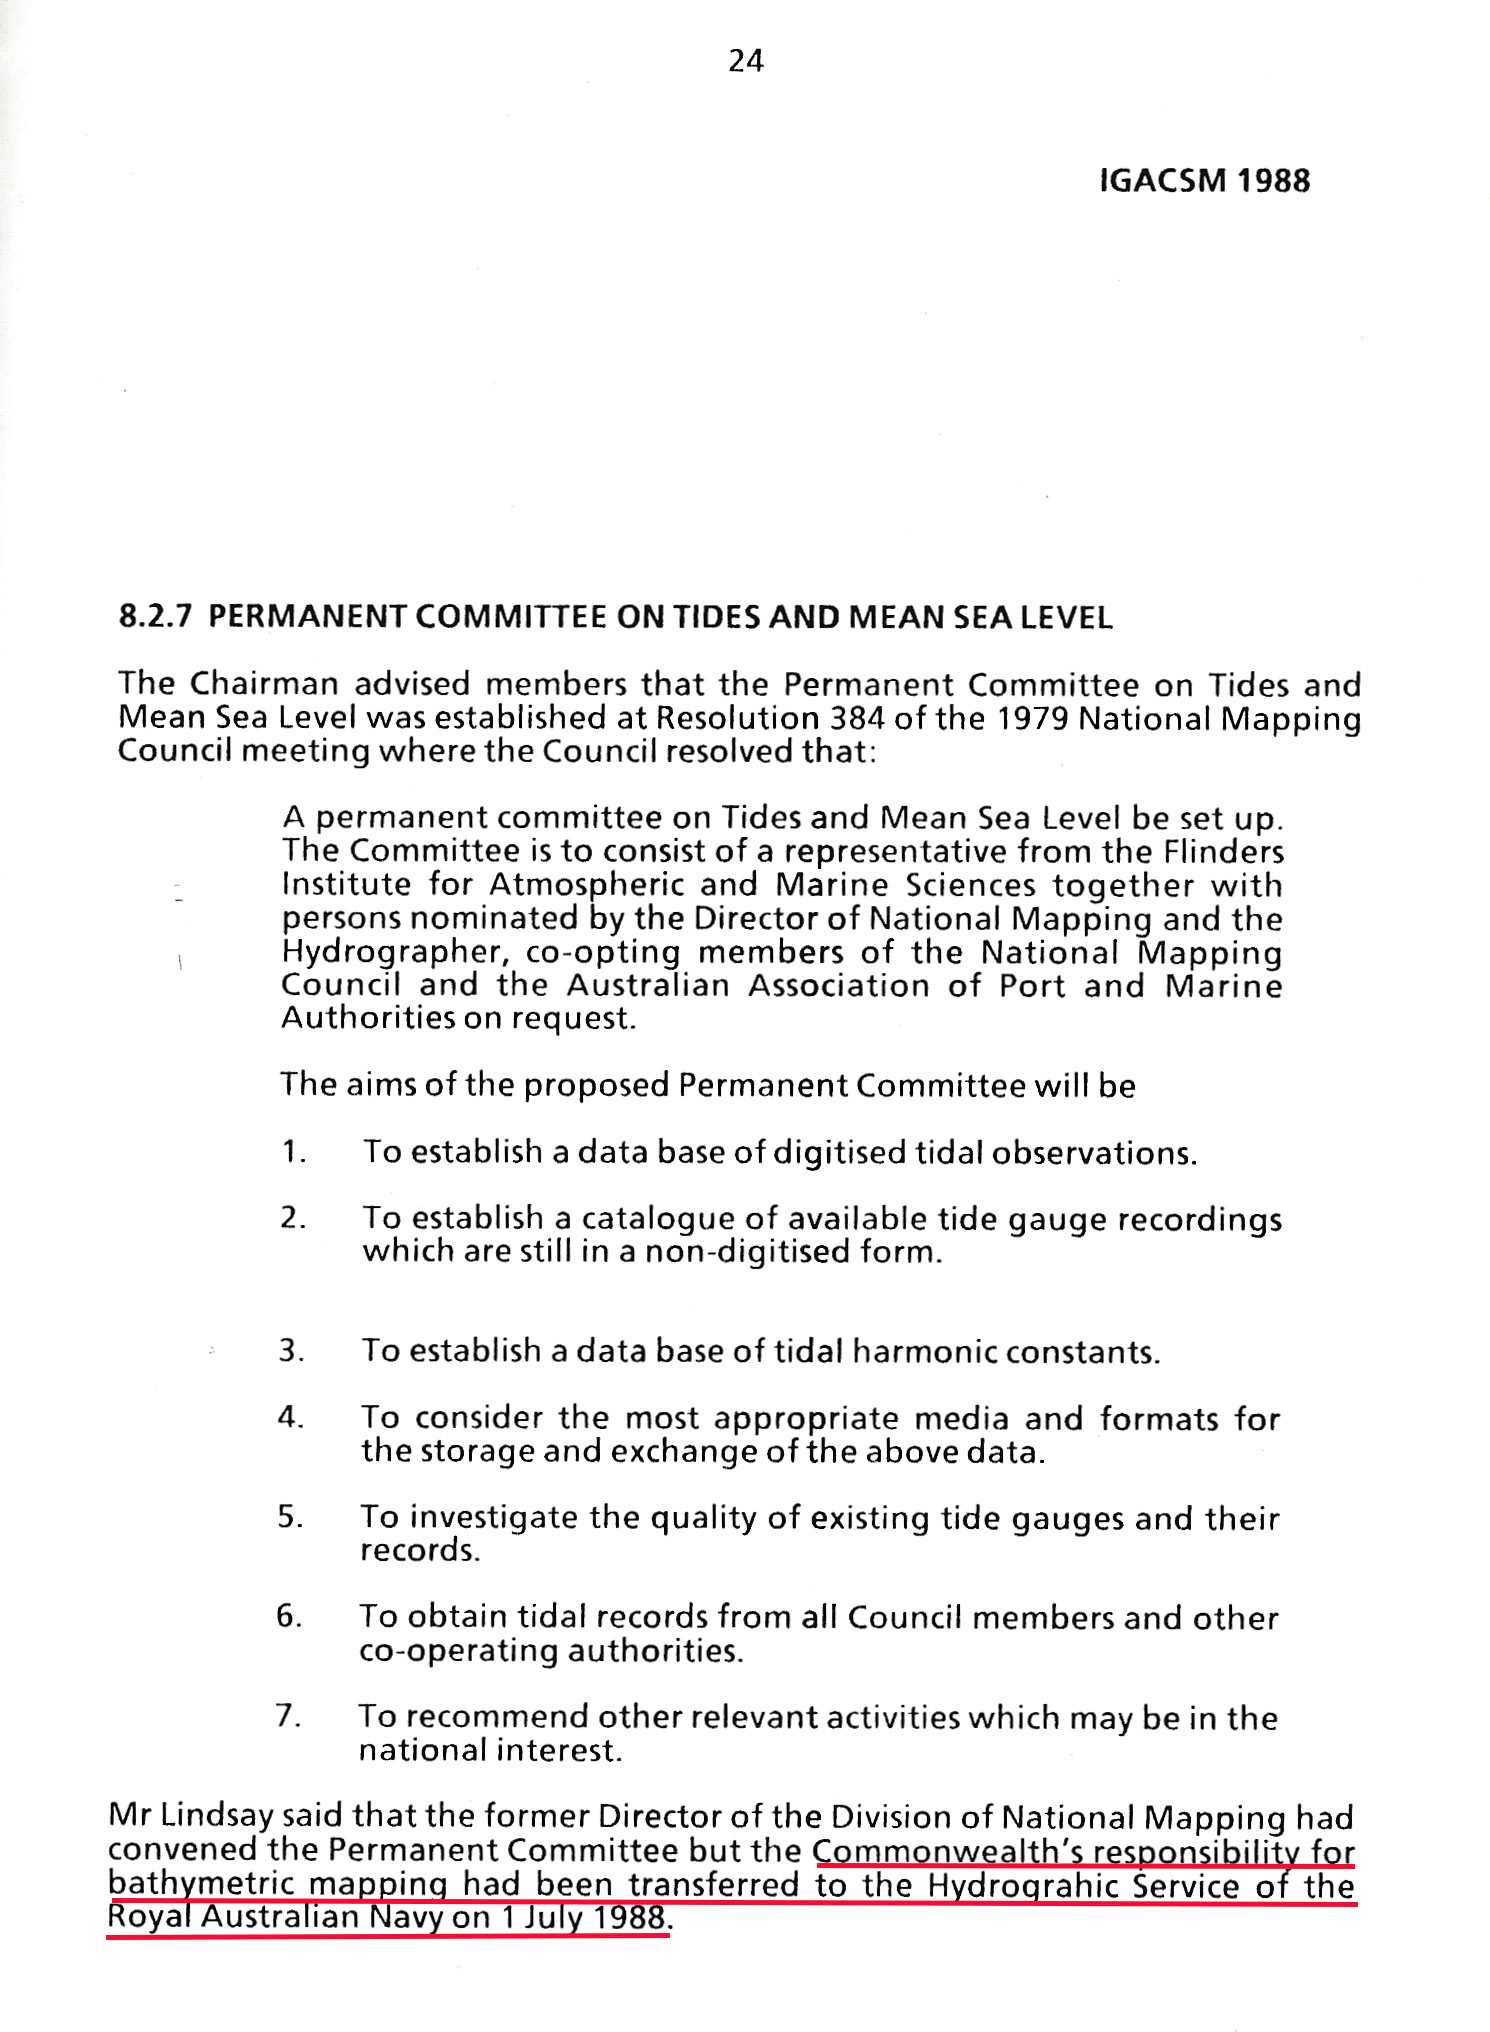
The administrative arrangements associated with the formation of the Australian Surveying and Land Information Group within the Department of Administrative Services in 1987, transferred the Bathymetric Mapping function from National Mapping to the Royal Australian Navy's Hydrographic Service as of 1 July 1988. At that time, only 76% of the bathymetric survey program had been completed and 60% of the planned 278, 1: 250 000 scale bathymetric map sheets had been published.
Former Natmap Supervising Surveyor Survey Operations, Bruce Willington, recalled that after the Bathymetric Mapping program was moved to the Navy there was one last survey season in the Great Barrier Reef. With then only Swain Reefs, Northern Great Barrier Reef, Archipelago of the Recherche and an area off the Arnhem Land Coast left in the bathymetric survey program. The latter two areas were considered to be too dangerous for the MV Cape Pillar to survey without extensive small boat assistance. The planned survey work was thus only 90% complete. With the ex-Natmap bathymetry group’s own dedicated draughting resources in the Navy, however, the cartography was able to be accelerated completing 26 bathymetric map compilations in one year alone. By 1991, it was reported that 75% of the bathymetric map publication program was complete. After this date no map publication statistics are available but information indicates that around 85% of the planned bathymetric maps were finally published. The main reason that the Bathymetric Program was curtailed was the sudden decision by the Department of Transport to sell the MV Cape Pillar. There was no suitable replacement at such short notice.
Even though the bathymetric mapping program was not completed it was not for want of commitment by those directly involved who were Natmappers in the first instance. This paper therefore attempts to summarise the completed Bathymetric Mapping program.
Why Bathymetric Mapping in Natmap?
When exploration began to show that resource rich regions extended beyond the Australian landmass, the need to know what was below our neighbouring off-shore waters became an initial imperative. Any offshore development of oil and gas in the quest to make Australia self sufficient, required bathymetric maps.
Australia had participated in the 1958 United Nations First Conference on the Law of the Sea, in Geneva. This Conference as part of its work, produced the Convention on the Continental Shelf, which Australia ratified. The first article of this Convention defined the continental shelf as follows:
For the purpose of these articles, the term continental shelf is used as referring (a) to the seabed and subsoil of the submarine areas adjacent to the coast but outside the area of the territorial sea, to a depth of 200 metres or, beyond that limit, to where the depth of superjacent waters admits of the exploitation of the natural resources of the said areas; (b) to the seabed and subsoil of similar areas adjacent to the coasts of islands.
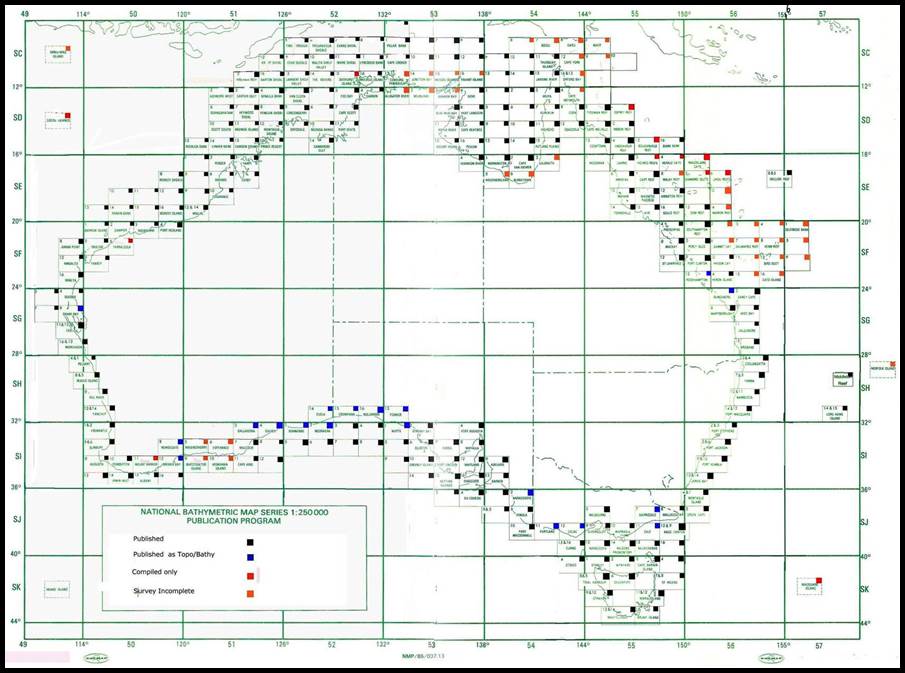
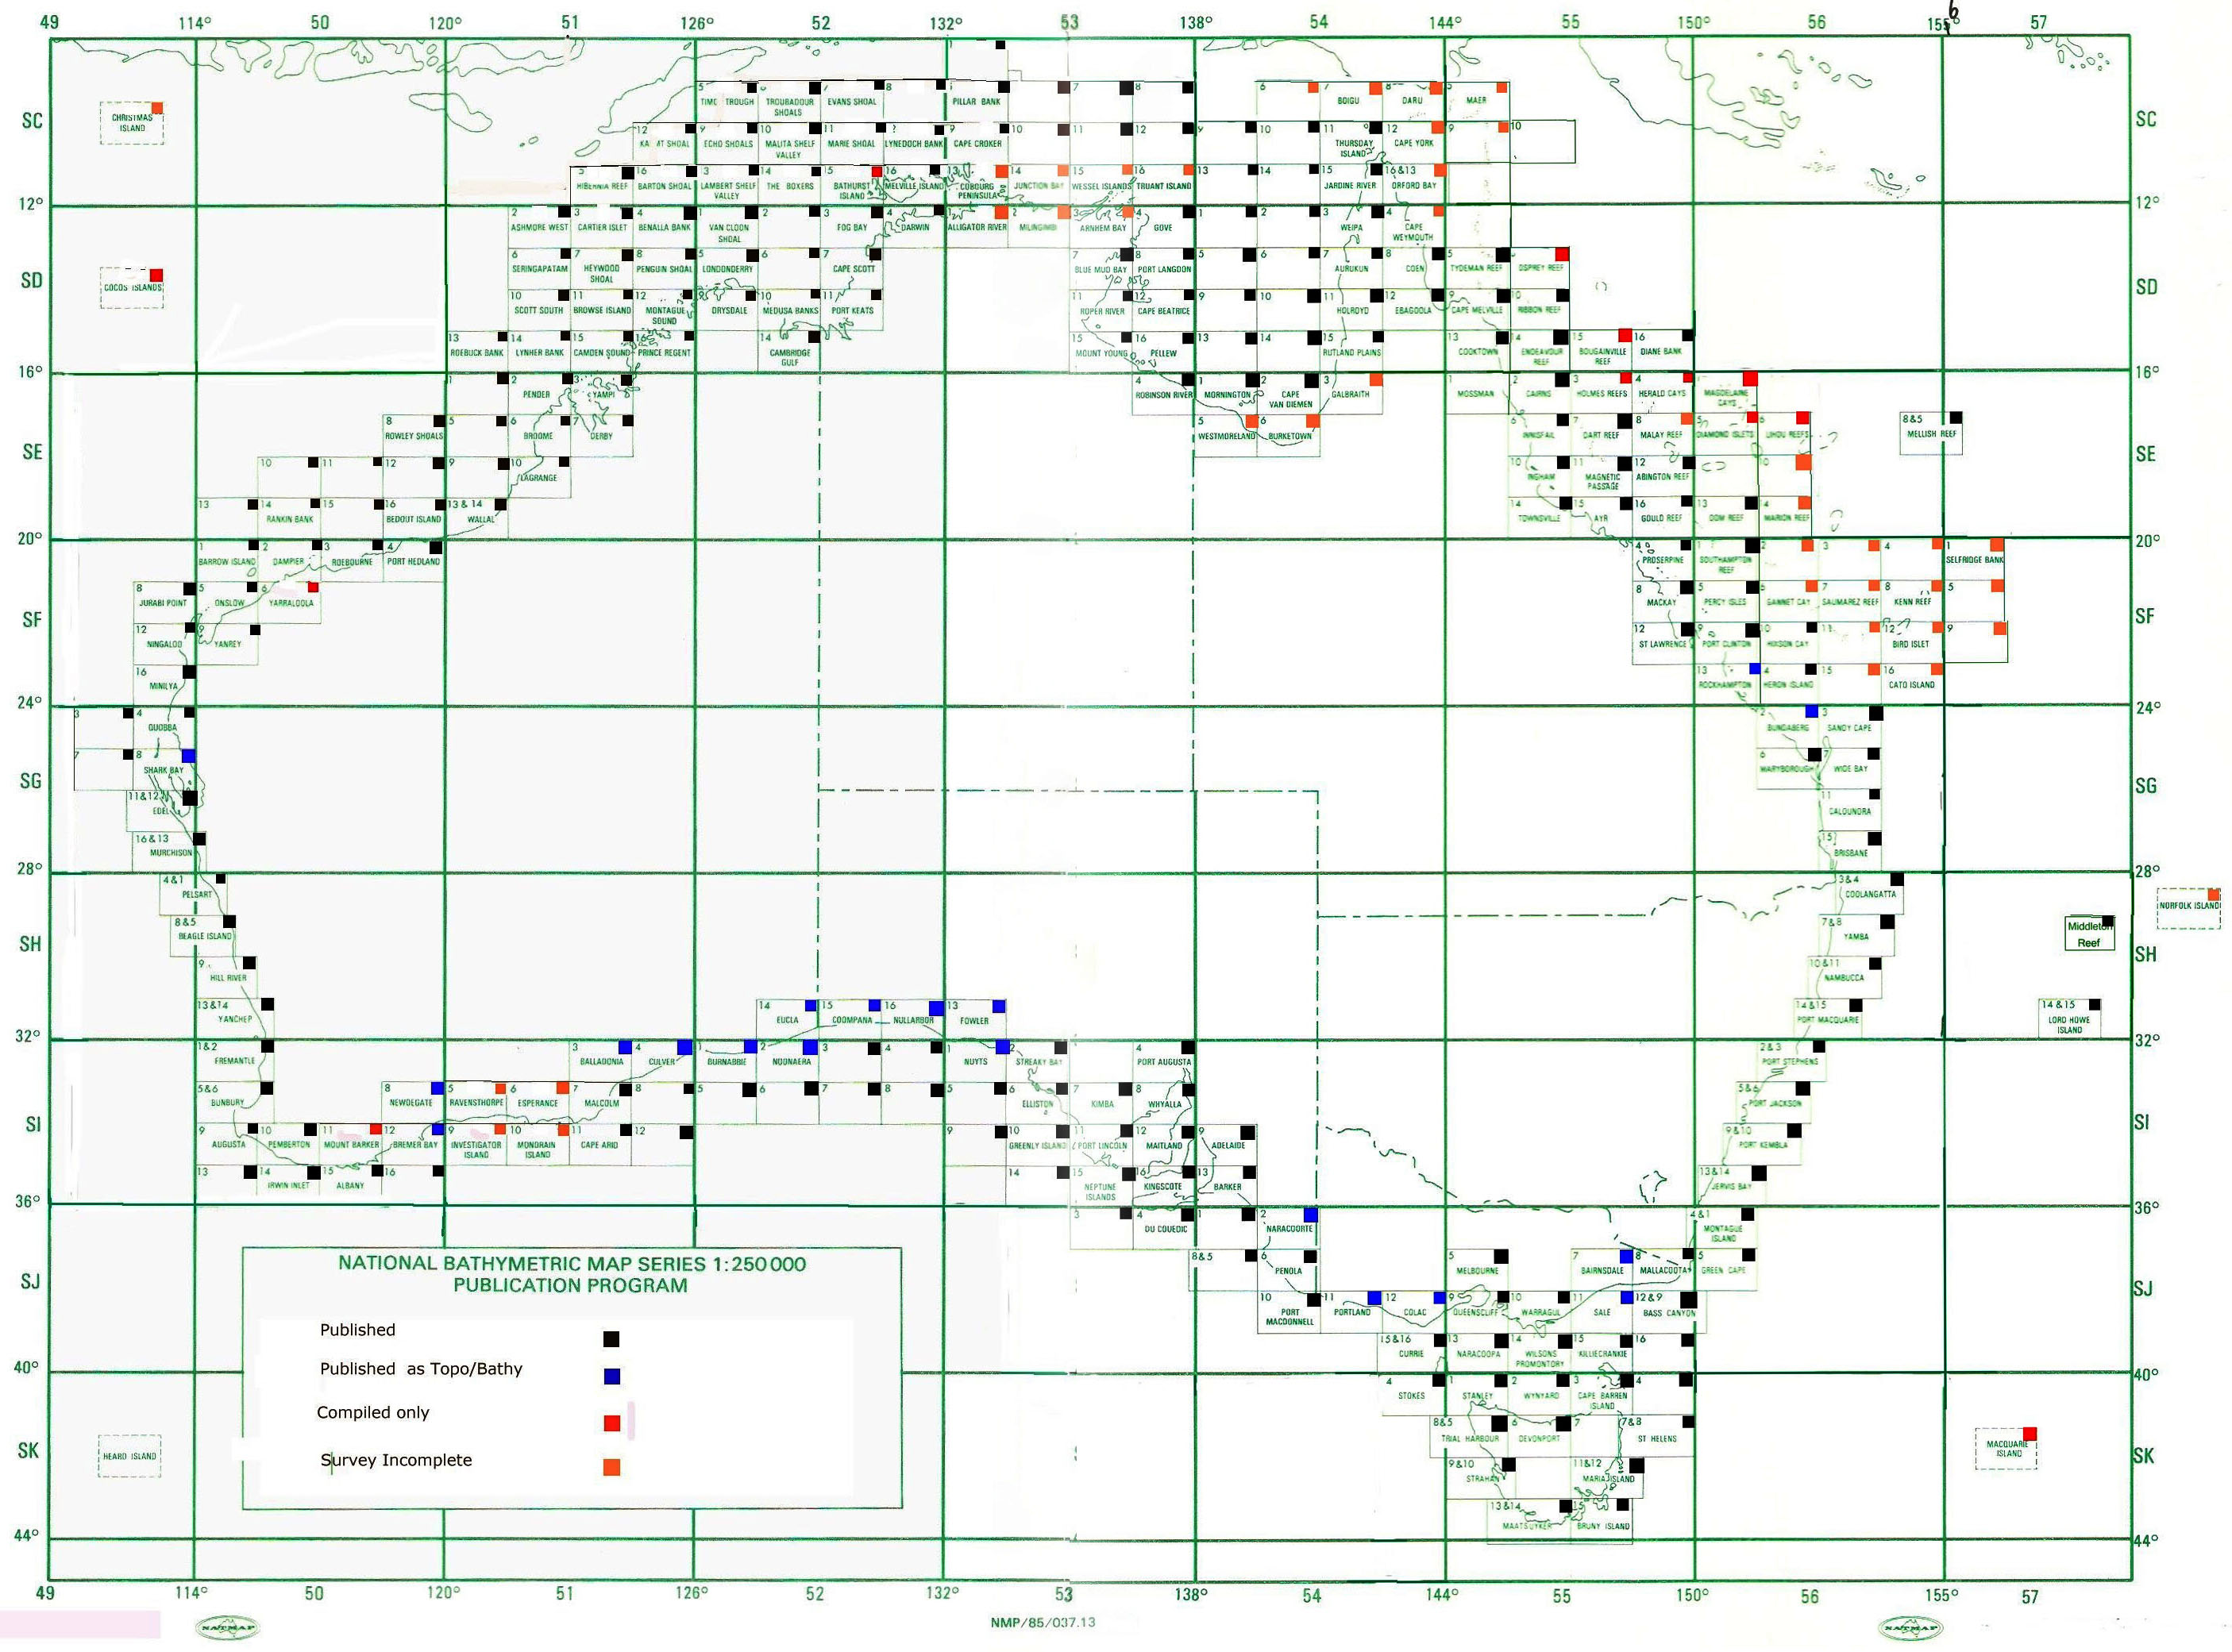
This conference then led to the Conventions on the Territorial Sea and the Contiguous Zone and on the Continental Shelf. Australia became a signatory to these Conventions in 1963. In so doing, Australia undertook to learn as much as possible about the nature and extent of its own continental shelf. This knowledge was required so that this region could be delineated and any exploitation adequately controlled. The extent of the continental shelf around Australia overlaid with the bathymetric map sheet index is shown at Figure 1.
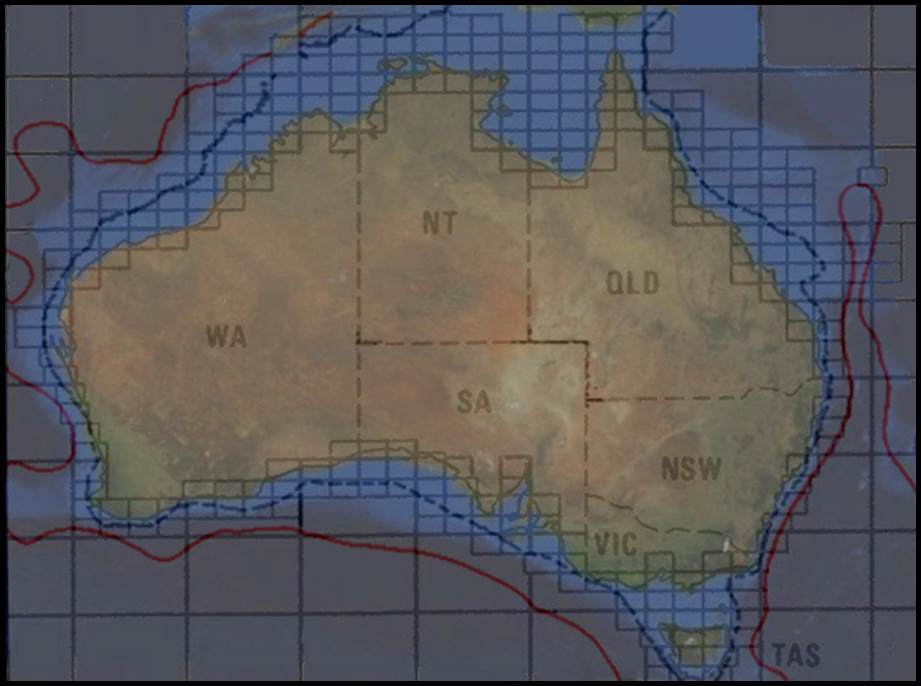
Figure 1 : The extent of the Continental Shelf around Australia, as seen from space, overlaid with the bathymetric map sheet index.
The 200 metre isobath as per the 1958 Convention is represented by the blue dotted line and the approximate limit of the Continental Shelf under the 1982 Convention is represented by the solid red line.
As the major client for the bathymetric maps was the then Bureau of Mineral Resources (BMR), bathymetric mapping was considered a civil program (at this time BMR also had divisional status alongside Natmap within the Department of National Development. For this reason, responsibility for the program was given to the Division of National Mapping. The then Naval Hydrographic Service, as a defence agency could not guarantee the continuity of effort required to complete such a large survey and mapping program. In addition, at the time the Hydrographer’s resources could scarcely manage the existing demand for safe navigation lanes required by the increasing number of very large bulk ore carriers then transiting Australian shipping routes.
Pragmatically the Department of Shipping and Transport also had interests at that time in coastal maritime operations. With changing lighthouse re-supply logistics, as more automated lights were commissioned, the Department’s Navaids support and maintenance vessels had spare capacity. These vessels could not only operate to the limit of the continental shelf, their operations unlike those of the Navy were managed to maximize time at sea. It was thus seen as indefensible that the Navy was solely capable of bathymetric surveying and mapping.
What is Bathymetric Surveying and Mapping?
Bathymetry is the measurement of the depth of large bodies of water. In a surveying sense, bathymetry is not only measuring the depth of water at a location but also fixing, by co-ordinates such as latitude and longitude, the position of that location. A bathymetric map then portrays these positions and depths as contours of the sea floor or isobaths. In addition, any features such as islands, reefs and cays which break the surface of the sea are also depicted.
The traditional hydrographic chart does not depict the topographic relief of the area. It is designed to portray matters relating to navigation and provide a plot sheet on which the navigator can plan his route and plot his progress. Hydrographic surveys place emphasis on examining an area to ensure that no reefs, shoals or pinnacles exist which may constitute a hazard to shipping or, where these do exist, to show their relationship to landmarks or navigation aids. The vertical datum to which depths are reduced is usually related to the level of the lowest tide expected in the area. In open waters, deeper than the draught of vessels likely to sail there, only a general indication of water depth is usually shown.
When the bathymetric mapping program was established no map specifications for a bathymetric map existed. In the first years of the program, the map specifications had to be developed in parallel with operations. The 1: 250 000 scale was adopted to maintain continuity with the similar land-based topographic series. Printing colours were restricted to brown for the land and blue with layer tints for the offshore elements. The isobath interval originally adopted was 20 metres, but from 1977 this was reduced to 10 metres. Although the continental shelf notionally extended to the 200 metre isobath, the bathymetric survey throughout was taken to the 300 metre isobath. This procedure ensured that the ship had passed the edge of the continental shelf and not mistaken a depression in the shelf for its edge.
The bathymetric map carried an important Caution Note to the effect, as outlined above, that it was not produced for navigation purposes as, unlike hydrographic charting, no effort was made to indicate possible hazards to shipping or depict navigational information, nor were the depths related to the type of datum used for hydrographic charts.
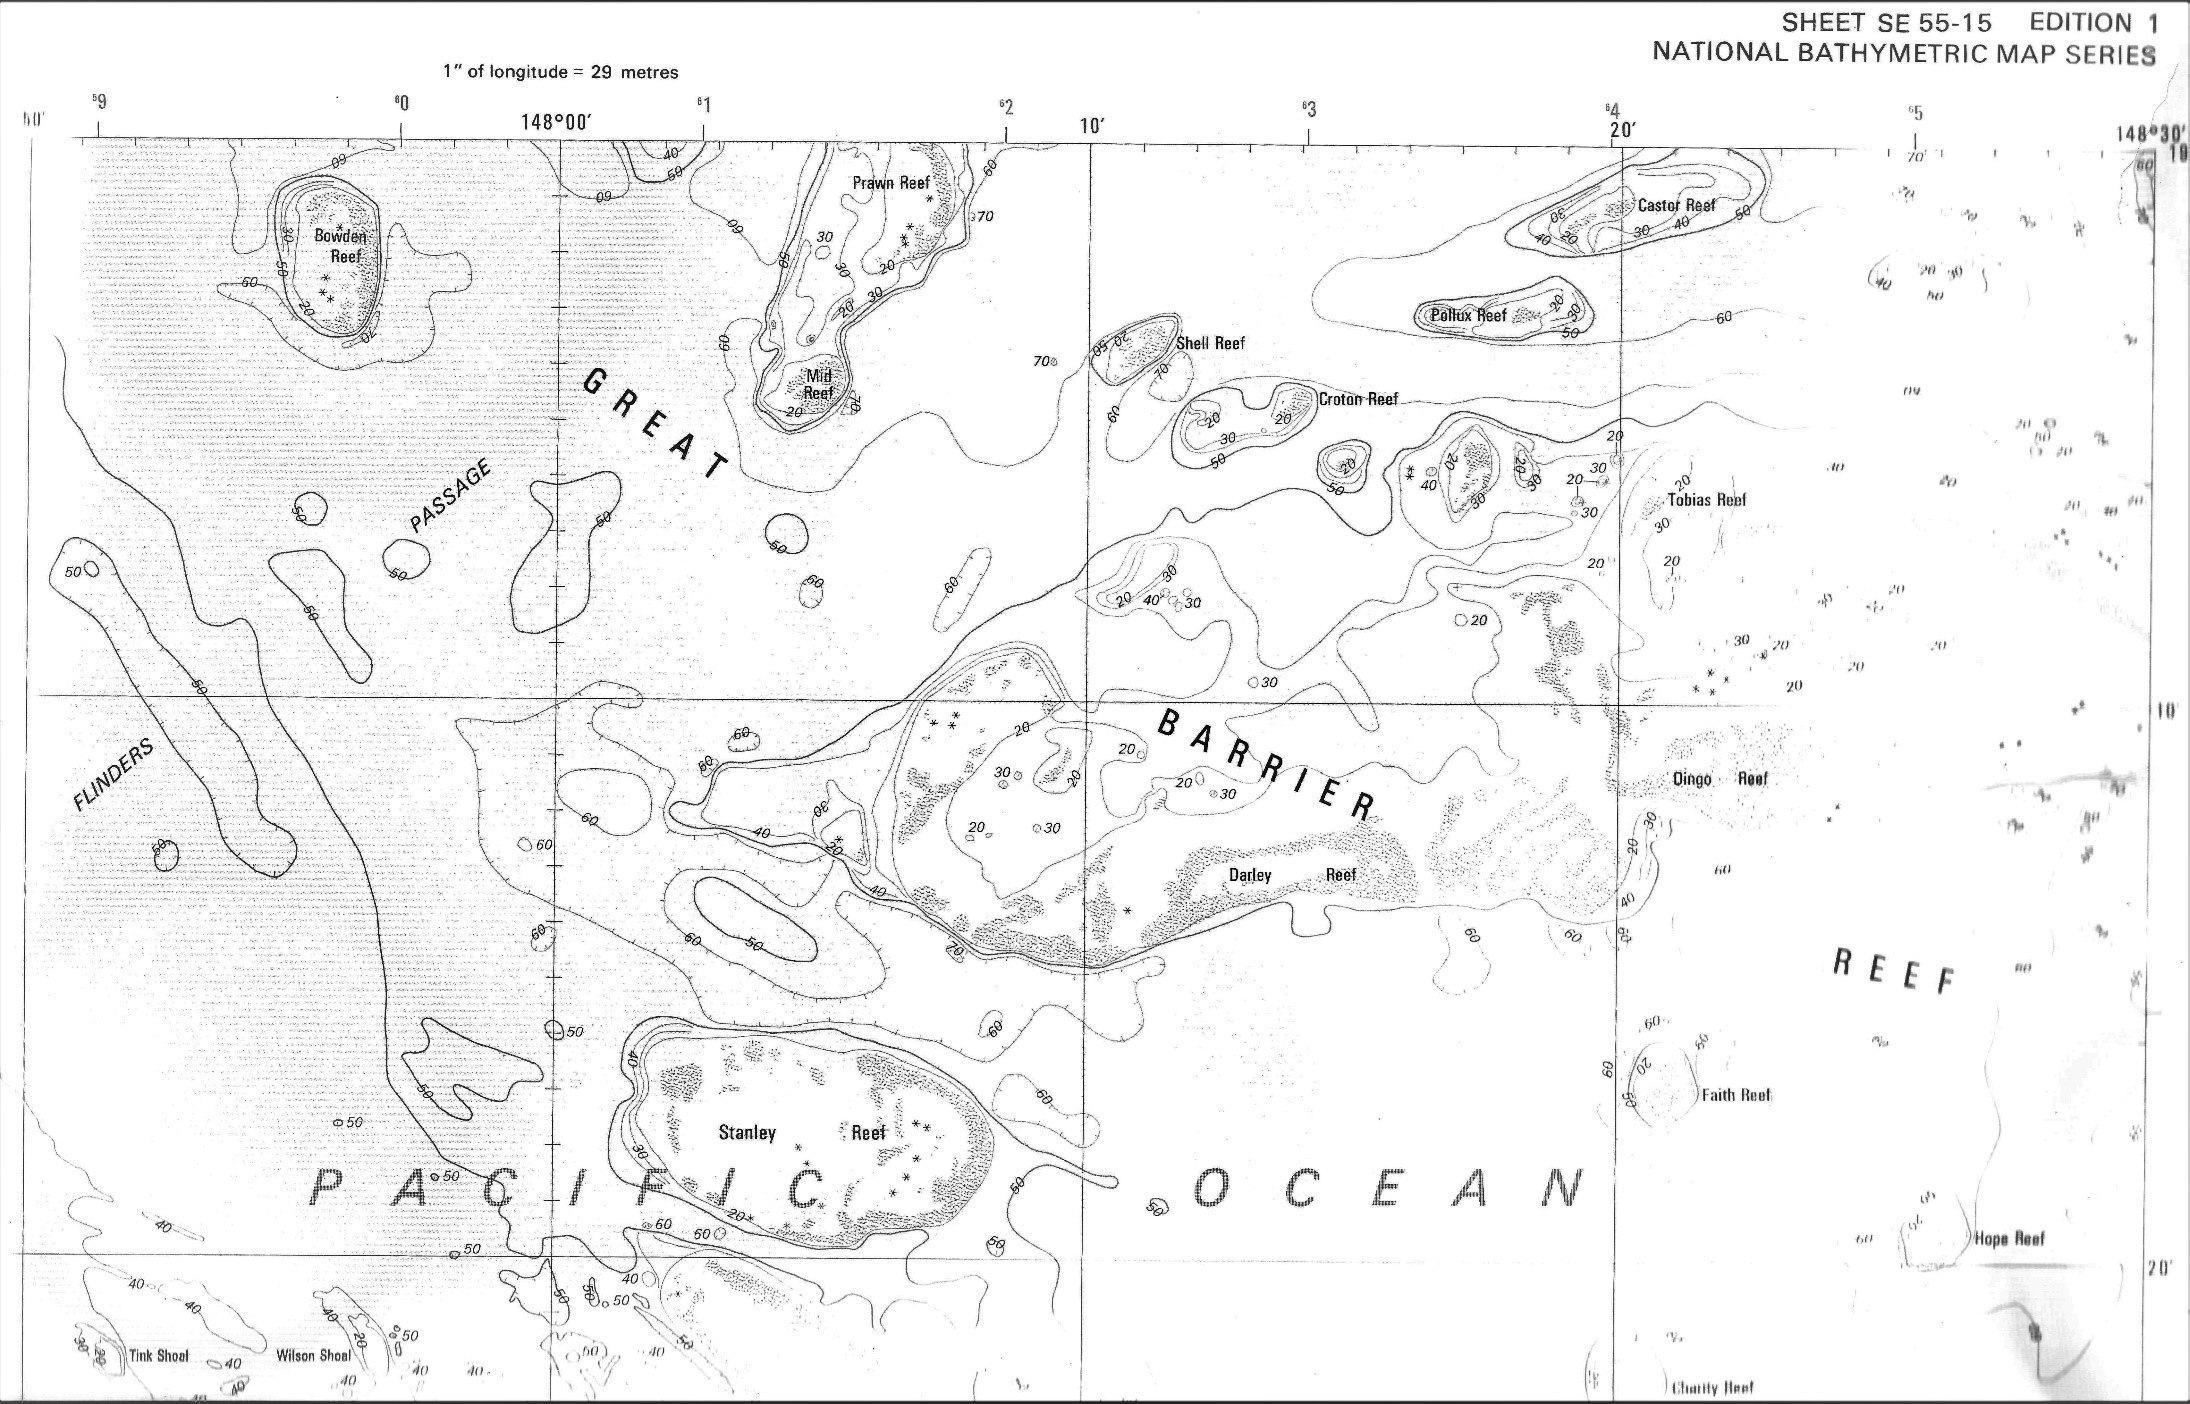
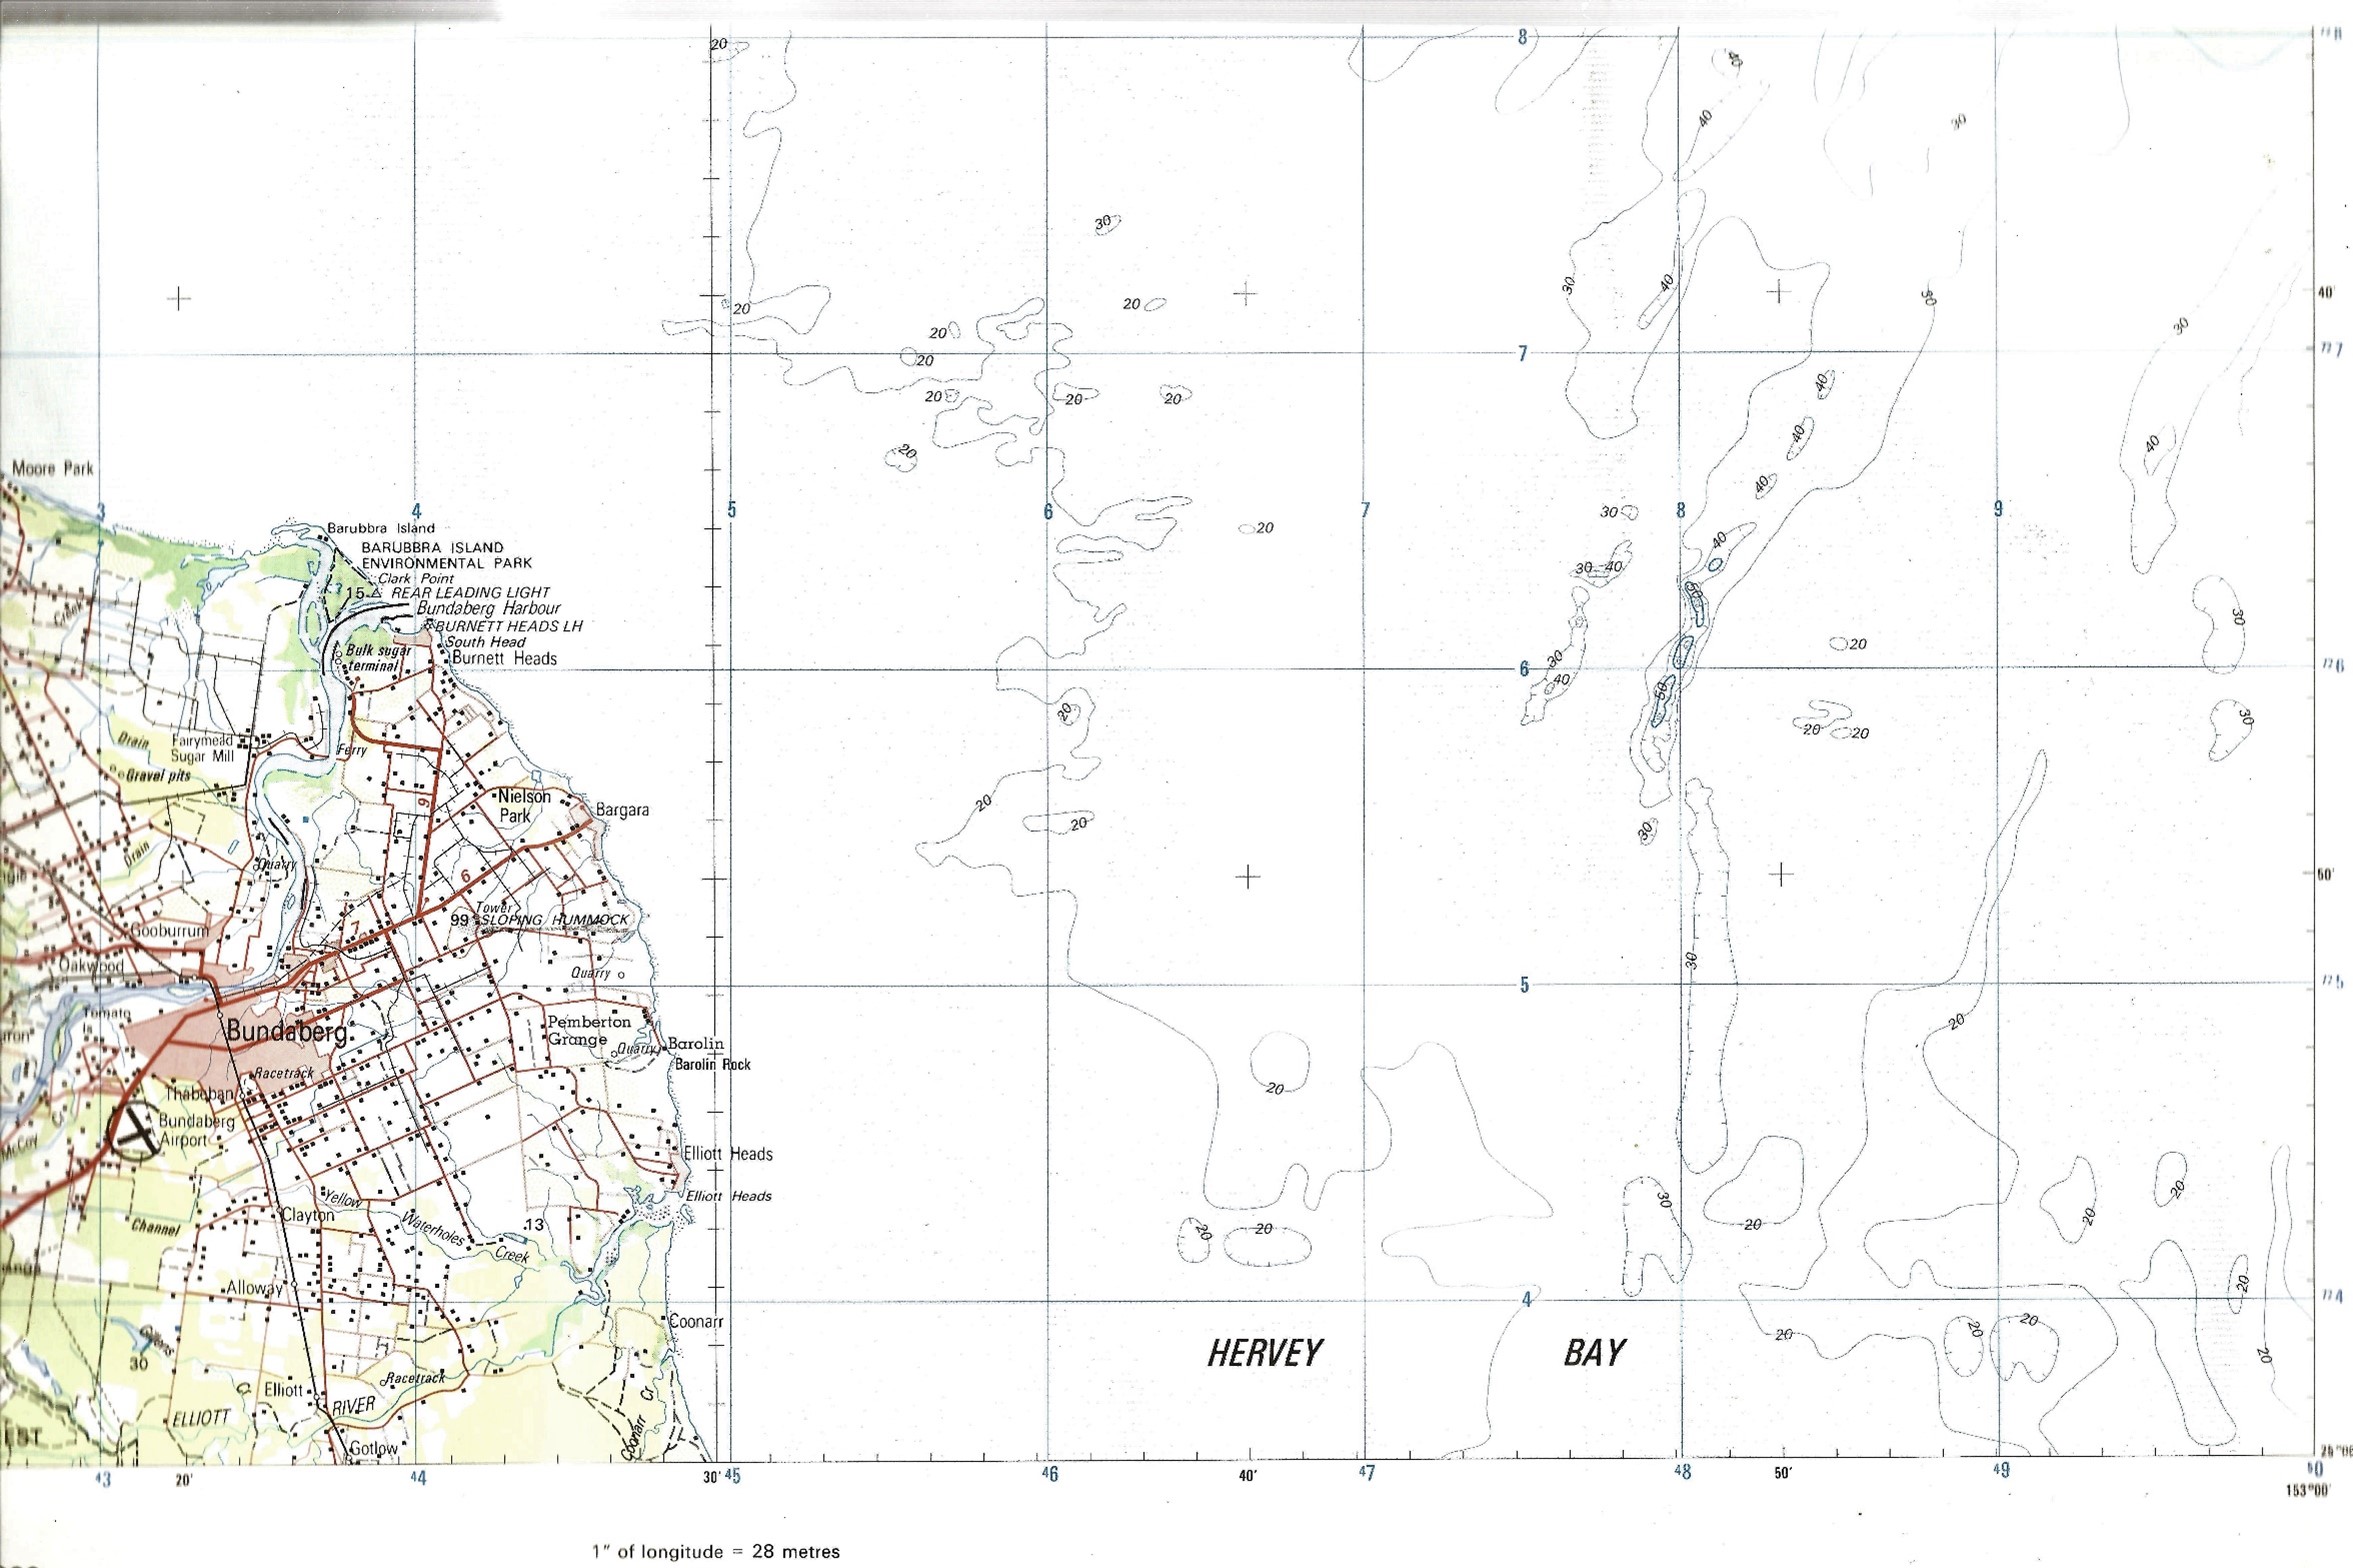
The choice of the 1: 250 000 scale also permitted composite topographic/bathymetric maps to be made along the coastline as required. Nineteen such composite map sheets are known to have been printed and they are listed in Table 1 below (Knight, 2014).
|
Table 1 |
|
|
List of known composite (topographic/bathymetric) 1: 250 000 scale map sheets by map number and name |
|
|
SG56-02 |
Bundaberg |
|
SH52-14 |
Eucla |
|
SH52-15 |
Coompana |
|
SH52-16 |
Nullarbor |
|
SH53-13 |
Fowler |
|
SI50-08 |
Newdegate |
|
SI52-01 |
Burnabbie |
|
SI52-02 |
Noonaera |
|
SI53-01 |
Nuyts |
|
SJ54-02 |
Naracoorte |
|
SJ54-11 |
Portland |
|
SJ55-07 |
Bairnsdale |
|
SI50-12 |
Bremer Bay |
|
SG49-08 |
Shark Bay |
|
SI51-03 |
Balladonia |
|
SF56-13 |
Rockhampton |
|
SI51-04 |
Culvier |
|
SJ54-12 |
Colac |
|
SJ55-11 |
Sale |
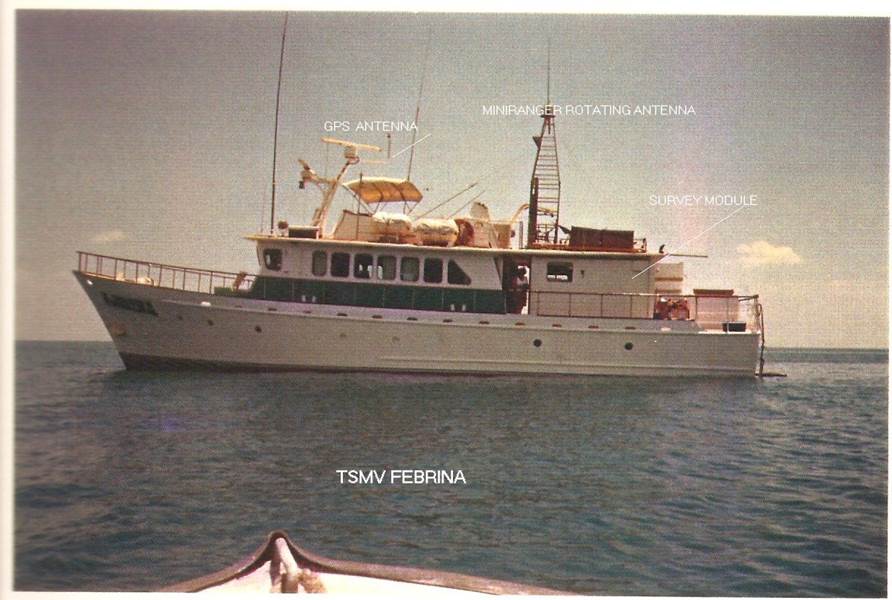
The bathymetric survey program necessitated two different, albeit similar methodologies. One for operating in deep off-shore waters, the other for shallow waters or waters where marine features could endanger a vessel. In deep open water a large vessel could be used with the endurance to stay at sea for long periods and so maximize survey time as well as to carry the necessary crew and equipment. This equipment not only included that for accurate on-line navigation but also for accurate position fixing out of the sight of land as well as that for water depth measurement. In shallower water a smaller more manoeuvrable vessel was required where endurance and capacity was less of an issue. The Department of Transport Navaids vessel, the MV Cape Pillar mostly fulfilled the role in off-shore waters while various vessels were chartered for the in-shore role. A list of the known vessels used, when and where is at Annexure B (more about the vessels used during the bathymetric mapping program can be found via this link. An indicative arrangement of the then equipment used in off-shore bathymetric surveying is shown in Figure 2.
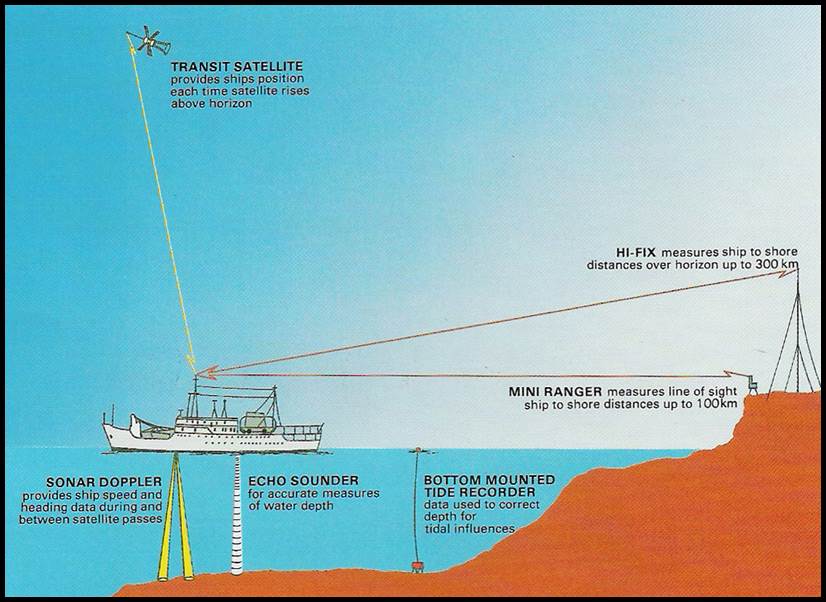
Figure 2 : An indicative arrangement of the then equipment used in off-shore bathymetric surveying.
In-shore bathymetric surveys used a less complex selection of equipment.
It should be noted that in the first few years of the bathymetric survey program, as Natmap had little to no knowledge in the field, contracts for data supply were let. These contracts not only accelerated the program’s initial acquisition of data but also let Natmap see how it was done. Details of the five contracts let for bathymetric data supply are in Table 2 below. The initial tender specifications were developed under the guidance of Royal Australian Navy Hydrographer, Commander Edward Ronald Ron Whitmore RAN, who had retired as Hydrographer RAN in March 1970.
|
Table 2 |
|||
|
Details of five Contracts let by National Mapping for bathymetric data supply |
|||
|
Contract |
Contractor |
Surveyor-in Charge |
Vessel(s) |
|
1 |
Australian Maritime Services |
Commodore Tony Cooper RAN (Rtd) |
MV Coralita and MV Murphy Star |
|
2 |
Australian Hydrographic Services |
Commander Hugh Vaughan RN (Rtd) |
HV Ataluma |
|
3 |
Engineering Surveys Oceanographic |
Commander Rae Schofield RAN (Rtd) |
MV Manly Cove |
|
4 |
Australian Hydrographic Services |
Commander Hugh Vaughan RN (Rtd) |
HV Ataluma then MV Bluff Creek |
|
5 |
Australian Hydrographic Services |
Commander Hugh Vaughan RN (Rtd) |
MV Bluff Creek |
The experience gained from observing these contractors was used to acquire the necessary instrumentation for Natmap to equip and man future charter vessels to undertake the survey work itself. Len Turner and later Peter O’Donnell were behind much of this early development (McLean, 2014).
The common piece of equipment used in all bathymetric surveys was the echosounder. The echosounder measured the depth of water by timing an electronic pulse reflected off the seabed and recording this either as a continuous trace on chart paper or later, by digital display. Pulses were transmitted at frequencies around 30Khz and 210 kHz depending on the make of echosounder. The lower frequency was more efficient in deeper water and the high frequency was better in shallow water. To achieve survey accuracy, the equipment was carefully calibrated and the velocity of sound in Seawater checked at frequent intervals.
In Australian waters the speed of sound in water ranges from 1526 m/s in the south of Tasmania to 1540m/s in the northern tropics. These speeds are about three times faster than the speed of sound in air. A sample of an echosounder trace or echogram is shown at Figure 3.
As necessary echosounder depths were corrected for any tidal variations from the selected datum, before being finally plotted on the map manuscript.
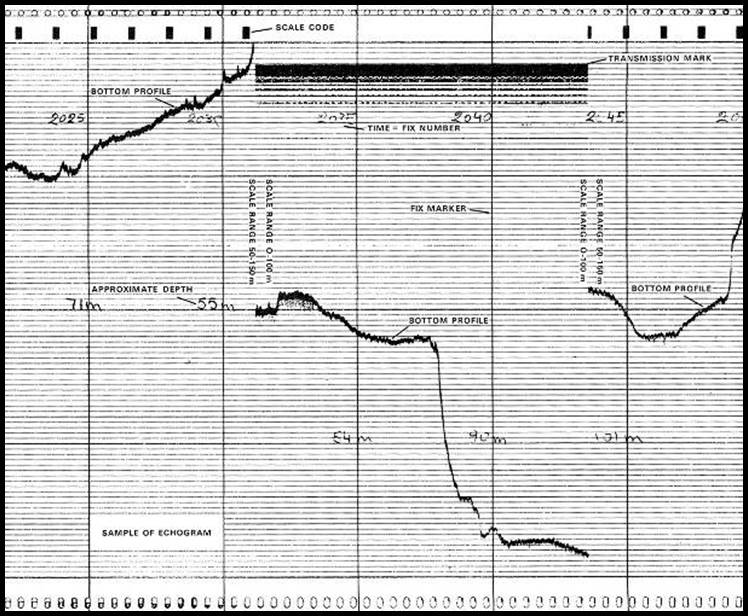
Figure 3 : Sample of an echosounder trace or echogram.
As explained above, water depth was of no value if its location was not accurately known. The position was recorded at two-minute intervals during echo sounding operations. Additional depths were added by interpolation depending on the nature of the seabed.
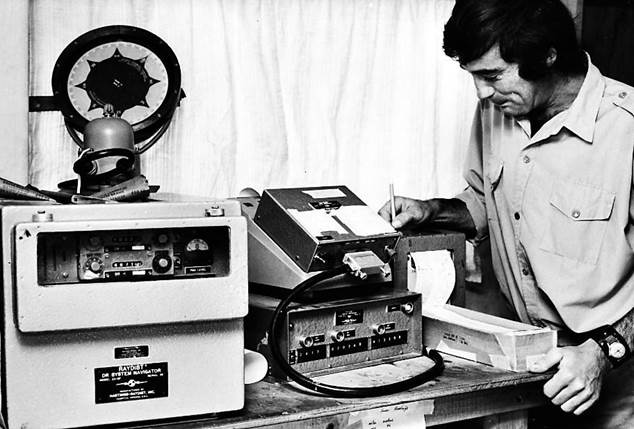
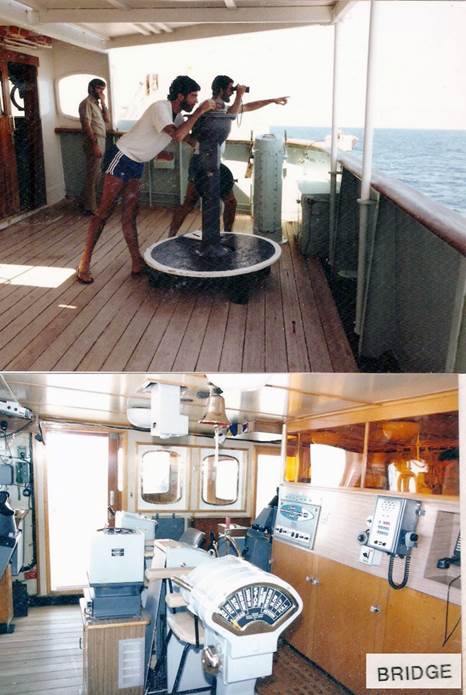
Initially position fixing from systems like Decca Hi-Fix or RAYDIST, was used. Such radio positioning equipment relied on the phase comparison of signals transmitted from known stations on shore. Depending on the location of the survey and shore terrain, two or three transmitting stations were established to cover the survey area and provide the signals for suitable fixes. One bathymetric survey off the New South Wales central coast during November 1974 used only basic triangulation to fix the positions of echo soundings. Three observers with theodolites at locations with known co-ordinates on-shore, simultaneously read the horizontal angle to a light on the MV Cape Pillar (see Figure 4) at each sounding location. The angles were already referenced to a known azimuth and basic trigonometry established the ship’s position. The procedure was slow in that the ship was stopped while the angles were read and as the ship moved further off-shore the light could only be observed at night.
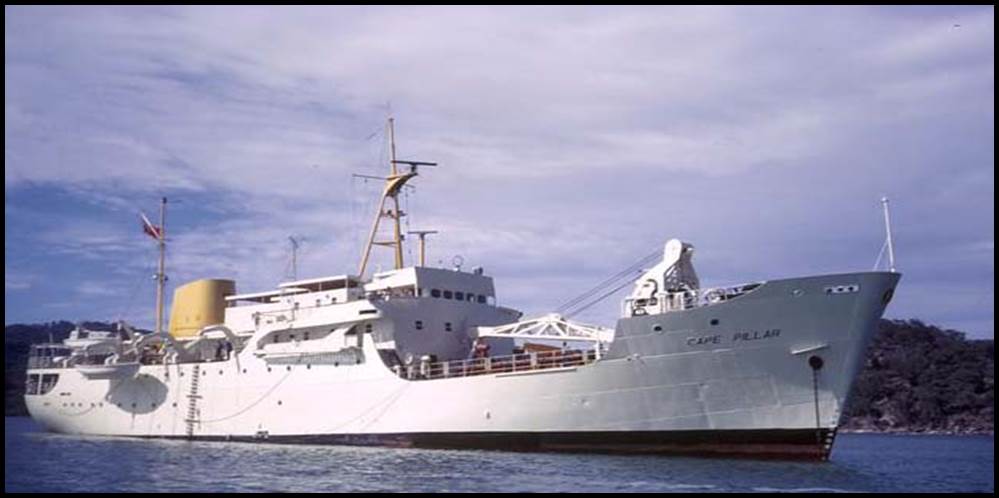
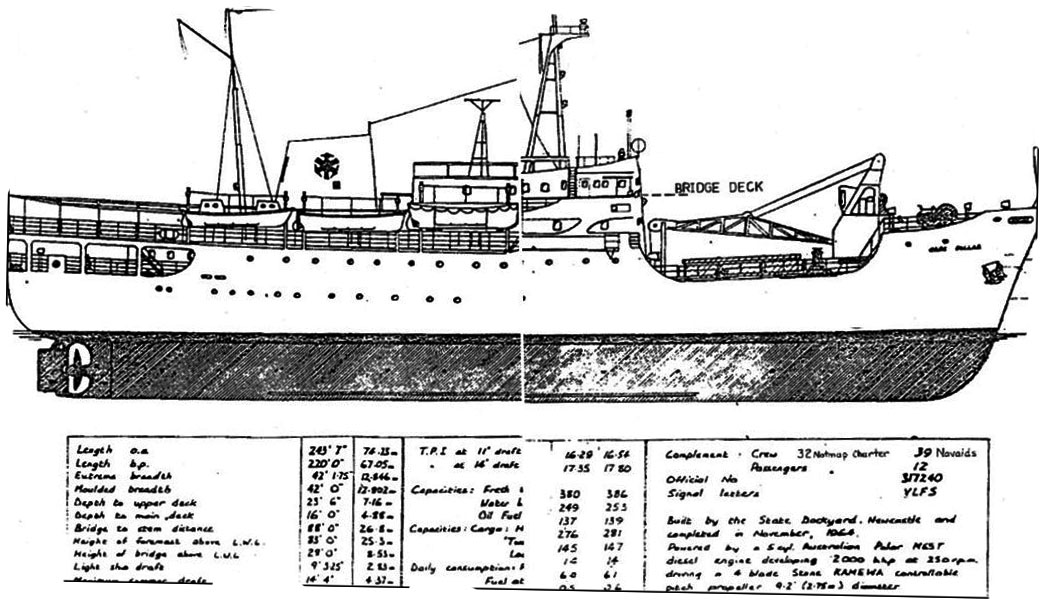
Figure 4 : Department of Shipping and Transport Navaids vessel, the MV Cape Pillar, used by National Mapping for the majority of the off-shore bathymetric surveys.
Velocity of Sound in Seawater
Several methods were used to check the velocity of sound in sea water. The traditional method was a bar check which involved measuring echosounder depths to a bar lowered to a known depth below the transducers of the vessel. This method was very cumbersome and only attempted on a few occasions. Positioning of the bar was difficult because of currents. It was only possible in very calm waters. See Figure 5.
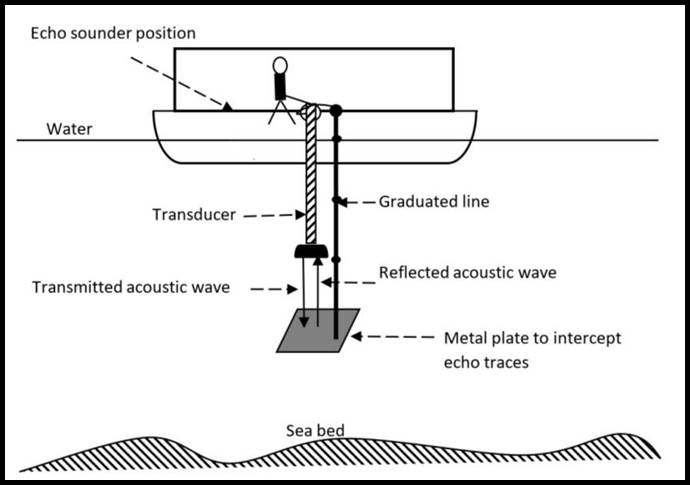
Figure 5 : Bar check using a metal plate in Instead of a metal bar.
Later a disk check was constructed whereby a transducer was mounted at one end of a 5 metre frame with a steel disk at the other end to act as a reflector. The transducer was connected to the echo sounder and the speed of sound dial adjusted to show the correct measurement on the echosounder trace. Upwards of 3 echoes were visible on the trace giving an effective depth of 15 metres. See Figure 6.
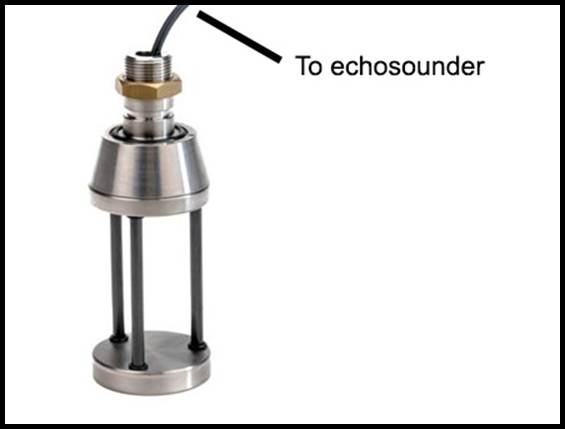
Figure 6 : A modern type of disc check
For deep water an Expendable Bathythermograph (XBT) was used to measure a profile of water temperature from which a mean velocity of sound in water was calculated. See Figure 7. The speed of sound in seawater depends upon temperature, salinity, and depth but not frequency. See Figure 8. The temperature dependence is the strongest but also the easiest to measure. Salinity is more inconvenient to measure but also less important, the sensitivity of sound speed being only about 0.1% per g/kg of salinity. An average value of 35g/kg (or 35 ppm) was used to calculate the velocity of sound in sea water.
An Expendable Bathythermograph is a small probe that is dropped over the side of a ship. As it falls through the water, it measures temperature. Small wires transmit the temperature data back to the ship where it is recorded for further analysis.
|
|
|
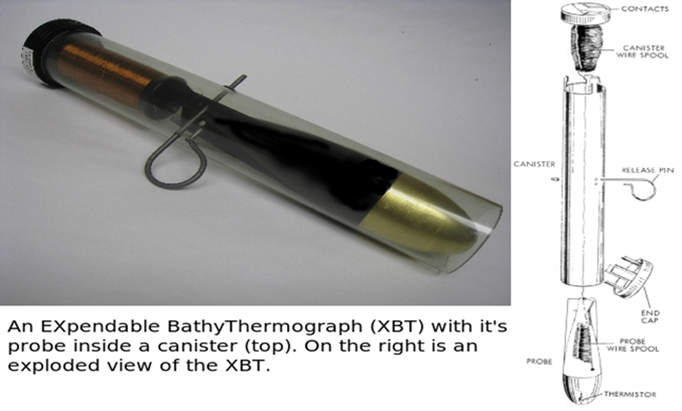
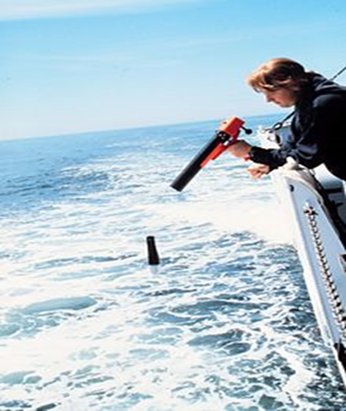
Figure 7 : (Left) An XBT and (right) launching an XBT.
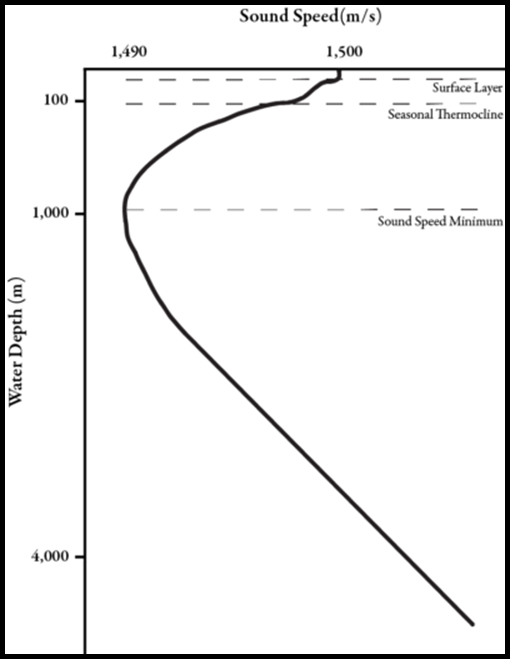
Figure 8 : A typical velocity of sound profile.
Satellite Doppler Positioning.
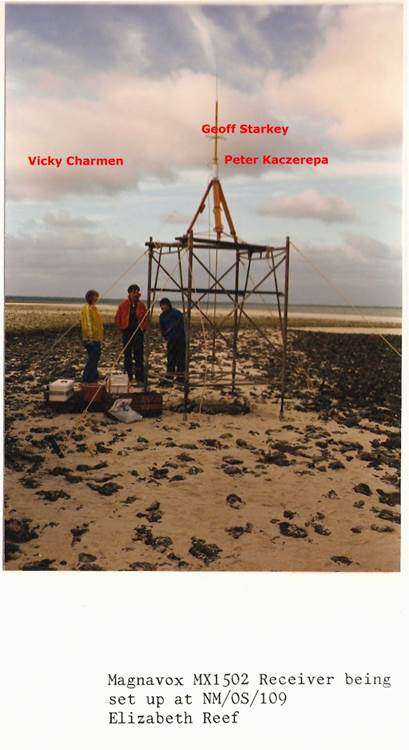
Satellite Doppler positioning, the forerunner of GPS (Global Positioning Systems), really impacted bathymetric survey position fixing. The then Navy Navigation Satellite System (NNSS) provided approximate geographical co-ordinates of the ship's position.
The satellites are in circular, polar orbits, about 1 075 kilometres high, circling the earth every 107 minutes. This constellation of orbits forms a birdcage within which the earth rotates, carrying us past each orbit in turn. Whenever a satellite passes above the horizon, we have the opportunity to obtain a position fix. The average time interval between fixes with the existing 5 satellites varies from about 35 to 100 minutes depending on latitude. This tracking process requires from 10 to 16 minutes, during which time the satellite travels 4 400 to 7 000 kilometres, providing an excellent baseline.
Because Transit measurements are not instantaneous, the motion of the vessel during the satellite pass must be considered in the fix calculations. Also, because the satellites are in constant motion relative to the earth, simple charts with lines of position are impossible to generate. Instead, each satellite transmits a message which permits its position to be calculated quite accurately as a function of time. By combining the calculated satellite positions, range difference measurements between these positions (Doppler counts), and information regarding motion of the vessel, an accurate position fix can be obtained. Because the calculations are both complex and extensive, a small digital computer is required.
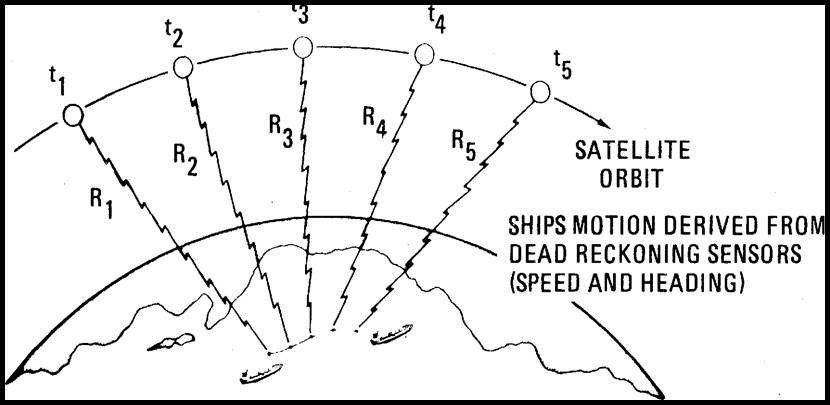
Figure 9 : A satellite pass
Transit was the only navigation system with total worldwide availability at this time. It is not affected by weather conditions, and position fixes have an accuracy competitive with short range radiolocation systems. Each satellite is a selfcontained navigation beacon which transmits two very stable frequencies (150 and 400 MHz), timing marks, and a navigation message. By receiving these signals during a single pass, the system user can calculate an accurate position fix. See Figure 9.
There are two principal components of error in a Transit position fix. First is the inherent system error, and second is the error introduced by unknown ship's motion during the satellite pass. The inherent system error can be measured by operating a Transit set at a fixed location and observing the scatter of navigation results. Dual channel results typically fall in the range of 27 to 37 metres rms. When in port satellite fixes were taken and compared with a known control point if available or checked for internal consistency. Between satellite fixes the computer automatically dead reckons based on inputs of speed and heading from a gyro and the sonar Doppler. The dead reckoning process also is used to describe ship's motion during each satellite pass. After the position fix has been computed, latitude and longitude adjustments are applied, thus correcting for the accumulated dead reckoning error. See Figure: 10.
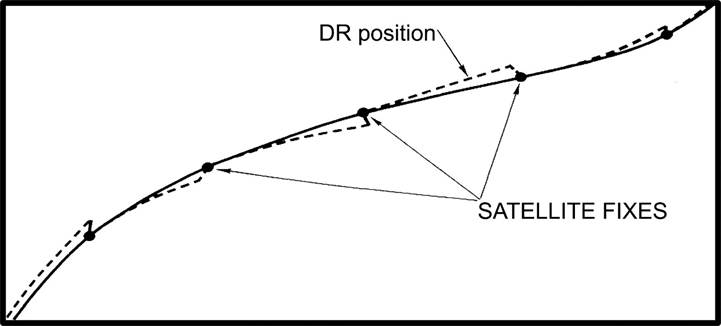
Figure 10 : Dead Reckoning (DR) error is corrected by each Satellite Position Fix Update.
Two calibration factors were calculated and applied via the computer. ABIA the error in azimuth and TADJ the speed error. The Transit system was based on WGS72 so corrections to bring the results to AGD66 were required. These corrections were calculated by computer in Canberra and taken into the field.
The accuracy of a satellite fix at sea was dependent on a number of factors the most critical being the vessel’s course and speed used in the computation. A one knot error in speed produced an error in position of as much as 500 metres while a one degree error in heading could mean a 50 metre shift off course. As the then satellite constellation could only provide an accurate fix once every few hours such errors had to be minimized. Course and speed data, when derived from gyrocompass and sonar Doppler, indicated positional accuracies of around ±75 metres could be achieved and while adequate for bathymetric mapping at 1:250,000 scale, it was insufficient for detailed hydrographic survey. Sonar Doppler uses the principle of Doppler shift to calculate the speed through water and when connected to a gyro the direction as well. Most sonar Doppler logs use a Janus configuration, named after the Roman god who looks both forward and backward. See Figure 11. A sonar Doppler system consisted basically of an electronics console with display panel and a hull mounted transducer array (simplistically a transducer converted electric impulses to sound waves). A signal was transmitted through the water in a 3° beam from each of four transducers set at 30° to the vertical towards the fore, aft, port and starboard of the vessel respectively. A portion of the signal was returned from the seabed and the effect of pitch and roll was cancelled by comparing the fore received signal with the aft and the port received signal with the starboard. The sonar system electronics then computed the velocity in each component and displayed the velocity and cumulative distance traveled along and across the longitudinal axis of the vessel.
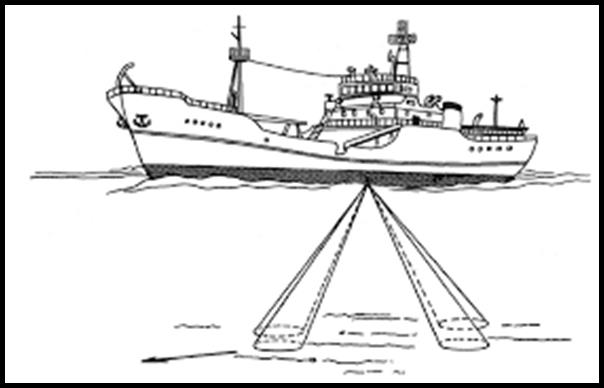
Figure 11 : The Janus Configuration.
The addition of a synchro-output from the gyrocompass enabled the display to be related to a desired heading or, in an alternative mode, in respect of true north.
A marine gyrocompass uses an electrically powered, fast-spinning gyroscope wheel to maintain an orientation to True North and is unaffected by external magnetic fields such as those created by ferrous metals in a ship's hull. The gyrocompass error was of the order of ± 0.5°.
The sonar Doppler equipment could operate in water depths of 20-300 metres. At greater or lesser depths the sonar signal could be erroneously reflected off a moving sub-surface water layer. This was called loss of lock and was always a possibility when going over the shelf edge at 200-300 metres depth. Loss of lock meant that the ship had to wait for the next satellite pass to reinitialize the system. Generally, the sonar Doppler provided results accurate to ±2-3 metres.
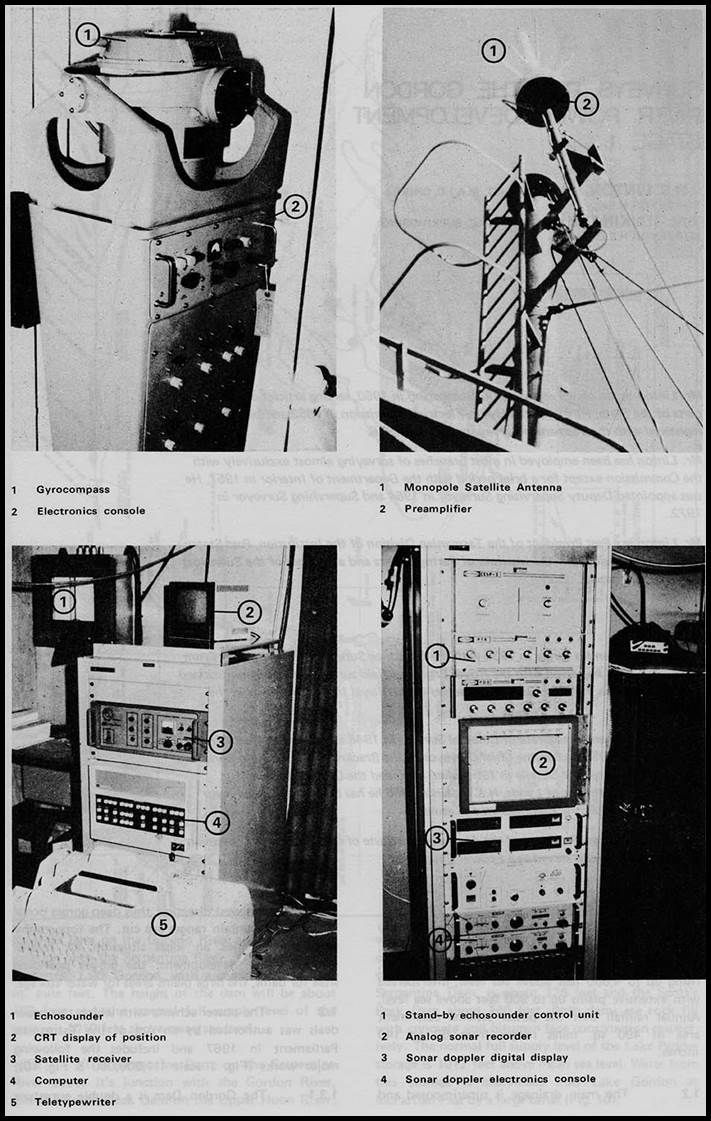
An additional requirement is a knowledge of the speed of sound in water near the sonar transducer. In most cases this can be determined to satisfactory accuracy by measuring water temperature, but if salinity is likely to change drastically, a velocimeter is required for best results. If the sonar Doppler transducer is not properly aligned with the compass's lubber's line, a dead-reckoned course will show a cross-track drift from the true course when compared to the next Transit fix. A calibration correction known as the ABIA is applied through the computer. With adequate calibration and the adjusting of observed positions against satellite fixes as required, the total system produced positioning data with an average error of less than +/- 100 metres. Photographs of typical satellite and sonar Doppler equipment are at Annexure C.
Global Positioning System (GPS)
When GPS started to come on line a Maganvox MX 1107 GPS/Transit receiver was purchased. GPS was only available for part of the day. To increase the availability of GPS coverage an atomic clock was interfaced to the MX1107. As the height above sea level was fixed at the antenna height and time was known accurately it was possible to obtain GPS fixes from only two satellites instead of the normal four satellites required. Production significantly increased using GPS as the sounding speed was increased from 10.5 kts to around 12 kts.
The HiFix6 system was used mainly in the Great Barrier Reef region. HiFix6 was a hyperbolic system using a chain of three transmitters, one as master and two as slaves. As with most such systems the operating principle was that the transmitters radiated a carrier phase locked to an accurate source, and the receiver (on the ship) measured the difference in phase between the signals received from the three transmitters. The phase differences produced a series of intersecting hyperboles called a lattice. See Figure 12. If we can establish our location along a hyperbola from each pattern, then we have found our position. In practice, one of the transmitters can be common to both pairs with HiFix6, this is the Master or A station; those at the ends of the two baselines are the B and C slaves. The diagram below shows a section of coastline with the 3 sites and their overlapping pattern of hyperbolae. It must be remembered that the fix was always in relation to the position of the chain transmitters, and these had therefore to be accurately known.
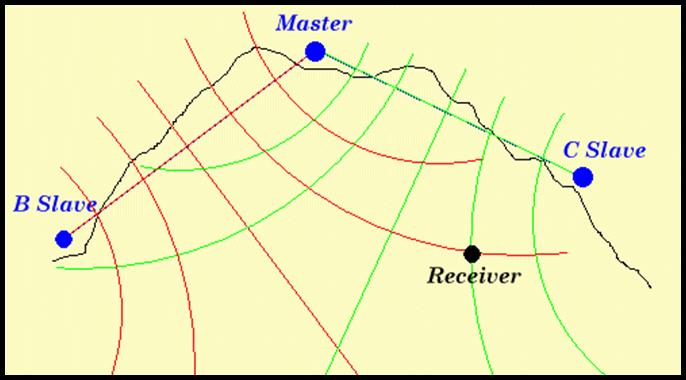
Figure : 12 Hyperbolic positioning
Points of zero phase difference are referred to as lanes. It is not necessary to rely on these however since the receiver can measure phase differences at points in between lanes. The maximum resolution of the system is expressed as the smallest distance within a lane that can be measured and is limited by a number of factors. In the case of HiFix6 the maximum resolution of the system is given as 0.01 lane, which at an operating frequency of 1905kHz would be 1.6 metres. Since the distance between hyperbolae and hence lanes increases with distance away from the transmitters, the accuracy of the system reduces in proportion. The operator would have to take this into account when a fix is obtained. The velocity of propagation used was 2999650 km/sec. The broadcast frequency of 1905 Khz gives a wavelength of 157.2966 metres and a baseline lane width of 78.65metres. Baselines used in the Great Barrier Reef ranged up to 90km and generally had a base angle of about 150 degrees at the master station. This arrangement was dictated by the shape of the coastline and resulted in considerable lane expansion on the edges. The resultant accuracy was considered to be better than 20m. HiFix6 is venerable to lane slip (the whole number of lanes may be incorrect by one or two lanes) and constant monitoring of position is necessary against known positions e.g., Miniranger positions, GPS or marker beacons.
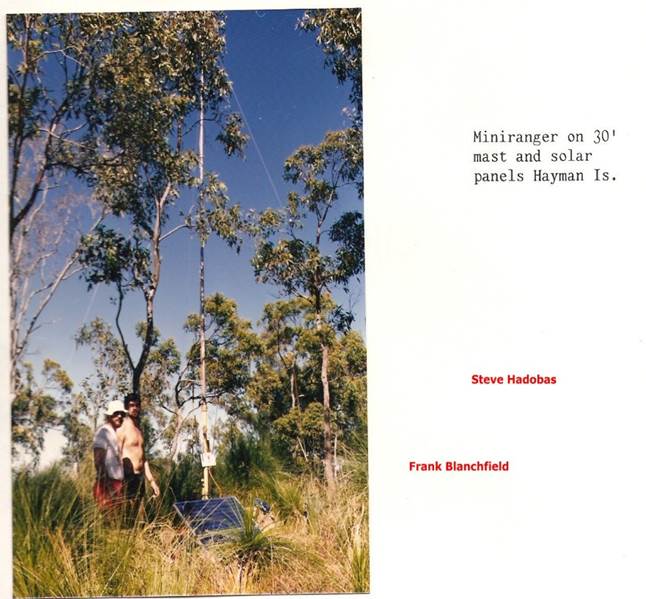
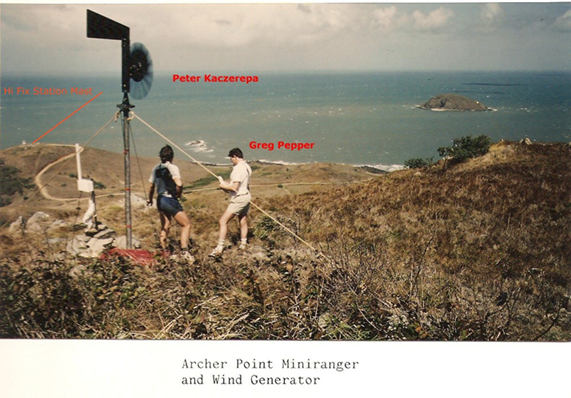
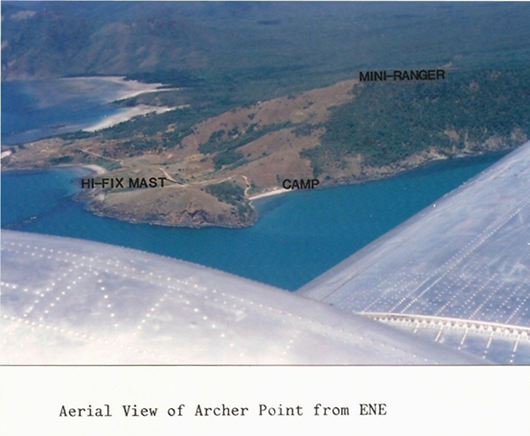
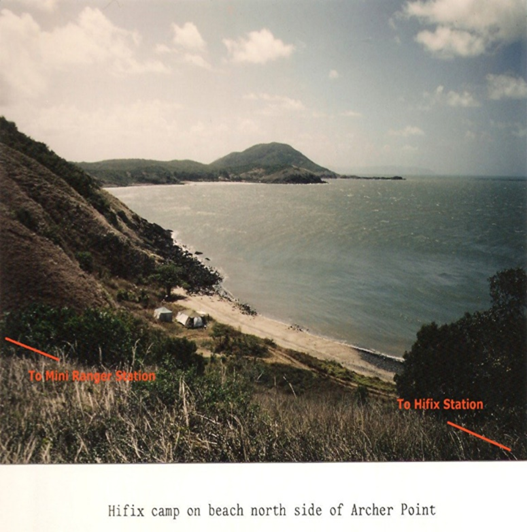
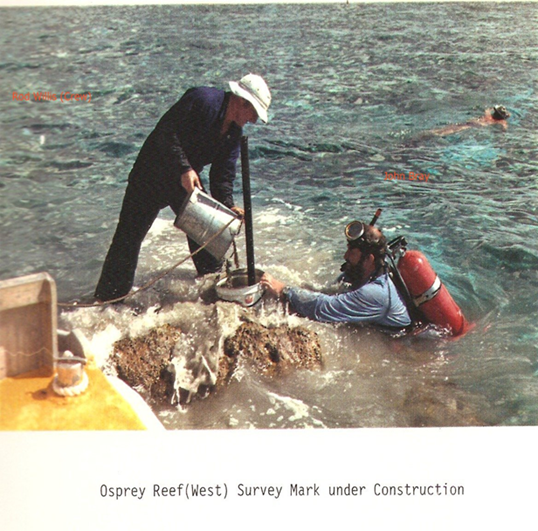
The HiFix6 transmitters used a 100 feet mast and required a steady power source and constant monitoring for stability of the transmission. Camps of two men were set up at each transmitter. These camps were also able to position Miniranger transponders on known points as required by the party leader. See Annexure E.
Miniranger is a product of the Motorola Corporation. It went through many development stages as Miniranger I/II/III. It operates in the C-Band microwave region at around 5.5 GHz, the transmitter power is 400 watts. The system works by measuring the time of flight of short (0.3 uS) pulses of radio energy. A fix was obtained by comparing the distance measurement (range) obtained in this way from 2 or more shore stations. Whilst the accuracy obtained is good, as with all microwave systems the disadvantage is that at these frequencies, the radio range obtainable is strictly line of sight. The range may be extended by mounting the shore stations on high ground and/or tall structures, and the ship-borne antenna at the top of the mast. The rotating antenna was an add on which improved range considerably, mainly as it was omni directional and did not suffer from blind spots especially when the ship was turning. The accuracy of the system is better than 3 metres and the maximum range is about 120 kilometres. Transponders are powered by 24 volt and require two 12 volt batteries. Batteries typically last two-three days. To reduce the need for battery changes solar panels and wind generators were used when possible. Theft of these items was a problem on occasions.
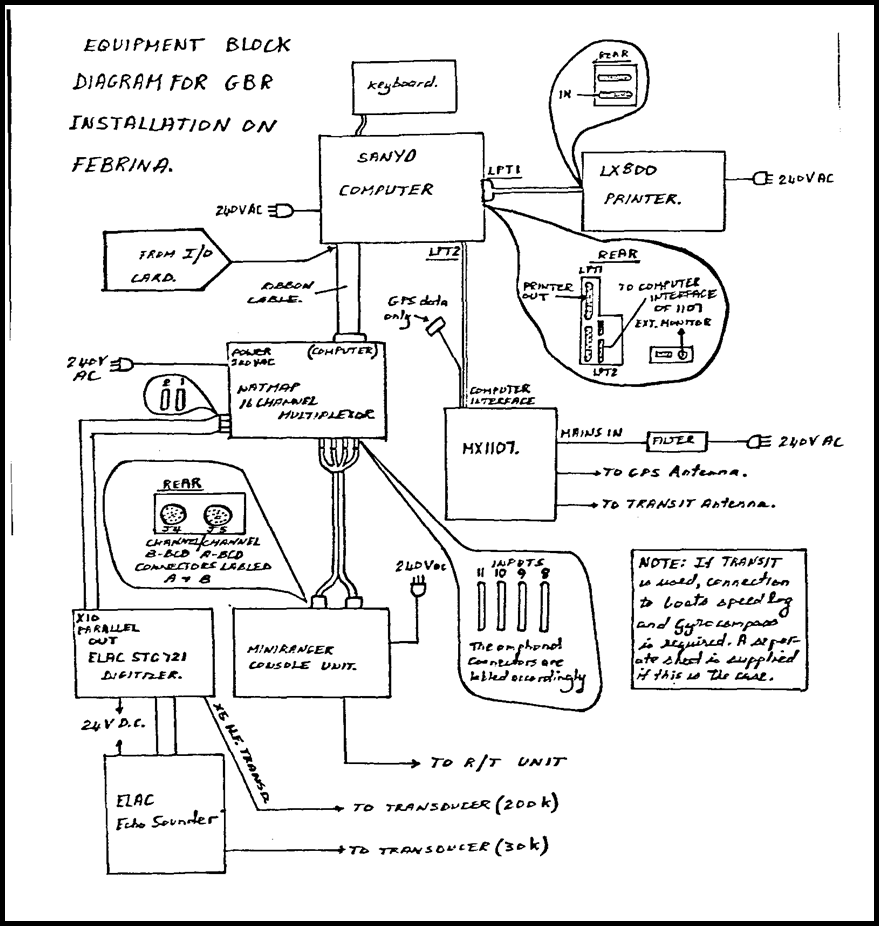
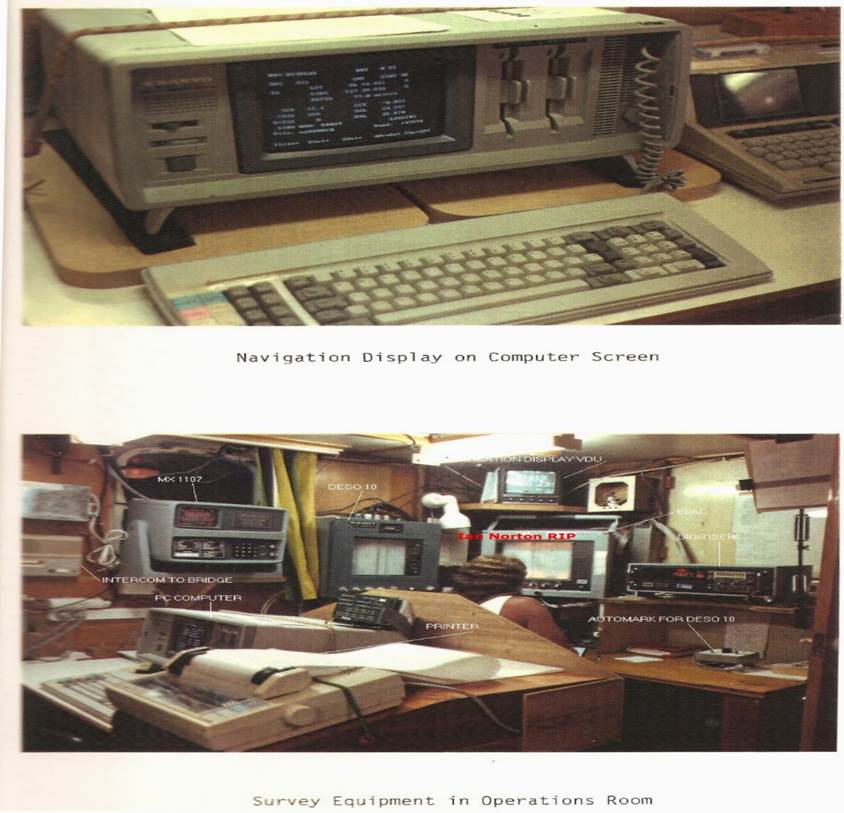
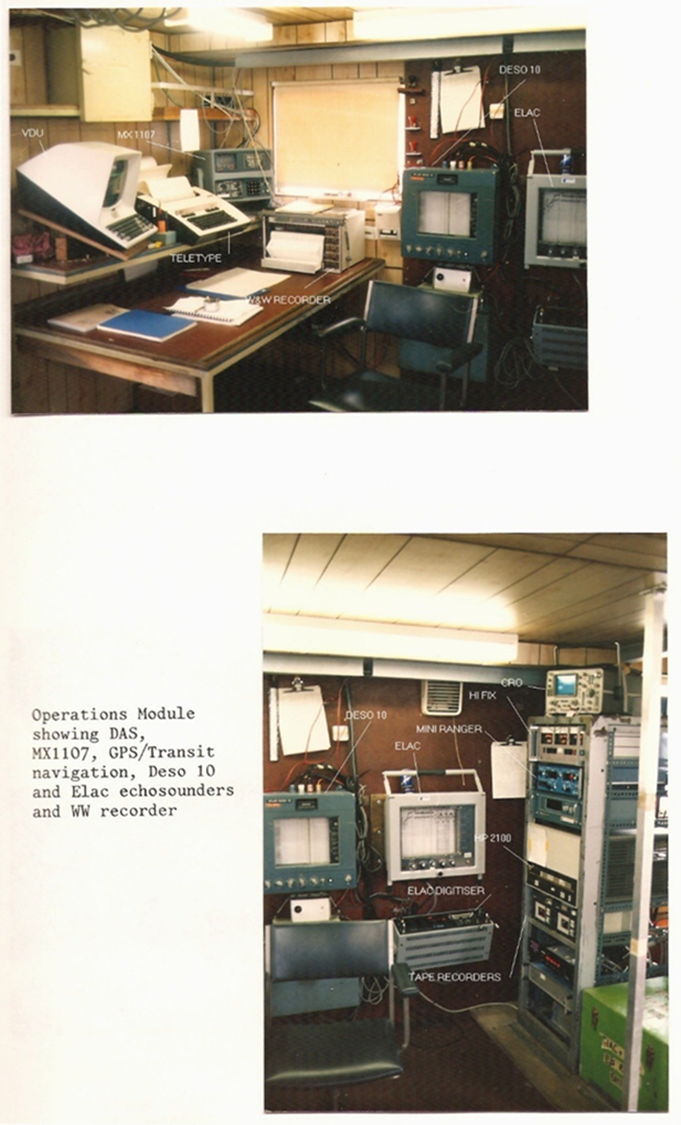
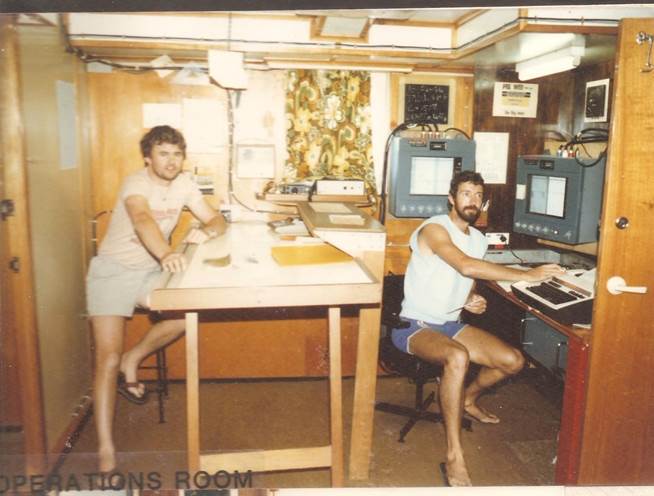
All navigation systems were eventually combined with Atlas Deso 10 or 20 or Elac echo sounders and a computer to form a variety of Data Acquisition Systems. The computers were HP 1000, HP 21 MX, HP 85, Sanyo and Compaq PC. Most of these systems were developed in house. A typical Data Acquisition System is shown in schematic form in Annexure D.
Before sounding can commence the Surveyor in Charge must draw up the sounding pattern. Off shore sounding by the MV Cape Pillar consisted of parallel lines 3 000 metres apart. Lines were at right angles to the coast line. Mostly East-West, North-South or in some cases at about 45 degrees. The ships Master would be consulted regarding the cut-off point for the inshore end of the line so the ship would not be in danger of grounding. In places the 20-metre depth would be close to shore in others such as the Gulf of Carpentaria it may be 15 km offshore. When the sounding line did not reach the 20-metre depth the small boat would be used to fill in the missing section. See the next section for details of small boat sounding. The off shore end of line was the 300 metre depth in most cases. However, this point was not exactly defined so a bit extra was added to ensure the line was completed.
In the Great Barrier Reef sounding lines were spaced at 2 000 metres apart. Initially they were to be 1 500 metres apart but this proved to be too expensive. Many of the lines done by contractors in the North West shelf area were at 1 500 metre spacing. Drawing the sounding lines in the Great Barrier Reef area was quite complex at times.
To commence a sounding line the watch keeper would enter the end points into the computer and then assisted by the Navigation VDU guide the ship on to line by giving course corrections to the Bridge. The Navigation VDU showed data such as current position, UTC, distance along line, distance to end of line, cross course error, ships heading and course made good. Once on line the ship was kept on line by fine corrections, keeping the cross course error within specified limits. The assistant watch keeper was responsible for operating the echosounder. Annotating the roll with the start and end of line, adding depths at each 2-minute fix, noting changes of scale for the soundings etc. Surveying echo sounders have many scale ranges to enable a clear trace of the ocean floor. E.g., 0-100, 50-150, 100-200, and most importantly, keeping an eye on the trace to warn of any sudden rise in the sea bed. Once the line was completed it was over to the bridge to make the turn onto the next line, guided by the watch keeper. After each satellite fix the positions of all points since the last fix were adjusted using a HP calculator.
An overview of the bathymetric survey task is provided by these Sounding Instructions produced by Natmap in 1978.
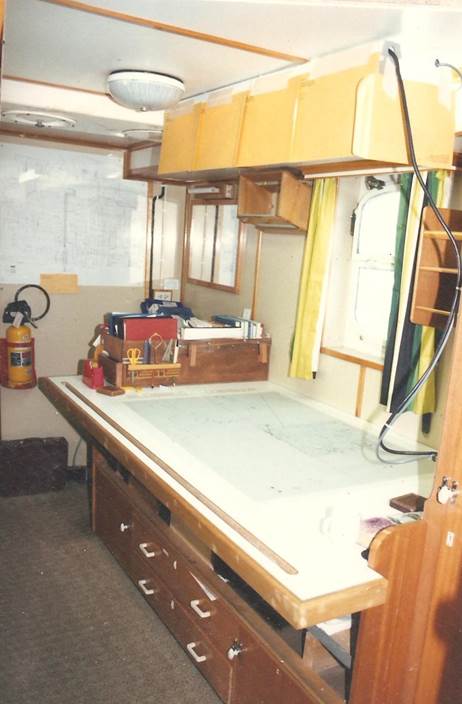
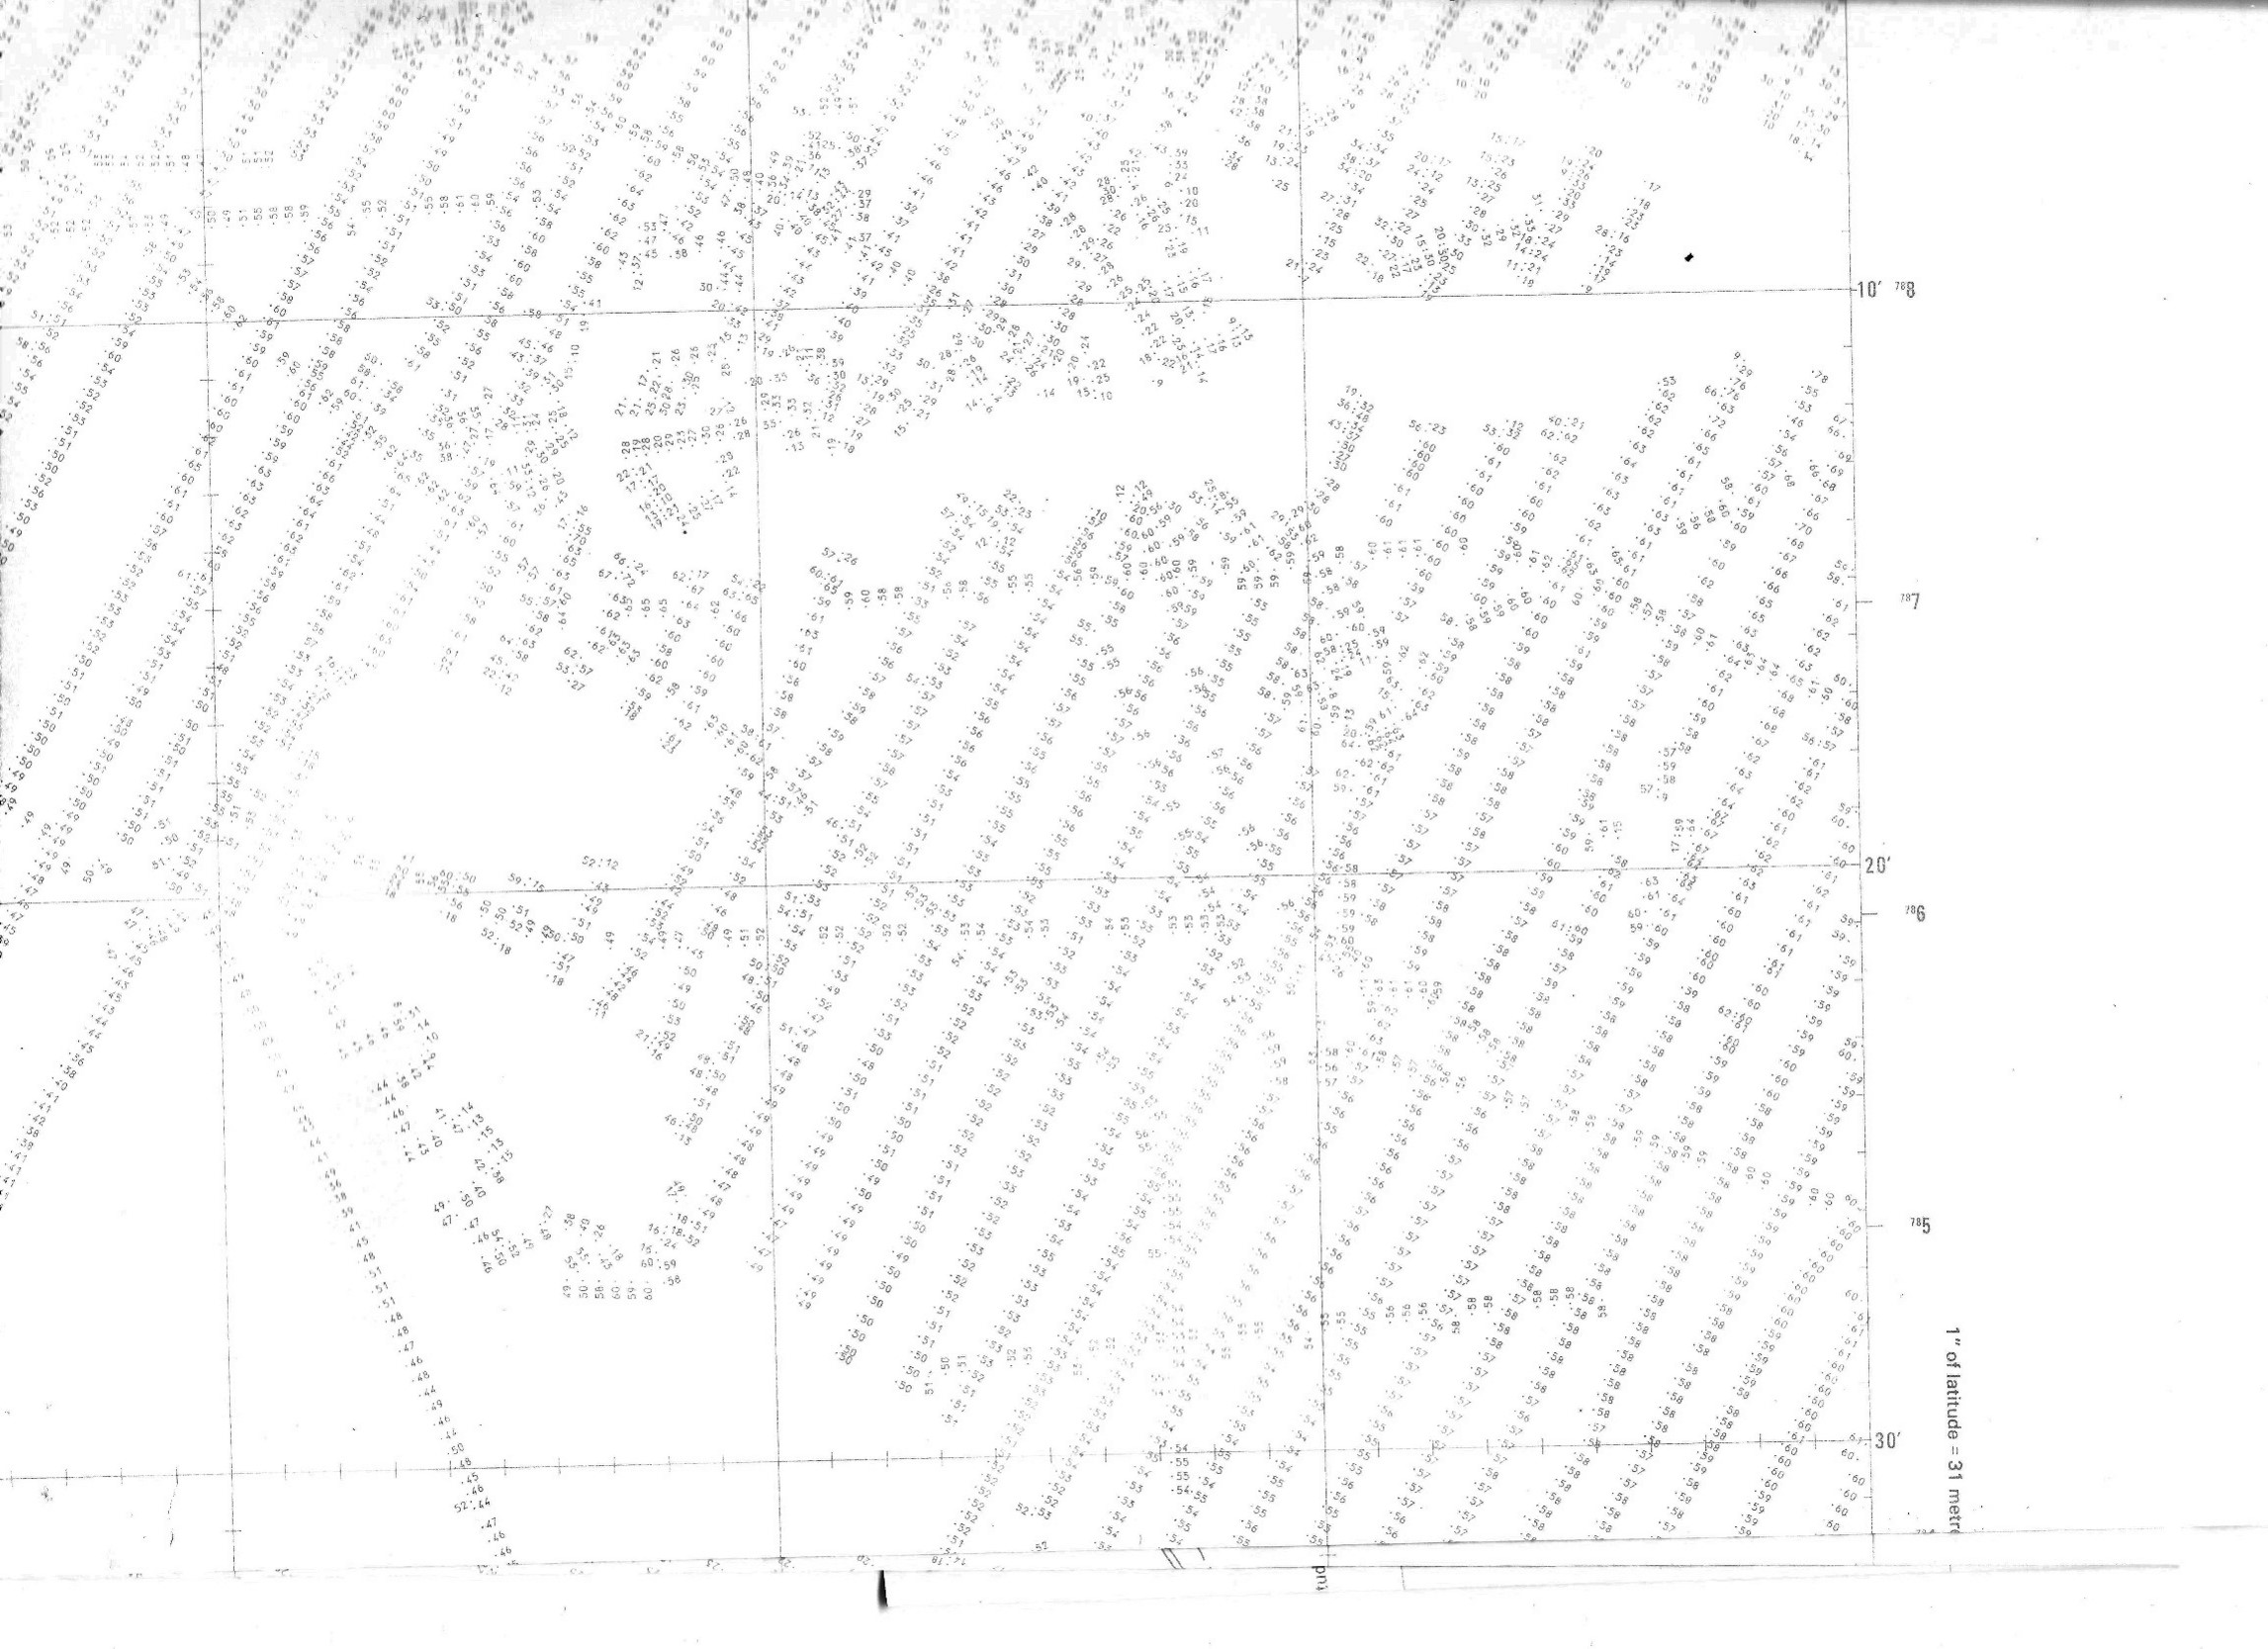
During the survey, the positioning, and uncorrected echosounder depth data were plotted continuously on the track plot sheet at a scale of 1: 150 000 as well as being recorded in a log book. Plotting was done using specially constructed templates. The templates were 10’ by 10’ and varied according to the Latitude and Longitude being plotted. Refer to Figures 13 and 14 below and Annexure E. In this way the predetermined lines of echosounder depths were maintained, positioning data checked and areas of seabed relief requiring further echo sounding brought to notice whilst in the area. The plot sheet was then used to provide a base from which the manuscript map was drawn.
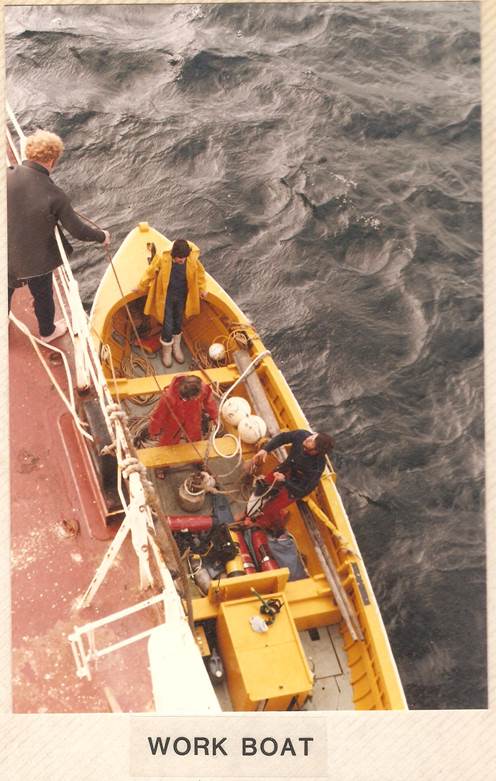
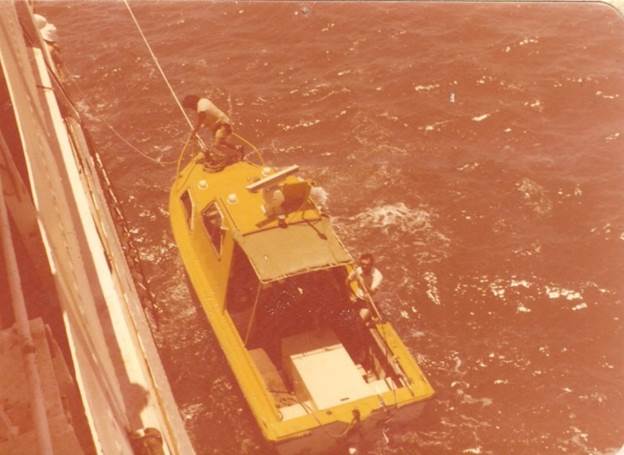
In shallow water where it was too dangerous for the ship to sound the Natmap Launch was used to do the sounding. The launch was fitted with a Miniranger transponder and an echosounder. The usual procedure was for the ship to anchor and wait for a satellite fix. Sounding lines were then run in a series of lines radiating from the ship. The launch’s position was determined by Miniranger distance and gyro azimuth from the bridge wing repeater. The positions were plotted using a compass rose and scale ruler. After each fix course correction were given as necessary. After completing sounding at one position the ship would move to the next position. Sometimes sounding lines were run parallel to the ship or in a zigzag pattern as it steamed parallel to the coast.
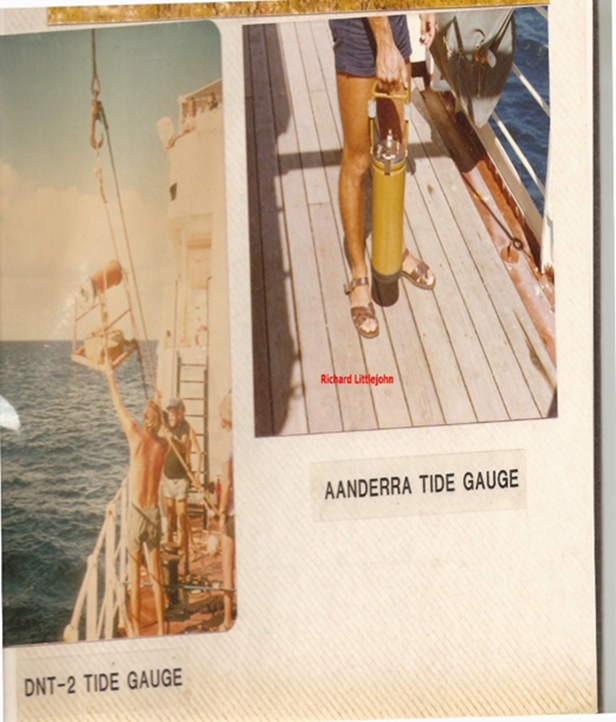
Tidal observations were made using bottom mounted gauges such as : NBA Controls model DNT1/2, Aanderra model WLRS5, Microsystems model TG12A and Endeco model SSM1O32. The Endeco is a fully digital model and the readout is processed on a PC or HP 85 to obtain the resulting depths in the field. The data was also transferred direct to our automated data processing computer.
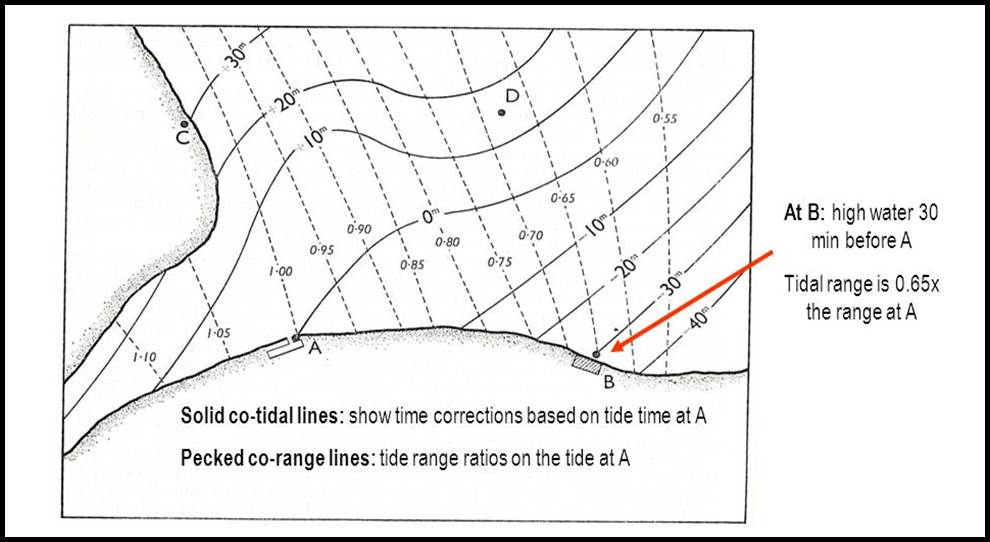
Analysis of tidal data was done on a HP 85 computer using a tidal program developed by the Canadian Hydrographic Service. Cotidal charts were prepared by hand as required. A Cotidal chart, part of which is shown in the diagram below, shows contours of height ratios and time differences between a number of tidal stations. It is used to convert predictions or observations made at any point to any other point.
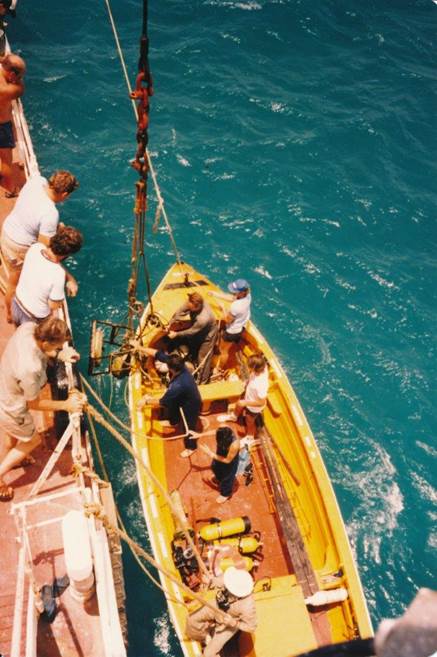
To place tide gauges on the ocean floor in shallow waters (less than 20 metres) divers are used to select a suitable site, record accurately the depth and ensure that the gauge is level and well secured. They are also used to ensure that the gauge is not snagged before lifting the gauge. They also assist in searching for a lost or damaged gauge. Initially MV Cape Pillar crew performed these tasks, however, with crew cutbacks and operations commencing in the Great Barrier Reef NATMAP trained its own squad of volunteer divers for this purpose.
|
|
|
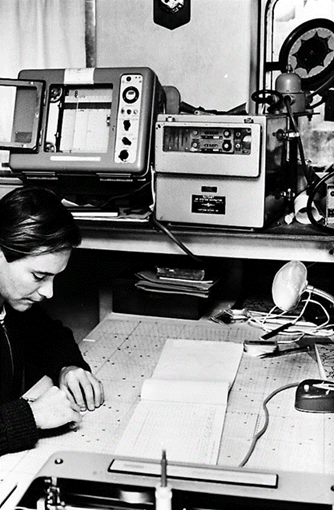
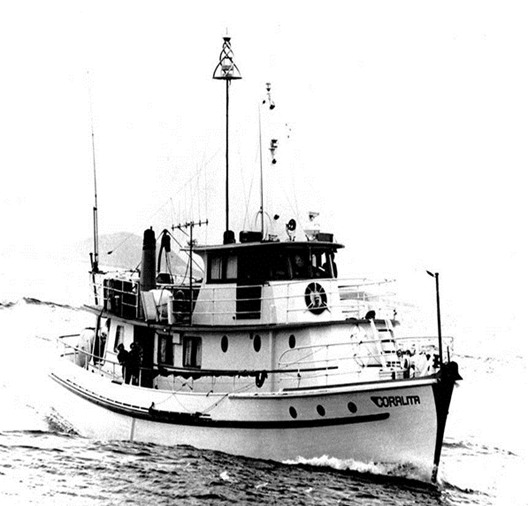
Figure 13 : September 1971 aboard the Australian Maritime Services’ MV Coralita. Contractor Tim Archer with the plot of positioning and uncorrected echosounder depth data and log book.
The echosounder chart recorder (left) and RAYDIST positioning equipment (right) can be seen in the background.
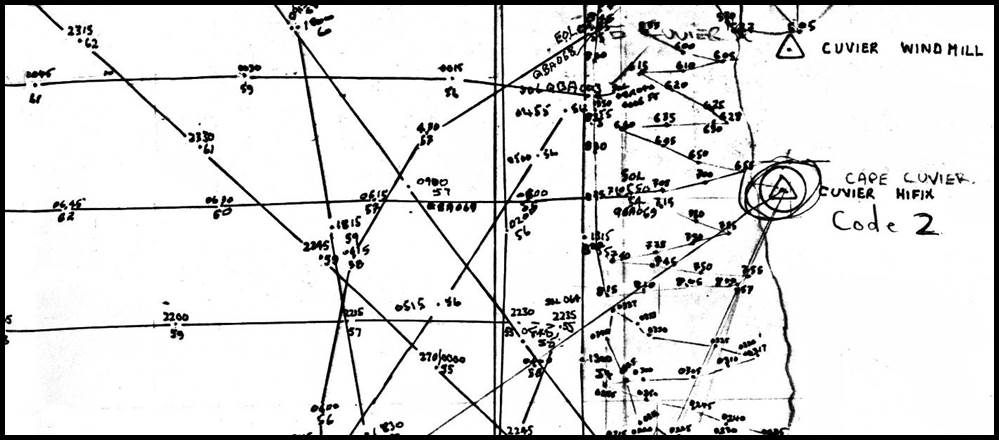
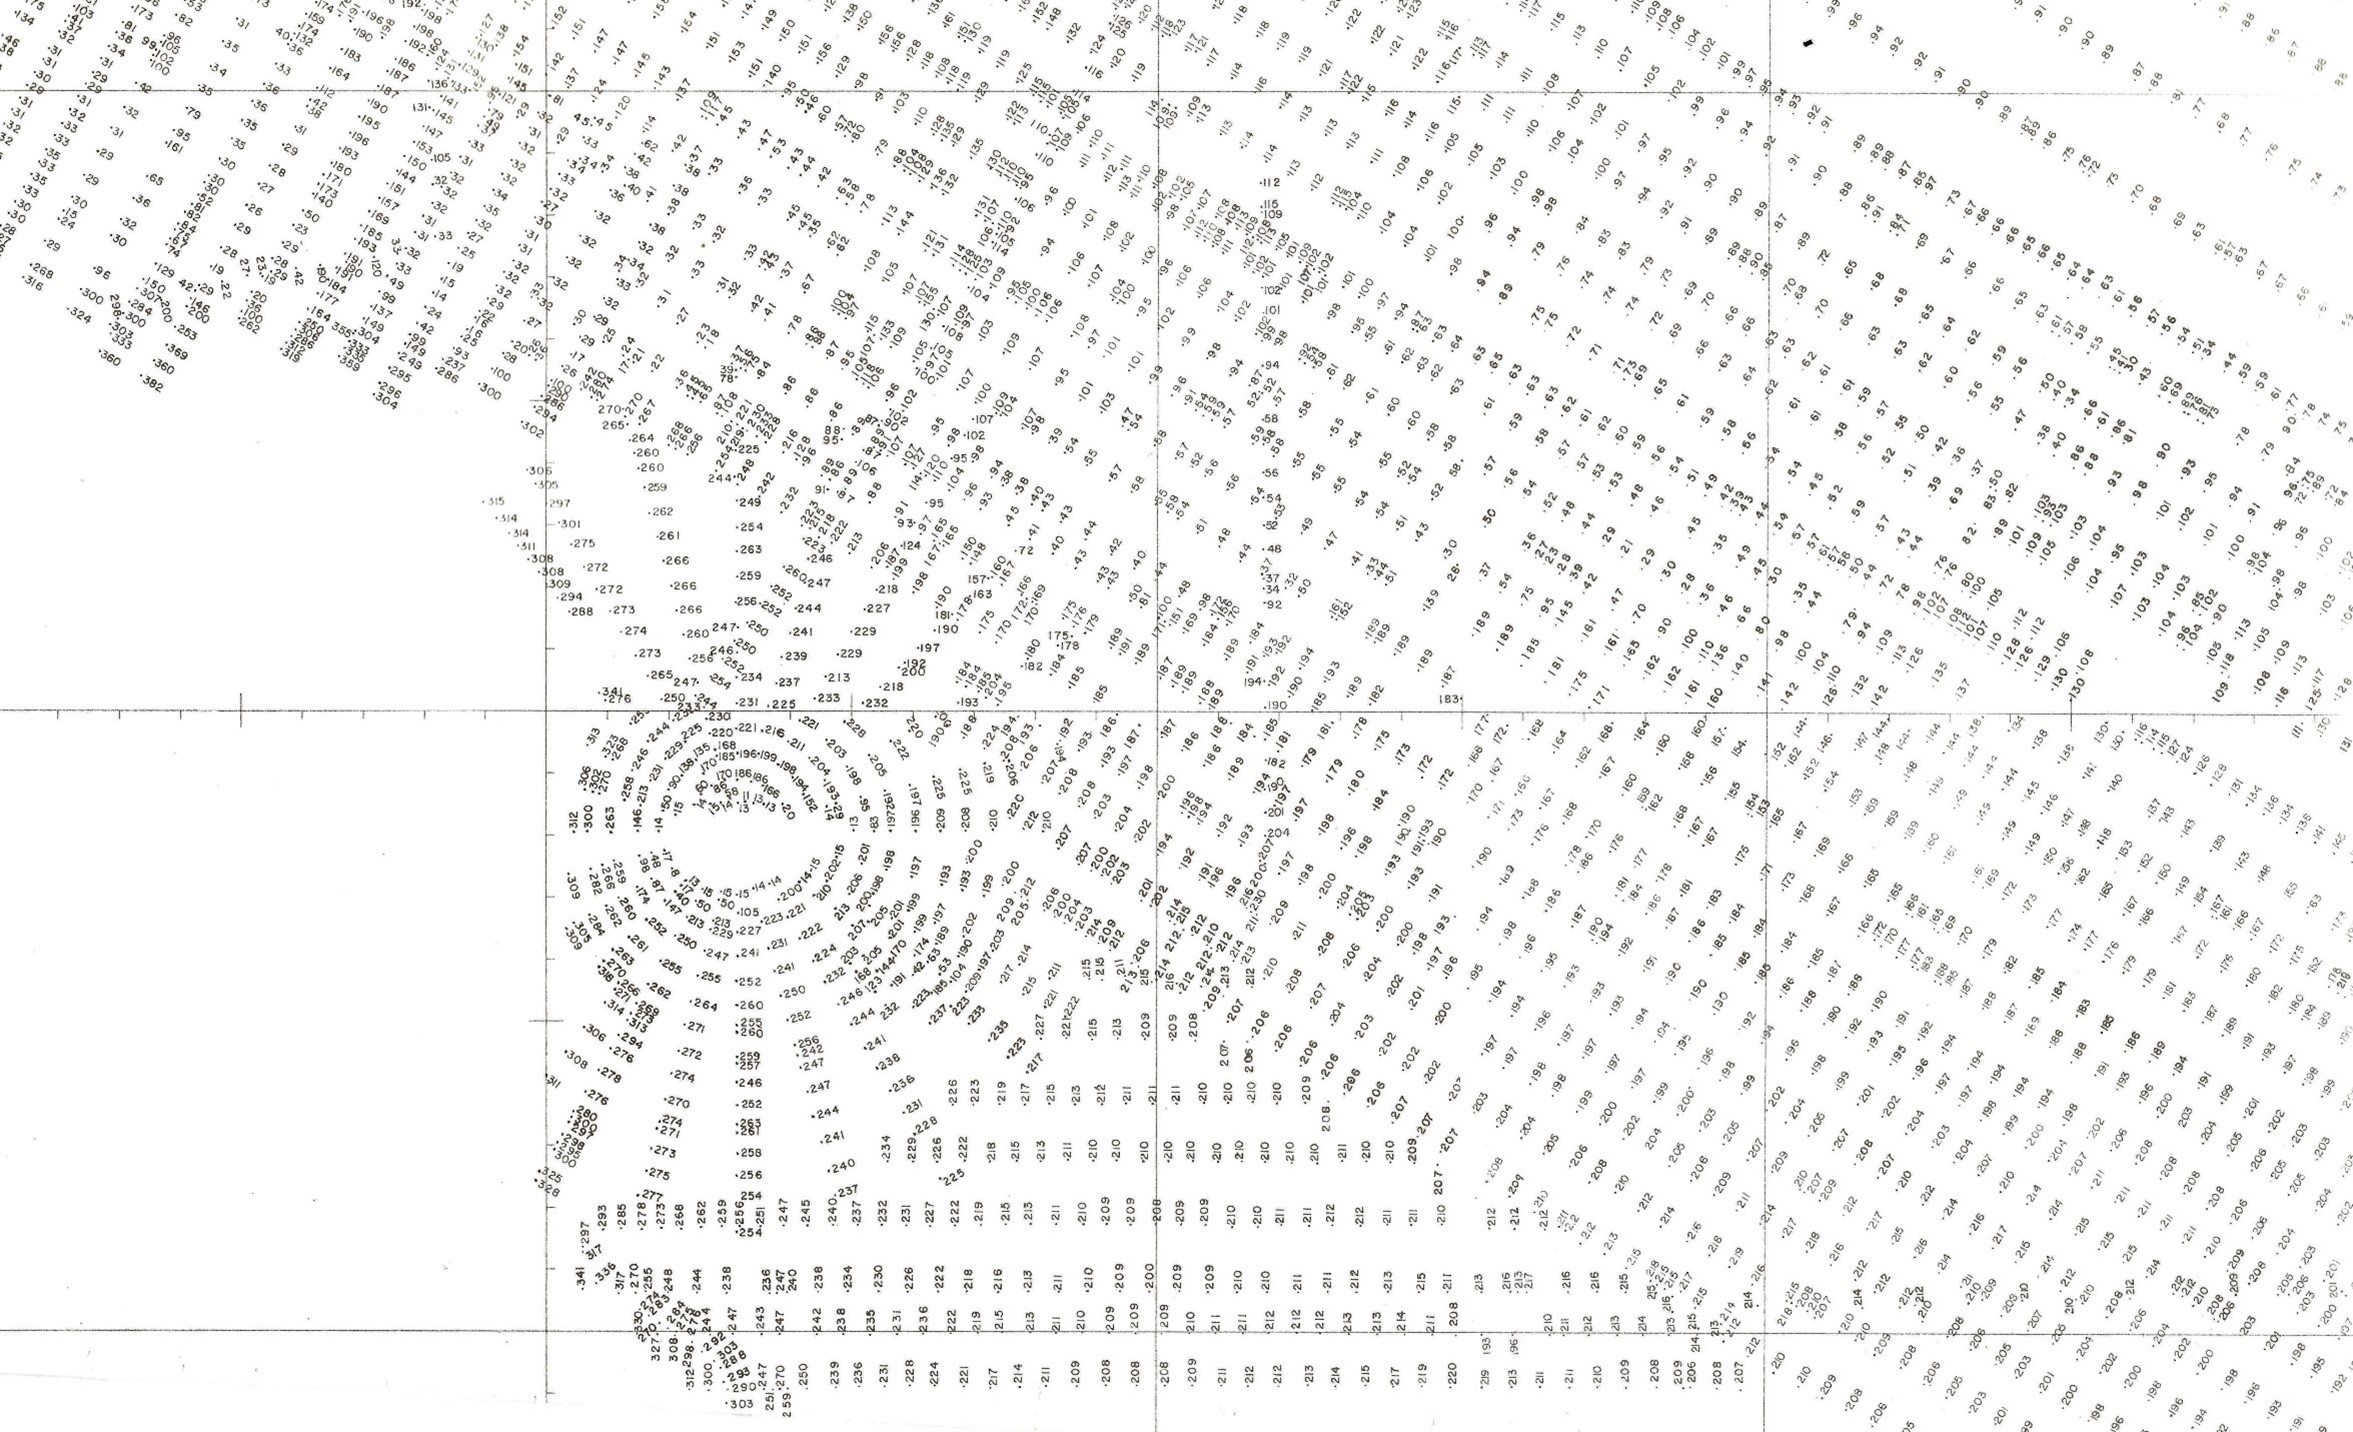
Figure 14 : Section of a track plot sheet showing positioning and uncorrected echosounder depth data for both in-shore and off-shore surveys along with the location of the on-shore Decca Hi-Fix installation at Cape Cuvier.
Initially each 1:250,000 map sheet was broken up into 4x1: 150 000 scale manuscript sheets. Corrected fixes were traced onto the manuscript sheets from the track plot sheet. The map showed each fixed position, usually at approximately 1000-metre spacings along the lines of echo soundings, and the echosounder depth data corrected to mean sea level from which the contours were interpolated. The position of soundings between fixes was interpolated using 10-point dividers. After tide corrections were applied individual soundings were inked in with a 0.015 Rapidograph pen and a stencil. It was a very tedious operation. There are approximately 12 000 soundings on a map sheet. After Natmap acquired a large format Kongsberg flatbed plotter, track plot sheets and manuscript sheets suitably gridded were prepared at a scale of 1: 150 000 covering a 1: 250 000 map sheet. When digitizing of soundings was introduced manuscripts were plotted on the Kongsberg plotter, initially on paper to edit soundings and adjust the orientation of some soundings to prevent overlapping. The final sheet was then plotted in ink.
Contouring of the map sheet was done by hand initially in pencil and then after checking they were inked up.
To avoid duplication copies of navy fair charts (the equivalent of manuscripts) were obtained on stable based material. Control points were converted to AGD to ensure accuracy of the enlargements/reductions. Correction to mean sea level from the datum on sheets were computed and contouring completed. These sheets were then brought to a scale of 1: 150 000 by various means. Pantograph, Hohn and Han optical pantograph or photographic reduction/enlargement. The contours were then traced onto the relevant manuscript map. Soundings were not shown on the back of the map for areas covered by RAN Fair Sheets.
Co-operative Activities including Opportune Data Collection whilst at Sea
Close liaison was maintained with the Hydrographer, Royal Australian Navy, to avoid duplication of effort and ensure that the bathymetric surveys assisted the hydrographic charting program as much as possible.
In addition, during the course of the bathymetric survey operations other scientific data were routinely collected. The acquisition of these data was with the proviso that its collection did not interfere with or impact fundamental bathymetric operations. These additional data sets included :
|
- |
Continuous sea surface temperature for the CSIRO Division of Fisheries; |
|
- |
Six hourly weather reports telegraphed to the Bureau of Meteorology from its on-board equipment; |
|
- |
Bathythermograph records transmitted to the National Oceanographic Data Base; |
|
- |
Hydrographic Notes submitted to the Hydrographic Office reporting new shoals discovered and additional data about existing shoals; |
|
- |
All tidal observations were submitted to the Hydrographic Office and the National Tidal Facility at Flinders University in Adelaide; |
|
- |
All Reports of Survey (compiled at the end of each project) together with completed manuscripts (copies) were submitted to the Hydrographic Office; |
|
- |
Tide gauge calibrations for Harbor Authorities were completed when time was available, (usually at crew change time); |
|
- |
Lighthouse positions were fixed by satellite observations (MX1501) on an opportunity basis (the position of most lighthouses have never been properly surveyed); |
|
- |
Magnetometer observations using equipment provided by the Bureau of Mineral Resources to provide detailed magnetic anomaly data; |
|
- |
Seabed profiles used by the Bureau of Mineral Resources to study the micro- geomorphology of the seabed; and |
|
- |
Echosounder charts used by the Division of Fisheries of the Department of Primary Industry to extract information on the nature of the seabed and fish distribution to assist in trawling operations. |
The bathymetric surveys were truly of unchartered waters. Survey vessels became grounded near Vashon Head (Cobourg Peninsular NT),Truant Island (near Gove) and Elphinstone Rock (Melville Island). The most serious incident however, occurred in 1984. While on survey to the east of the Archipelago of the Recherche, southern Western Australia, the MV Cape Pillar struck an uncharted rock pinnacle and only the quick actions of the crew saved it from sinking. More detail can be found via this link.
More tragic was the death of Natmapper John Wright in an innocuous personal accident that occurred while he was on land-based bathymetric survey duties at Lucinda, North Queensland.
Bathymetric Mapping and Australia’s Exclusive Economic Zone (EEZ)
Unmanned submersibles and Side-scan Sonar today provide information on the sea-bed never previously available, and certainly in much greater detail than the bathymetric maps of the 1970s-80s. Refer to Annexure F for a detailed bathymetric map sheet index showing work completed and Annexure G to view some sample maps. Nevertheless, Australia’s Exclusive Economic Zone (EEZ) today provides for jurisdiction over a marine area of some 10 million square kilometres and the basis of this zone can be traced back to data from the bathymetric mapping program (by comparison the Australian landmass is only 7.7M sq.km).
If a person had been a long term member of the Bathymetric survey, he would have spent over 1 000 days at sea travelled over 150 000 nautical miles and circumnavigated Australia two or three times.
The assistance of Bruce Willington, Laurie McLean, Con Veenstra, Charlie Watson, Simon Cowling and John Knight in the preparation of this paper is greatly appreciated.
Department of Resources and Energy (1987), Annual Report, Australian Government Publishing Service.
Division of National Mapping (1987), Bathymetric Survey Report : Cape Pillar Surveys : No. 1 of 1987, 23 November 1986 to 12 May 1987, internal report.
Division of National Mapping (1988), Bathymetric Survey Report : TSMV Febrina : No. 2 of 1988, 18 July to 3 November 1988, internal report.
Lines, John Dunstan (1992), Australia on Paper: The Story of Australian Mapping, Fortune Publications, Box Hill, Victoria, ISBN 0646097695.
Knight, John (2014), Personal Communication, March 2014.
McRae, Vicki (1987), Bathymetric Survey : MV Cape Pillar : 9 April - 12 May 1987.
McLean, Laurie (2014), Len Turner (1932-2002): Nat Map's Consistent Quiet Achiever, XNATMAP website article at : http://xnatmap.org/adnm/people/aabout/LGT.htm
NATMAP (1972 - 1986), Statement of Activities, Division of National Mapping, as published annually between 1 July 1972 and 30 June 1986.
O’Donnell, Peter (1982), Bathymetry – The Decade Ahead, Technical Papers, Australian Congress of Survey and Mapping, Canberra 1982, pp. 79-83.
O’Donnell, Peter (2014), Personal Communication, April 2014.
Stansell, Thomas A (1978), The TRANSIT Navigation Satellite System, Navigation, MAGNAVOX Government and Industrial Electronics Company, R-5933A.
Turner, Leonard George (1974), Mapping Australia's Continental Shelf, Technical Papers, Australian Survey Congress, Melbourne, February 1974, pp. 128-135.
Turner, LG and Mitchell, HL (1977), Satellite Imagery and its Applications to Offshore Mapping in Australia, Technical Papers, Australian Survey Congress, Darwin, May 1977, pp. 89-97.
Veenstra, Con (1984), Mapping the Australian Continental Shelf, Technical Papers of the 12th Conference of the International Cartographic Association, Perth, August, 1984, Vol. 1, pp. 411-421.
Willington, Bruce (2014), Personal Communication, July 2014.
|
Summary of Expenditure and progress on Bathymetric Program |
|
|
Bathymetric Activity by Year |
|
|
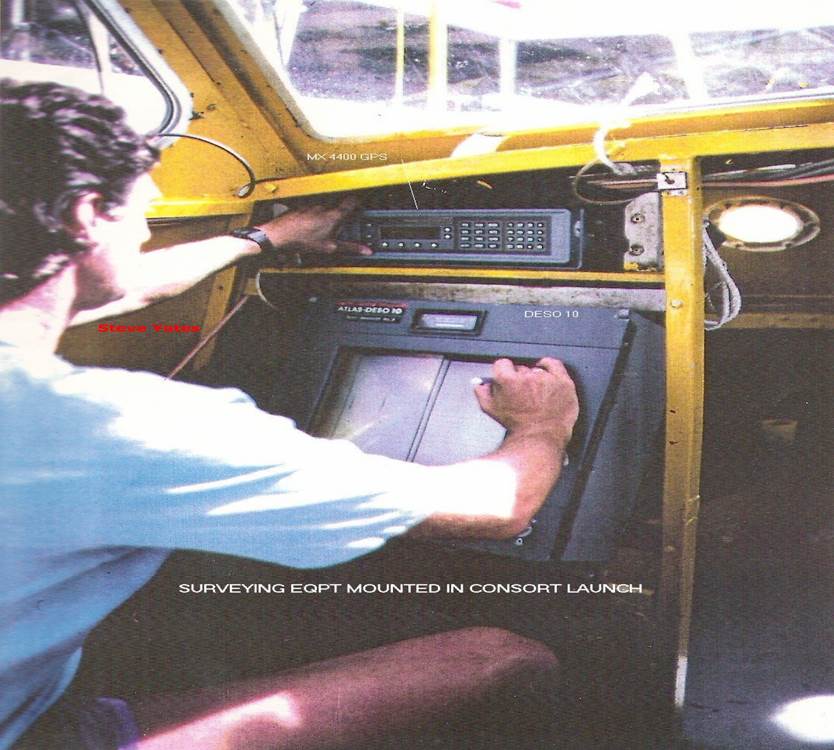
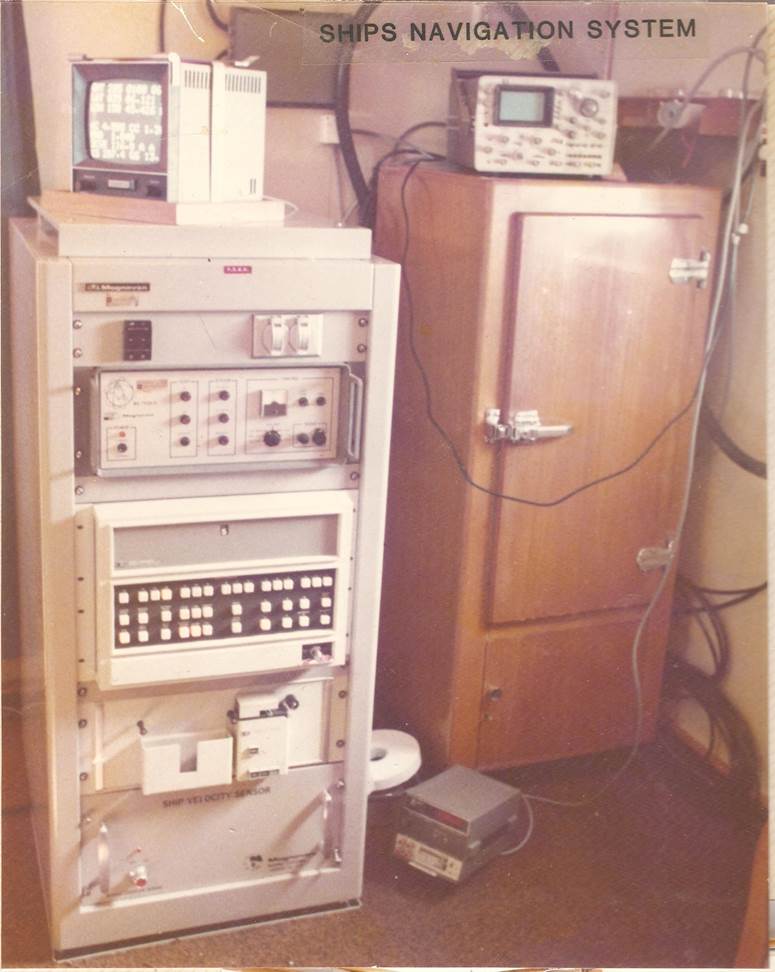
Photographs of typical satellite and sonar Doppler equipment |
|
|
Schematic Diagram of Data Acquisition on Great Barrier Reef Project |
|
|
Further photographs of the equipment |
|
|
Bathymetric Map Sheets-Publication Status |
|
|
G. |
Sample Bathymetric Maps |
|
Bathymetric Program Personnel |
|
|
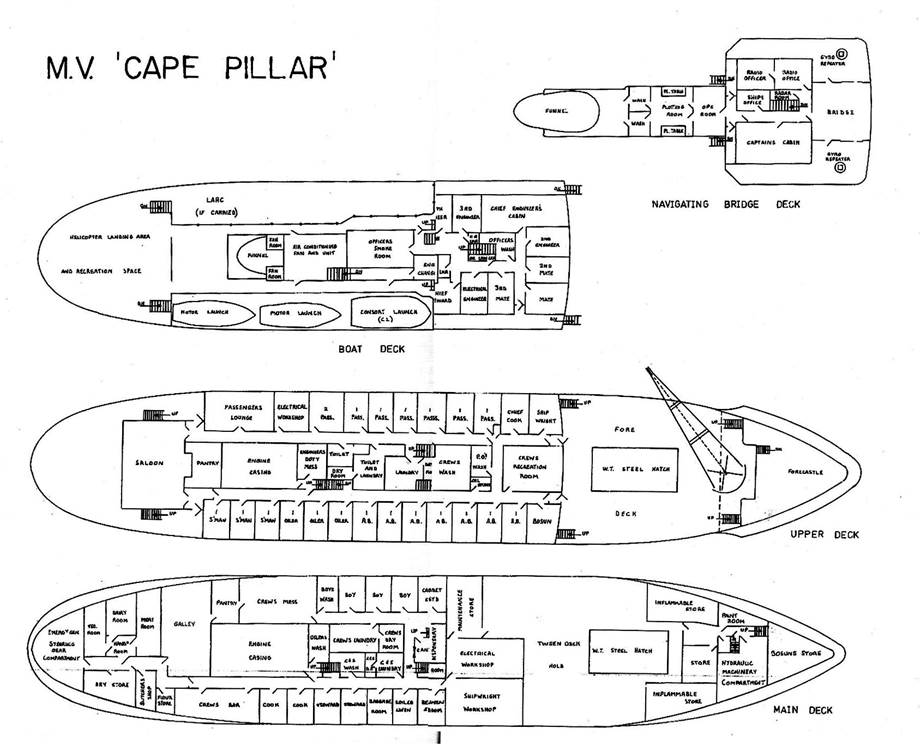
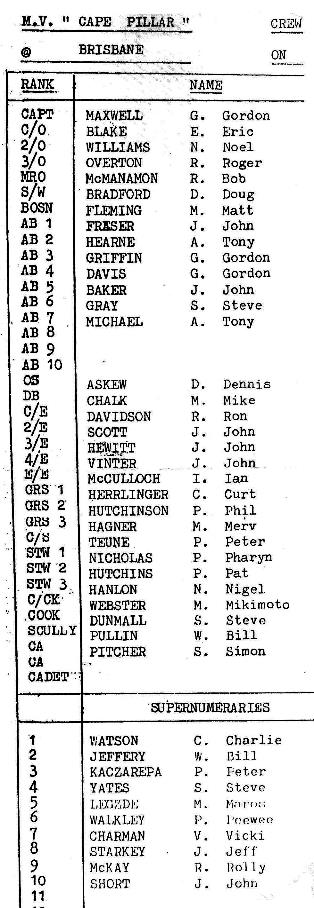
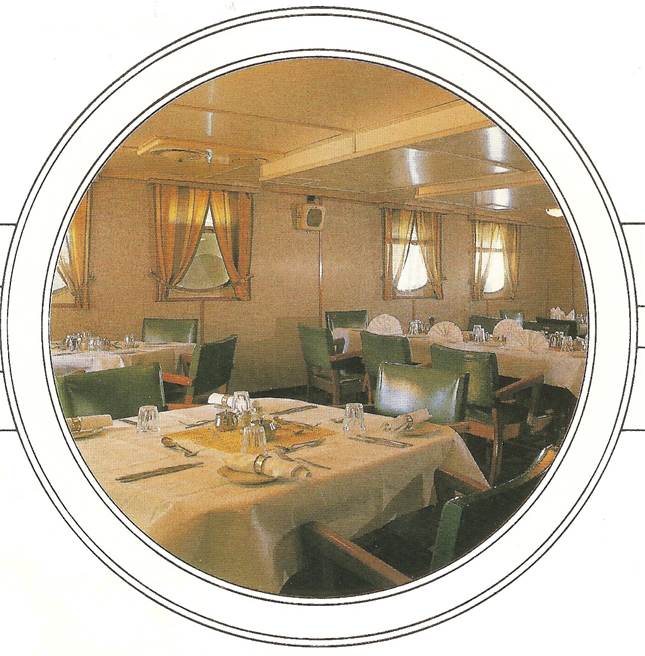
MV Cape Pillar – Including photos around the ship |
|
|
Brief for officers joining MV Cape Pillar |
|
|
Photos of Personnel |
|
DIVISION OF NATIONAL MAPPING |
||||||||
|
SUMMARY OF EXPENDITURE AND PROGRESS ON BATHYMETRIC PROGRAM |
||||||||
|
(IN JUNE 1970 DOLLARS) |
||||||||
|
Financial Year
|
FY Mean ABS-CP Index Base 100 At Dec 1980 |
FY Mean Base 100 at Jun 1970 |
Bathymetric Program Cost for FY |
Program Cost in 1970 Dollars |
Cumulative Bathymetric Program Cost |
Cumulative Bathymetric Program Cost 1970 $ |
Line Miles Surveyed in FY |
Cumulative Line Miles Surveyed |
|
1970-71 |
36.5 |
103.1 |
$20,400 |
$19,800 |
$20,400 |
$19,800 |
|
|
|
1971-72 |
39.0 |
110.2 |
$428,600 |
$388,900 |
$449,000 |
$408,700 |
8000 |
8000 |
|
1972-73 |
41.3 |
116.7 |
$444,300 |
$380,700 |
$893,300 |
$789,400 |
11600 |
19600 |
|
1973-74 |
46.7 |
131.9 |
$988,000 |
$749,100 |
$1,881,300 |
$1,538,500 |
20120 |
39720 |
|
1974-75 |
54.5 |
154.0 |
$1,161,000 |
$753,900 |
$3,042,300 |
$2,292,400 |
17305 |
57025 |
|
1975-76 |
61.5 |
173.7 |
$1,490,700 |
$858,200 |
$4,533,000 |
$3,150,600 |
25900 |
82925 |
|
1976-77 |
70.0 |
197.7 |
$1,200,000 |
$607,000 |
$5,733,000 |
$3,757,600 |
29030 |
111955 |
|
1977-78 |
76.7 |
216.7 |
$1,752,100 |
$808,500 |
$7,485,100 |
$4,566,100 |
26560 |
138515 |
|
1978-79 |
83.0 |
234.5 |
$1,301,800 |
$555,100 |
$8,786,900 |
$5,121,200 |
21780 |
160295 |
|
1979-80 |
91.4 |
258.2 |
$1,309,400 |
$507,100 |
$10,096,300 |
$5,628,300 |
11790 |
172085 |
|
1980-81 |
100.0 |
282.5 |
$2,730,300 |
$966,500 |
$12,826,600 |
$6,594,800 |
26970 |
199055 |
|
1981-82 |
110.4 |
311.9 |
$3,040,100 |
$974,700 |
$15,866,700 |
$7,569,500 |
21450 |
220505 |
|
1982-83 |
123.1 |
347.7 |
$2,870,800 |
$825,700 |
$18,737,500 |
$8,395,200 |
31608 |
252113 |
|
1983-84 |
131.6 |
371.8 |
$2,731,800 |
$734,700 |
$21,469,300 |
$9,129,900 |
26160 |
278273 |
|
1984-85 |
137.2 |
387.6 |
$3,033,900 |
$782,700 |
$24,503,200 |
$9,912,600 |
26824 |
305097 |
|
1985-86 |
148.7 |
420.1 |
$3,183,100 |
$757,700 |
$27,686,300 |
$10,670,300 |
29750 |
334847 |
|
1986-87 |
162.6 |
459.3 |
$3,582,800 |
$780,100 |
$31,269,100 |
$11,450,400 |
32534 |
367381 |
|
1987-88 |
174.5 |
493.8 |
$3,129,689 |
$633,800 |
$34,398,789 |
$12,084,200 |
27653 |
395034 |
|
1988-89 |
187.3 |
528.2 |
$3,027,559 |
$573,200 |
$37,426,348 |
$12,657,400 |
16462 |
411496 |
|
1989-90 |
202.3 |
572.5 |
$471,021 |
$82,300 |
$37,897,369 |
$12,739,700 |
1975 |
413471 |
|
BATHYMETRIC MAPPING ACTIVITY BY FINANCIAL YEAR |
|||
|
Financial Year |
Survey Vessel(s) |
Region(s) |
Nautical Miles of Soundings |
|
1971/72 |
MV Coralita & MV Murphy Star |
Southern Queensland |
8 000 |
|
1971/72 |
HV Ataluma |
New South Wales |
|
|
1972/73 |
MV Cape Pillar |
Timor Sea |
|
|
1972/73 |
MV Manly Cove |
Port Hedland |
11 600 |
|
1973/74 |
HV Ataluma then MV Bluff Creek |
Broome |
|
|
1973/74 |
MV Cape Pillar |
Timor Sea |
20 120 |
|
1974/75 |
MV Cape Pillar |
Ashmore Reef, Mellish Reef & NSW |
|
|
1974/75 |
MV Bluff Creek |
Cape Londonderry |
17 305 |
|
1975/76 |
MV Cape Pillar |
Gulf of Carpentaria |
|
|
1975/76 |
MV Cape Don |
Bunbury |
|
|
1975/76 |
DT Burrowaree |
Tasmania East Coast |
25 900 |
|
1976/77 |
MV Cape Pillar |
Gulf of Carpentaria & Timor Sea |
|
|
1976/77 |
MV Cape Don |
Bremer & Shark Bays |
|
|
1976/77 |
MV Lumen |
Torres Strait |
29 030 |
|
1977/78 |
MV Cape Pillar |
Timor Sea |
|
|
1977/78 |
MV Cape Don |
Bremer & Shark Bays |
|
|
1977/78 |
MV Candela |
Spencer Gulf |
26 560 |
|
1978/79 |
MV Cape Pillar |
Barrow Is. - Darwin |
|
|
1978/79 |
MV Cape Don |
Shark Bay |
21 780 |
|
1979/80 |
MV Cape Pillar |
Timor Sea then Heard and McDonald Islands |
|
|
1979/80 |
Various charters |
Great Barrier Reef |
11 790 |
|
1980/81 |
MV Cape Pillar |
North-west Shelf |
|
|
1980/81 |
MV Cape Pillar |
Coral Sea |
|
|
1980/81 |
Various charters |
Great Barrier Reef |
26 970 |
|
1981/82 |
MV Cape Pillar |
Arafura & Coral Seas, West coast of Tas & MacDonnell Is |
|
|
1981/82 |
TSMV Febrina |
Ingham – Townsville |
21 450 |
|
1982/83 |
MV Cape Pillar |
Tasmania & Great Australian Bight |
28 212 |
|
1982/83 |
TSMV Febrina |
Townsville |
3 450 |
|
1983/84 |
MV Cape Pillar |
Tasmania & Great Australian Bight |
22 239 |
|
1983/84 |
TSMV Febrina |
Townsville – Bowen |
3 921 |
|
1984/85 |
MV Cape Pillar |
Bass Strait |
25 141 |
|
1984/85 |
TSMV Febrina |
Townsville – Bowen |
1 683 |
|
1985/86 |
MV Cape Pillar |
Arafura Sea |
28 050 |
|
1985/86 |
TSMV Febrina |
Cairns – Bowen |
1 700 |
|
1986/87 |
MV Cape Pillar |
Gulf of Carpentaria, Joseph Bonaparte Bay &Middleton & Elisabeth Reefs |
29 473 |
|
1986/87 |
TSMV Febrina |
Great Barrier Reef |
3 070 |
|
1987/88 |
MV Cape Pillar |
Gulf of Carpentaria & Melville Is |
24 739 |
|
1987/88 |
TSMV Febrina |
Great Barrier Reef |
2 914 |
|
1988/89 |
MV Cape Pillar |
Gulf of Carpentaria & Coral Sea |
13 912 |
|
1988/89 |
TSMV Febrina |
Great Barrier Reef |
2 550 |
|
1989/90 |
TSMV Febrina |
Great Barrier Reef |
1 975 |
|
Bathymetric Surveying Program |
|
|
Sheets Surveyed |
238 |
|
Sheets part Surveyed |
17 |
|
Sheets not Surveyed |
24 |
|
Total Sheets in Series |
279 |
Photographs of typical satellite and Sonar Doppler Equipment
Further photographs of the equipment
|
|
|
|
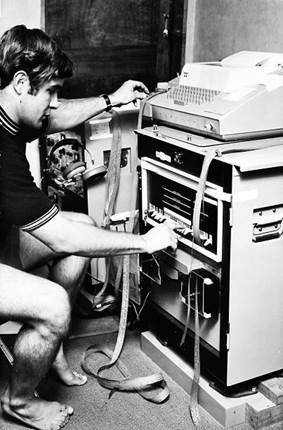
|
September 1971 aboard the Australian Maritime Services’ MV Coralita. Then contractor and later Natmapper John Sutton monitoring the RAYDIST positioning equipment. |
September 1971 aboard the Australian Maritime Services’ MV Coralita. Contractor Robert Crooks with the PDP 8L mini-computer. |
|
|
|
|
|
|
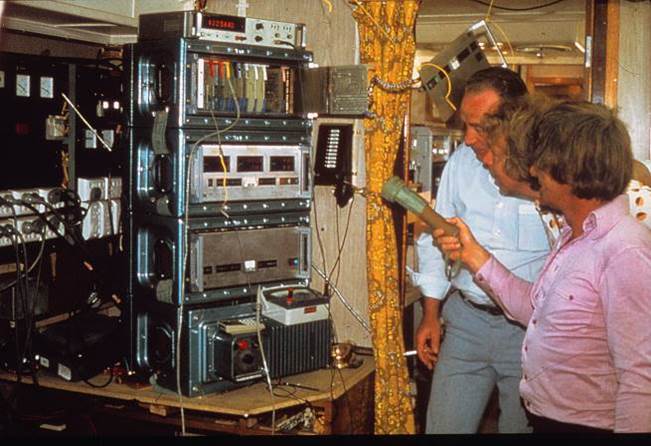
Undated aboard the Dept. of Shipping and Transport Navaids vessel, the MV Cape Pillar. Natmap’s Mick Skinner (holding torch) with probably the Decca Hi-Fix representative and Natmap’s Con Veenstra. |
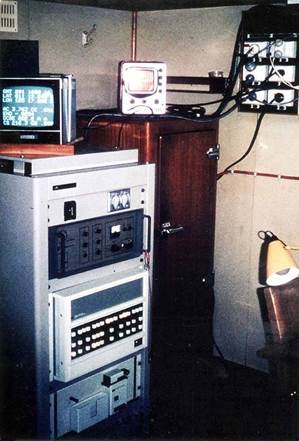
Undated aboard the Dept. of Shipping and Transport Navaids vessel, the MV Cape Pillar. Computer and positioning equipment. |
|
|
|
||
|
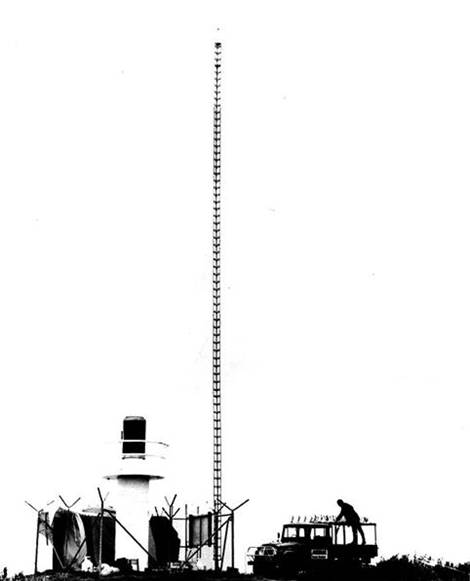
Hifix6 mast installation. |
||
|
|
||
|
|
||
|
|
||
|
|
||
|
|
||
|
|
||
|
|
|
|
|
|
|
|
|
|
||


