Application of Shoran to Australian Mapping
by G. R. L. Rimington, F. E. McCarthy and R. A. Robinson
Abstract
Shoran used to fix position of scintillometer flights, and control for planimetric maps, in uraniferous areas in the Northern Territory. Overseas use. Australian experiments. Reasons for using Shoran. Description of Shoran equipment. Method of fixing geographical.positions of Shoran beacons and mapping control points. Selection of control points. Plotting of scintillometer results. Analysis of results. Lecture given 29 July 1954, by G. R. L. Rimington, Chief Topographic Surveyor, National Mapping Office; F. E. McCarthy, Supervising Geophysicist, Bureau of Mineral Resources; and R. A. Robinson, National Mapping Office.
Introduction
The first Australian application of Shoran to control mapping was in the project at present nearing completion in the Rum Jungle area; of the Northern Territory. Accurate planimetric maps were required to serve as a base for prospectors' charts, at one mile to an inch, showing radio-active anomalies obtained from air-borne scintillometer surveys conducted by the Bureau of Mineral Resources.
Overseas use
Shoran along with other forms of radar has been used overseas to some extent in connection with triangulation and mapping. However, reports on the routine use of radar for mapping in other countries are very few, although extensive experimental work has been reported from England. In general, there are three instances where radar has been used in a routine mapping project overseas and in order of importance they are :
1. Establishment of a network of geodetic survey in Canada using Shoran.
2. Overwater triangulation by the United States using Shoran.
3. Extensive mapping at medium scales in Africa by means of Gee H. (British type of radar).
The Canadian network is very extensive and when completed, it is hoped this year, will give control points extending over most of Canada from latitude 50° N. to latitude 66° N. and from longitude 120° W. to longitude 70° W. The axial length of the chain of triangles will be 5,500 miles and will form a huge arc having considerable connections to five geodetic bases.
The overwater triangulation - or as it is often called, Trilateration - has been used in the United States to connect islands to the main geodetic chain. Generally, Shoran operations in the United States have been, as in Canada, confined to the establishment of basic control.
In Africa, British organizations have carried out a good deal of work establishing minor control for mapping operations at medium scale, but no comprehensive reports are available on the results obtained.
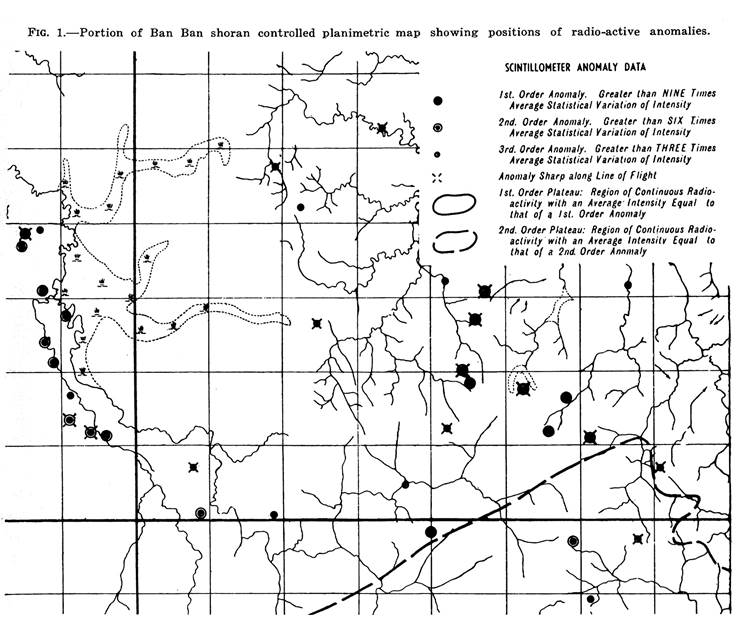
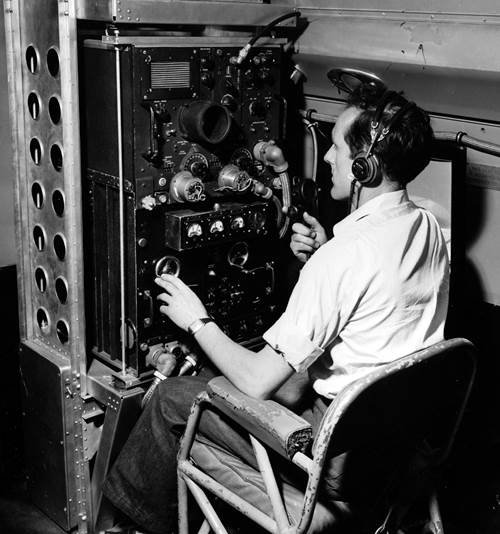
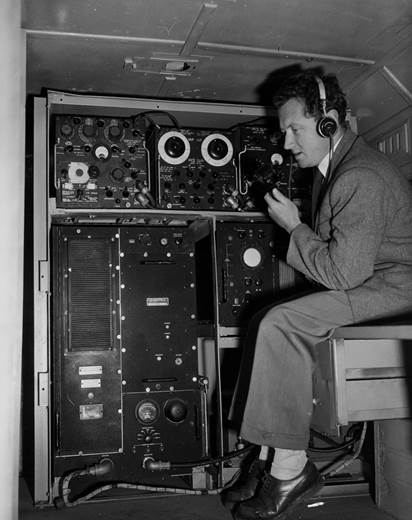
Figure 2 – Shoran receiver Figure 3 – Beacon equipment
Australian Experiments
The first experiments in the application of Shoran to mapping in Australia, arose from the formation of a Subcommittee of the National Mapping Council, whose task was to report on the possibility of using this means of accelerating the mapping programme.
This committee arranged with the Commonwealth Scientific and Industrial Research Organization, which was in possession of a number of units of equipment, to carry out tests.
In line with most other countries, the tests were devoted to the establishment of basic control. An ideal test area existed in N.S.W. where it was possible to measure all six lines of a quadrilateral, the position and lengths of which were fixed by existing triangulation, This quadrilateral was located with points at Condobolin, Tamworth, Sydney and Canberra, the lines varying in length from 158 to 311 miles.
Mr. J. Warner of the C.S.I.R.O. carried out the tests and reported them in the Australian Journal of Applied Science, Vol. I, No. 2, 1950. His conclusions are interesting and are quoted :
"This method of distance measurement using the line-crossing technique gave an average accuracy of roughly one part in 15,000 when measuring lines of 160 to 310 miles in length. The greatest source of error is the radar equipment that was used and is associated with signal strength. It is considered that by suitable modification to the equipment, in particular to the receivers, this signal intensity error could be reduced to within 10 feet. If this were done, it is likely that the overall accuracy of the technique would improve to about 1 part in 50,000.
"An improvement on this latter figure would be impossible without extensive improvements to the radar equipment. In addition, a thorough investigation of the problems of atmospheric refraction would be necessary."
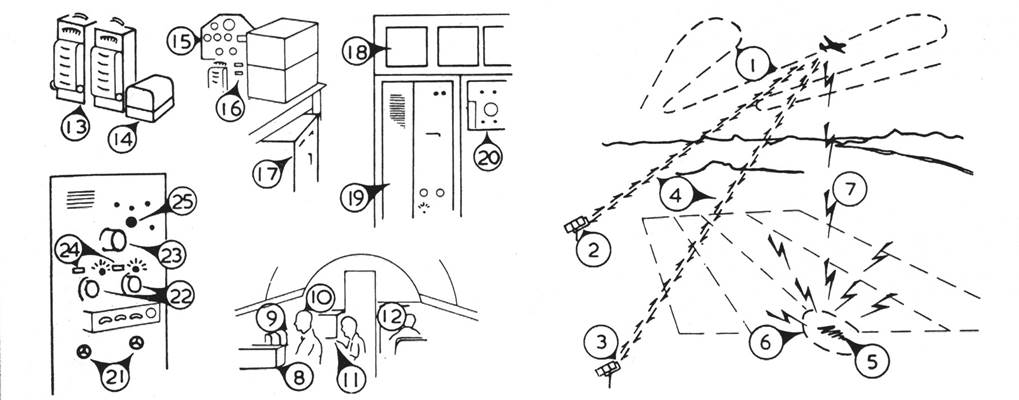
Figure 4. KEY DIAGRAM. 1. Shoran controlled parallel flight lines. 2. No. 1 Shoran beacon. 3. No. 2 Shoran beacon. 4. Shoran pulses. 5. Radio-active deposit. 6. Area covered by scintillometer. 7. Radiations. 8. Scintillometer instrument panel. 9. Instrument recorder. 10. Instrument panel. 11. Shoran transmitter. 12. Sharon receiver. 13. Instrument recorder. 14. Instrument camera. 15. Instrument panel. 16. Shoran distance indicators. 17. Shoran transmitter. 18. Communications equipment. 19. Beacon transmitter. 20. Beacon receiver monitor. 21. Handwheels. 22. Repeater motor dials. 23. Cathode-ray oscillograph. 24. Distance indicating dials. 25. Shoran receiver.
Whilst these tests were being carried out, a representative of the National Mapping Office acted as an observer, to try and gather some idea of the economics of the whole problem. The facts that he gathered in regard to the operation of the equipment were such that the Subcommittee on Radar could not recommend the method as an economic proposition.
It was felt by the Subcommittee that the demands on money and manpower required to use Shoran for mapping purposes would be beyond the very tiny resources of the existing National Mapping Office. Regretfully, the "seven league boots" of Shoran were placed in cold storage, and the classic methods of mapping control were continued.
This "cold storage" did not last very long (two years), as the discovery of uranium in Australia altered the economic aspects. It was not so much the discovery of uranium that so largely altered the position, but rather the development of the airborne scintillometer. This instrument revolutionized the search for uranium, and also brought with it extensive demands for accurate mapping and its associated control.
Use of Shoran Equipment
Search for Uranium
One of the functions of the Bureau of Mineral Resources is to conduct airborne surveys in the search for uranifrous deposits. These surveys are carried out using a D.C.3 type aircraft in which the detecting equipment is housed along with navigation and auxiliary equipment.
The navigation aids include a set of Shoran equipment and a radio altimeter along with the standard navigation instruments such as compasses, radio compass, barometric altimeter, etc.
The equipment used to detect radioactivity from the ground flown over is the scintillometer. This is a recent development and is much more sensitive than any arrangement of Geiger-tubes which may be used. Nevertheless, the scintillometer has limitations when used in an aircraft. The most serious of these is the inability to detect gamma radiations from a "point" source deposit of radioactive ore when the distance, in air, between the scintillometer and the source is more than 800 feet. Because of this limitation the aircraft carrying the scintillometer is flown at height no greater than 500 feet above the ground; and to obtain adequate coverage of an area suspected of containing radioactive minerals, the aircraft is flown along parallel flight lines one-fifth of a mile apart. (Figure 4.)
Navigation
It is not possible to navigate an aircraft flying 500 feet over wooded country along parallel flight lines of such close spacing by normal means of navigation. Consequently, some radio or radar means of navigation is required. The various types of radio navigation aids were investigated, and it was decided to use Shoran. The reasons for this choice were:
(i) that the Shoran equipment was readily available on loan from C.S.I.R.O.;
(ii) that the ground beacon units were more portable and required less power than beacon for any other system;
(iii) that the system would give the desired degree of accuracy for positioning of the aircraft.
It was realized that the Shoran equipment operated on wavelengths which would restrict the range of the system to line of sight operations, but the advantage of using Shoran outweighed those of any of the long wave length systems such as Raydist and Decca.
Shoran Mapping Control
The purpose of using the Shoran equipment on these surveys is twofold. Firstly, to enable the pilot to fly the aircraft accurately along pre-selected flight lines, and secondly that the aircraft position must be known at all times so that any areas showing abnormal radioactivity could be plotted on a map to enable follow-up ground parties to locate and investigate the areas. As there were virtually no accurate maps of the Northern Territory in which to plot these recorded anomalous areas, the National Mapping Office was approached to prepare maps.
This Office was willing to undertake map production provided that the Bureau of Mineral Resources supplied the control. The existing meagre control in the Northern Territory consisted of a single line of triangulation running approximately south from Darwin. This was insufficient to control maps over the areas to be flown by the aircraft, so the Bureau undertook to provide Shoran controlled aerial photographs for the purpose of laying down maps.
By basing the control runs on the same Shoran beacons as controlled the scintillometer runs, close relationship between the anomalies and the planimetric detail would be assured.
The area required was already covered by photography for mapping purposes, so it was not necessary to use the British system of fixing each exposure by radar. Instead, a Williamson F24 vertical camera was installed in the aircraft and control runs of overlapping F24 photos were flown. These runs were flown round the perimeter of each one mile area and north and south across the centre.
It was then a simple matter to transfer the principal points of these photos on to the plotting photographs to obtain control points.
When an area has been selected for airborne survey, a reconnaissance party is sent into the area to select accessible high points on which the Shoran ground beacons can be located. The mobile units carrying beacon equipment are moved on to the selected sites. Because of the limitation of line of sight operation of the Shoran equipment, the sites for the beacons are selected on the highest accessible points.
The bulk of the ground beacon equipment also limits the possibilities, as the sites must be accessible to the van carrying the equipment.
In this project, these two factors far outweighed other considerations. It was impossible to select the beacon sites so that good intersections could be obtained over the whole area.
Description of fixing the geographic positions of the beacons is given later.
After the positions of the beacons had been determined flight lines were laid down for the scintillometer survey and flight lines for the Shoran controlled aerial photographs for map control purposes were selected. It may be pointed out that in many cases the flight lines for map control were not always such as to give the best results, but the expediencies of the survey necessitated that the control flight lines were flown when possible and from existing beacon set-ups.
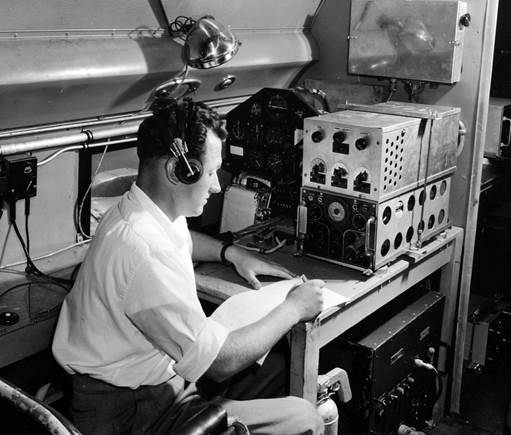
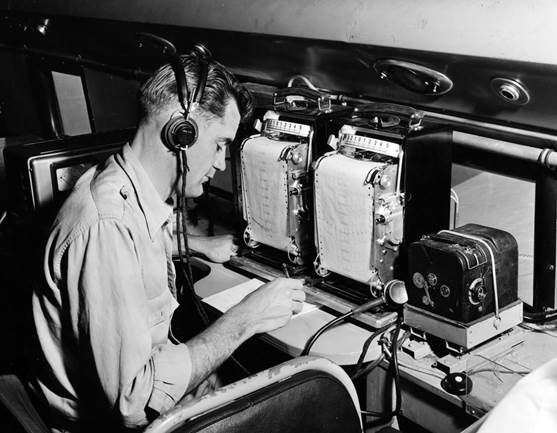
Figure 5 – Instrument panel Figure 6 – Instrument camera
Usually about five control lines were flown over each one mile area, three in a north-south direction and two in an east-west direction. The control flights were undertaken from an altitude of 5,000 feet, and during these flights an F24 type aerial camera was triggered to take photographs at 10 second intervals. The instrument camera (14 on diagram) in the aircraft was triggered simultaneously with the F24 camera and it photographed a panel of instruments (15 on diagram) in the aircraft including the Shoran distance indicators (16 on diagram). By this means the distance of the principal point of each F24 photograph from each beacon was ascertained.
The Shoran distance indicators read directly in miles to the nearest one-hundredth of a mile. These indicators are operated by electric servo-mechanisms remote from the Shoran equipment.
The Shoran Equipment
Radar Responder System
The Shoran system is essentially a radar responder system. A transmitter (17 on diagram) carried in the aircraft transmits pulses of short duration. These pulses are received at the ground beacon, are amplified, delayed for a predetermined short time, and made to trigger the beacon transmitter (19 on diagram). These re-transmitted pulses are picked up on the Shoran receiver in the aircraft. The time taken for the round trip of these pulses travelling at the speed of light is a measure of the distance of the airborne unit from the beacon. The measured time is converted automatically into a distance in the airborne unit, and shows the distance of the aircraft from one beacon.
A single transmitter in the aircraft transmits pulses on two frequencies, namely, 230 and 250 mc/s. There is a switching mechanism in the airborne unit which switches the tuning on the transmitter so that it sends out a series of pulses on one of these frequencies for each alternate one-tenth of a second period, and then on the other frequency for the intervening periods of one-tenth of a second. The transmitter is pulsed at a repetition rate of 931 095 pulses per second (an important figure) and the duration of each pulse is 0 000002 seconds. That is, for alternate periods of one-tenth of a second, approximately 93 pulses are transmitted on a frequency of 230 mc/s and are picked up by the receiver at beacon No. 1 which is tuned to receive them. On the each intervening period of one-tenth of a second duration, approximately 93 pulses are transmitted on a frequency of 250 mc/s and are picked up by the receiver at beacon No. 2, which is tuned to frequency of 250 mc/s. Both beacons re-transmit the pulses on a frequency of 300 mc/s, to which frequency the receiver in the aircraft is tuned. The pulses received by the aircraft receiver are amplified and made to appear as deflections on a cathode-ray oscillograph (23 on diagram). This cathode-ray oscillograph has a circular time base which is triggered at the same rate as the transmitter. That is, during the interval between outgoing pulses from the transmitter, the luminescent spot on the face of the cathode-ray oscillograph traces out a complete circle of about two and one-half inches diameter. A reference pulse appears as a small outward deflection on the top centre (12 o'clock position) of the time base, and the pulses received from the beacons appear as deflections outward from the centre and inwards towards the centre of the circle. When the aircraft transmitter is transmitting on 230 mc/s the output of the receiver is switched, by the same switching mechanism as mentioned above, so that it is coupled to the cathode-ray oscillograph such that the output of the receiver will deflect the cathode beam away from the centre of the tube, consequently the responder pulses from the beacon No. 1 will appear as short duration "pips" on the outside of the circle. And in the same way, during the next succeeding one-tenth of a second period, the output of the receiver is switched so that the pulses coming from beacon No. 2 will appear as "pips" on the inside of the circular time base.
If the marker "pip" at the top of the circle appears at the same instant as the transmitter pulse is sent out, then a measure of the distance (or time) around the circle to the responder "pips" would be a measure of the distance of the aircraft from the beacons. As it is not possible to measure such distances accurately, much more elaborate arrangements for measuring these distances (or times) are incorporated in the equipment.
Quartz Crystal Oscillator
The accuracy of the Shoran equipment depends upon the ability of the system to measure small intervals of time very precisely. If the distance from the aircraft to the beacon increases by the smallest measurable distance, 0.01 miles, the travel path of the transmitter pulses increases by double this amount, 0.02 miles. The time taken for a radio wave travelling at a speed of 186,219 miles per second, to traverse 0.02 miles is 0.000,000,107 seconds, consequently the Shoran equipment must be capable of measuring time correct to this small interval.
The heart of the airborne measuring equipment is the time measuring device, or the quartz crystal oscillator. This operates on a frequency of 93,109.5 cycles per second, and generates a sinusoidal voltage. This alternating voltage is divided electronically in two stages to frequencies of 9,310.95 and 931.095 cycles per second respectively. After amplification, the sinusoidal voltage of the latter frequency is squared and made to produce one electrical pulse of two microseconds duration per cycle.
This pulse is fed on to the cathode-ray oscillograph and forms the marker or reference pulse.
Goniometer
A portion of the 931.095 c/s sine wave voltage is passed through the goniometer where the phase of the alternating voltage can be changed, continuously and accurately. This voltage is passed then on to a pulse forming network and a pulse is produced at exactly the same part of the cycle as the reference or marker pulse on the un-phased alternating voltage curve. This pulse is amplified and used to trigger the transmitter. By rotating the goniometers (changing the phase of the alternating voltage) the time separation between the transmitted pulse and the reference or marker pulse can be altered by very minute amounts. Sixteen revolutions of the goniometer shaft changes this interval by a time of 0 000,010,7 seconds, the time interval equivalent to a range of one mile.
The Shoran operator has a means of rotating the shaft of the goniometer and in doing so alters the interval of time between the transmitted and marker pulses so that this interval is exactly the same as the time required for the round trip of the transmitted pulse to the beacon, and back. If the transmitted pulse precedes the marker pulse, then the incoming signal or pulse will arrive at the same instant as the reference pulse is produced, and both pulses will appear on the same position on the cathode-ray oscillograph. The function of the Shoran operator is to turn the goniometer so as to keep the received pulses and the marker pulses aligned on the cathode-ray oscillograph. There are two goniometers in the unit, one for ranging to each beacon. The shafts of the goniometer are geared mechanically to the distance indicating dials (24 on diagram) which show the range of each beacon to the nearest 0.01 miles.
The frequency of the crystal oscillator, therefore, is controlled to within narrow limits.
It was stated above that the luminous spot on the cathode-ray oscillograph traced out a circle in the interval between transmitted pulses. This is true when the range switch is in the "100 mile" position, i.e. when the distance around the time base represents a distance of 100 miles. When the range switch is in the positions "10 mile" and "1 mile", the distances represented around the circle on the cathode-ray oscillograph are 10 miles and 1 mile respectively. The 100 mile and the 10 mile ranges are used only to enable the operator to align the pulses when first setting up. The procedure for the operator is to have the range switch initially in the 100 mile position and align the received pulses, then change to the more accurate 10 mile range and align the pulses again and finally to switch to the most accurate one mile range, and keep the pulses "tracking". The assumption is made that the distance of the aircraft from each beacon is known, from other sources, to the nearest 100 miles.
Aided Layer Equipment
It would be arduous work for the operator to turn the goniometers continuously to keep "tracking" the aircraft as the distances of the aircraft from the beacons are changing continuously. For example, for an aircraft travelling at a speed of 180 miles per hour directly away from a beacon, the range from the beacon is increasing at the rate of 3 miles per minute. The goniometer "tracking" this beacon would need to be rotated at a speed of 48 revolutions per minute. To lighten the work of the operator an "aided layer" unit has been added. There are two handwheels (21 on diagram) on the front of the aided layer which are coupled through a differential gear train by an electromechanical system to the shafts of the goniometers, and the operator can keep the pulses aligned on the cathode-ray oscillograph with only small movements of the handwheels.
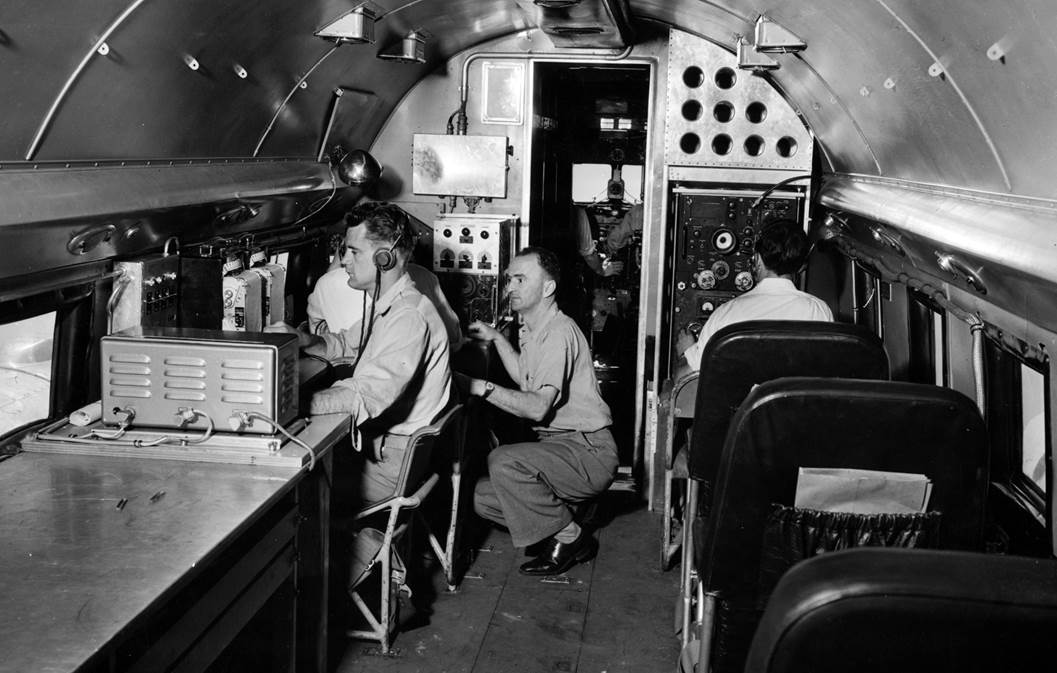
Figure 7 – Aircraft interior
Limitations and Source of Error
There are limitations to the accuracy of the Shoran, some of which may be solved in time. The more important of these are listed below:
(1) The use of the equipment is restricted to line of sight operations.
(2) The accuracy is dependent to some extent on the size of the received pulses at the beacon and aircraft receivers. It is not possible with the present equipment to incorporate automatic gain control in the receivers so that pulses out of the receivers are all of the same magnitude, irrespective of strength of the received signals. This comment applies particularly to the airborne receiver.
(3) The speed of transmission of radio waves has been taken as constant. It is known that this varies with atmospheric conditions. If the result achieved warranted it, a check could be made of the atmospheric conditions, and small corrections applied to the measured distances.
(4) Errors in measured distances can be caused by operator fatigue. Errors from these sources are thought to be small. Changing of operators at short regular intervals overcomes this to a great extent.
It is intended that the above will give the broad outline of the operation of the Shoran equipment. No attempt has been made to include small but important features or refinements incorporated in the equipment. For further details consult reference 1 at end of this article.
Mapping from Shoran Controlled Photographs
Beacon Site Fix
Each beacon site position was computed from a series of Shoran distances obtained from triangulation stations as illustrated in Figure 8. Ground survey parties from the National Mapping Office re-observed those parts of the old network which were required and established two further stations to fix these beacons sites' geographical positions.
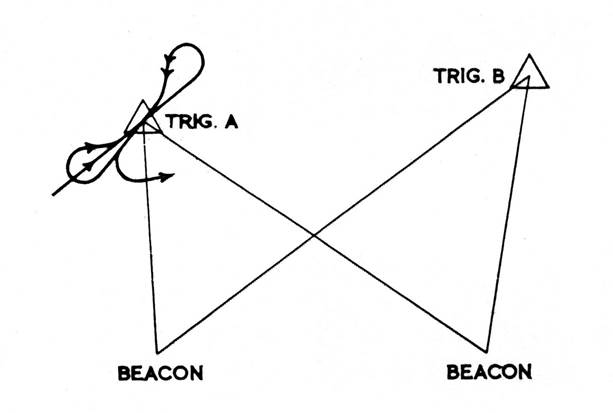
Figure 8 – Beacon fix
The aircraft flew a pattern over trig. A, taking vertical F24 photographs synchronized with the instrument panel camera. The distances to the principal point of each photograph were measured from both beacons. The triangulation stations were marked on the ground and could be identified on the photograph so that this Shoran distance could be adjusted for the distance from the triangulation point to the principal point of the photograph.
On each such flight, several (average four) triangulation points were covered from the same pair of beacons to provide a series of triangles with known sides and two positions known. From these the beacon positions could be computed. The flying pattern over each triangulation point was such that tilt and drift errors were minimized.
Office Computations
The information obtained from the B.M.R. field operations was collated and handed over to the N.M.O. for application. Briefly, this consisted of:
(1) The F24 photographs and their Shoran co-ordinates for obtaining the position of the beacon sites.
(2) The overlapping F24 photographs for each control run.
(3) The instrument camera films containing the data for each F24 photograph.
(4) A series of log sheets on which the instrument panel data had been tabulated and correlated to the F24 photographs.
The initial requirement was a set of co-ordinates for each beacon so that the control points based on them could be computed.
For each beacon there was a series of distances to various points, these points being the principal points of vertical photographs taken over triangulation stations of known position. Each Shoran distance was adjusted to allow for the distance from the principal point of the F24 photograph to the triangulation point. All references to Shoran distances apply to the figures obtained after the height and curvature correction has been applied.
To obtain approximate positions for the beacons and thus subsequently for each individual control point, an accurate one inch to a mile grid was constructed, and all triangulation points in the area were plotted. Trial co-ordinates for each Shoran beacon were then scaled from the intersection of the arcs of the known Shoran distances.
From these co-ordinates, bearings to each triangulation station were computed, thus providing a computed bearing and a Shoran distance from each triangulation station to the beacon position being computed. A series of positions were computed from these bearings and distances, the co-ordinates of the beacon being obtained graphically from position lines through these computed points. This position is a close approximation and further computing refinements could be used if necessary.
Examination of the results shows appreciable residual errors. Of all the eleven beacons fixed in this manner, the position line which was farthest from the final adopted value for that beacon was 85 yards away. There were two of more than 70 yards, one of 60, two of 50, and so on down the scale, the best of the worst rays being only nine yards from the adopted position. A mean of the residual errors in the rays to each beacon varied between a maximum of 51 yards and a minimum of six yards.
Errors of this magnitude for the control points for this type of mapping are tolerable, but for the beacon sites on which all the other controls are based, greater accuracy should be demanded.
Cross-over Checks
This term has been applied to the check made between the positions obtained from each run, where two or more control runs intersect. As no previous evidence was available as to the reliability of Shoran control applied in this manner, it was considered prudent to carry out these checks. The results proved them to be necessary.
Their main purpose was to check between the Shoran co-ordinates of intersecting runs, making a comparison between Shoran positions, and the ground positions respectively, of the principal points of several photographs from each run. Also, when the control runs were flown, some mechanical difficulties were encountered in the intervalometers of the F24 and instrument cameras. This meant that although the cameras were synchronized, occasional difficulty was experienced in equating these two on the instrument panel. This relationship or equivalence could be established from the cross-over checks.
Three F24 photographs were selected from each run at the intersection, and the principal points transferred on to the K17 plotting photographs. The relative ground positions of these principal points were then determined by a photoscale radial line plot.
The relative Shoran controlled positions of these same points were then determined from a graphical position line plot, using trial point co-ordinates scaled from the one inch to a mile grid mentioned above.
The Shoran positions (open circles in Figure 9) were plotted at a scale of 1:31,680; and the radial line plot (positions shown as filled in circles) was at a scale of approximately 1:30,300. These two plots were superimposed, the relative positions shown as in Figure 9. Any errors in equivalence were immediately apparent. In Figure 9 those numbers in brackets show the positions obtained from the log sheets. The equivalence was corrected and the true position plotted as shown. Closer comparison was then made to detect any small irregularities between the intersecting runs.
In every case there were small differences in both azimuth and position. These differences were meaned out and an arbitrary position was adopted for that photograph which was to be used as a control point. From the Shoran plot the small adjustments to be made to the bearing and distance from each beacon were then scaled off.
Two sets of rectangular co-ordinates for the control point could now be obtained from the bearing and distances from each beacon controlling it. These two positions were plotted on a grid (usually at a scale of one inch equals ten yards) and a graphical solution obtained from position line arcs through them. The intersection of the position lines was adopted, and the rectangular co-ordinates of the control points scaled directly from the grid.
Selection of Control Points
Immediately after receipt from the B.M.R., all the F24 photographs in the control runs were charted on to composite one mile to an inch mosaics of the area. These mosaics had previously been compiled from those K17 photographs which were being used in the snap compilation.
From these mosaics, a very clear appreciation of the position was possible. Owing to the priorities placed on specific maps in the project, it was necessary to complete the areas singly and in a specified sequence. Great care had to be taken, therefore, in the selection of control so that the detail would match along the edge of adjoining maps. Usually in projects of this nature, several areas are assembled at once, but the order of priorities precluded such a scheme in this instance. The only alternative, therefore, was a high density of control, selected so that cantilevering of the slotted template assembly beyond this control was kept to an absolute minimum.
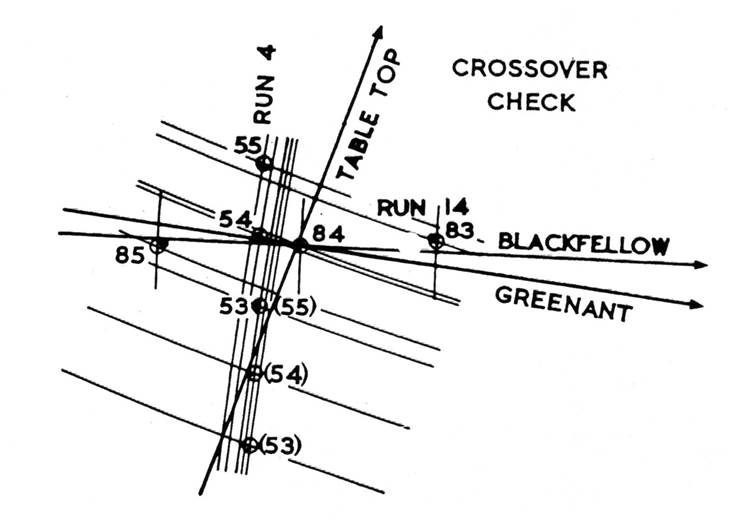
Figure 9 – Cross-over checks
The first consideration, then, in selecting the individual F24 photographs to be used in control was that they should be outside the edge of the area being assembled. Where the control runs were not suitably situated to satisfy this condition, it was generally possible to control that edge by adopting a row of photo-points from a previous assembly. The next consideration was the condition of the template slots through the control. A well-conditioned six-ray intersection was to be aimed at in each case, and the F24 photograph most closely fulfilling this condition was adopted.
Initially, to provide a severe test on the accuracy of the control 20 points were used for each one mile area. These were evenly spaced around the perimeter control runs and along the centre key.
Those F24 photographs to be used for control could be selected directly from the composite mosaics, where all requirements could be considered.
No control point was computed until the equivalence for that section of the control run had been established by cross-over checks.
The computation for a control point is a simpler version of the cross-over check. In this case only the control photograph and the adjoining F24 photographs on either side are involved. The principal points of these three F24 photographs are transferred to the K17 photographs and radially plotted as before, at photo scale, to obtain the relative ground position. The relative Shoran positions are computed and plotted as before, using the Shoran coordinates of the control photograph to scale off a trial point. These Shoran positions were plotted at 1:31,680.
When the Shoran plots and the radial plots were compared, slight discrepancies were apparent each time. Arbitrary adjustments to the bearing and distances were made as in the cross-over check, and a graphical solution obtained.
Compilation of Maps
The control required for each map was completed in accordance with the priority order, each slotted template assembly being plotted as the control became available.
The maps were drawn from slotted template assemblies by the N.M.O. using the normal compilation procedure. Owing to the discrepancies between the template assembly and the computed positions of the control points, each area had to be considered individually, and those control points considered least likely to be correct were discarded.
The planimetric maps at one mile to an inch were drawn to standard military specifications, and astrafoil copies handed to the B.M.R. for the addition of their information.
Plotting of Scintillometer Results
Concurrently with the completion of the base maps by the N.M.O., the Bureau of Mineral Resources had been plotting the radioactive anomalies. To facilitate the plotting of this information, a series of Shoran lattices or grids was constructed.
A lattice was constructed for each one mile area, and for each pair of beacons controlling the airborne scintillometer survey of that area. Each lattice consisted of a network of concentric arcs centred on each beacon and spaced at intervals of one-fifth of a mile.
Each flight line on the scintillometer survey was plotted on the lattice directly from the corrected Shoran co-ordinates for each exposure of the instrument camera. Reference to the scintillometer graph then enabled the radioactive anomalies to be plotted along these flight lines.
The lattices were drawn at a scale of one mile to an inch, and the radioactive anomalies could be transferred directly to the base map with the correct relation to the planimetric detail retained.
Names of the features and marginal notes were then added, and the map prepared for publication in two colours. The topographic base was printed as a ghosted grey background, with the radioactive anomalies overprinted in black.
Analysis of Results
When the cross-over checks were plotted, varying differences between the Shoran coordinates of each run were revealed. The maximum difference in position between two intersecting runs was approximately 250 yards, and the greatest difference in azimuth over the sections plotted was about 6 degrees. However, these were exceptional cases, and the average difference was approximately 70 yards, and less than one degree in azimuth.
These discrepancies indicate that there are definite limitations to the use of Shoran in this manner, but with several refinements in procedure much better results can be expected.
A total of 142 control points was computed and tested by slotted template assemblies. In the early assemblies, where twenty points were used per one mile area, up to 50 per cent of the points had to be discarded. However, when the density of control was relaxed to 13 points per area, the percentage of discards was considerably reduced without any loss in the rigidity of the template assembly. In one assembly only one of the control points had to be discarded.
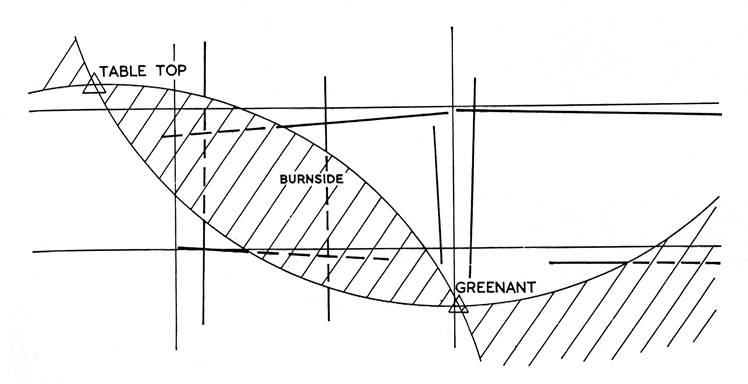
Figure 10 – Diagram showing “lens” of critical angle intersection
The greatest factor limiting the accuracy of the control on this project was the siting of the beacon positions. The two main factors influencing their choice have already been mentioned, namely, line of sight scintillometer requirements and bulk of beacon equipment. A large percentage of the control runs were of doubtful value as the rays from the Shoran beacons controlling them cut at too small an angle to give an accurate intersection. For accurate results, the angle of intersection should be between 30 and 150 degrees. As can readily be seen from Figure 10, only those sections of the control runs inside the circles, but not within the "lens" between the circles, will satisfy this condition. In more accessible country the beacon sites could be selected to control the area being mapped, so as to satisfy the above condition with a consequent improvement in accuracy. If necessary, additional beacon sites could be used if those for the control s are not suitable for the scintillometer flights. The additional effort required would be more than offset by the improved accuracy.
The reliability of computing the position of the Shoran beacons from Shoran distances is also open to doubt. The results obtained showed appreciable residual errors in the rays from the triangulation stations fixing the beacons. Errors of 30 or 40 yards in the position of a control point can be tolerated in this type of country, but the beacon sites should be fixed much more accurately than this, as all other control points depend on these values. Until such time as the reliability of the method has been proved, and also to test the method, the beacon sites should be fixed by ground survey methods.
In common with all aerial photography, the effect of tilt was an important factor. At the flying height for the control runs, 5,000 feet, a tilt of three degrees displaces the principal point approximately 90 yards from the plumb point. An error of this magnitude is excessive, and can be eliminated only by perfect flying in ideal conditions. No obviously tilted photograph should be used as control.
A comparison between the overlaps of the F24 photographs and the Shoran intervals between successive exposures revealed small irregularities which materially affect the accuracy of control. These irregularities could be due to tilt or to the failure of the Shoran operator to keep the "pips" in coincidence. The task of the Shoran operator is far from easy, and even with frequent changes it becomes very fatiguing. A repeater Shoran tube on the instrument panel would provide a check on the operator, and any photographs where the "pips" were separated could be instantly discarded. However, several technical problems at present make this impracticable, and places all the responsibility on the operator to maintain full efficiency.
General Summary
At this stage it is impossible to state definitely the value of Shoran for map control when applied in this way. In the project under review, too many of the deciding factors are of doubtful quality.
The direction of error in the great majority of discarded points was such that the source could be in the values computed for the beacons or the poor intersections of the rays fixing the point. Better results were obtained than could be expected with a comparable density of astronomical fixes, and of course the cost in time, manpower and money of regular ground survey methods of higher accuracy would be prohibitive, in this type of country and for such a project as this.
References
"Operating and maintenance instructions for radio set AN-APN3" No. CO-AN-08-30 OAPN3-2-M. U.S. Airforce publication.
Consult bibliography on page 173, "Photogrammetric Engineering", Vol. 19, No. 1, March 1953.