Photomaps - National Mapping’s First “Maps”
Compiled by Paul Wise, August 2019.
Introduction
In the late 1940s, with national development high on the government’s post war agenda the lack of mapping of inland Australia demanded a quick solution. The wartime mapping, which had solved the immediate defence problem, was now unsuitable or irrelevant. The Royal Australian Air Force had acquired and continued to acquire 1: 50 000 scale aerial photography coverage of large regions of Australia but converting this information into traditional coloured line maps would have taken too long. Photomaps were the solution as these interim map products were a very useful assessment tool in the hands of investigators in engineering, mining, earth sciences, town and country planning, agriculture, forestry and not least some social sciences.
Royal Australian Air Force Aerial photography
The 1: 50 000 scale aerial photography acquired by the Royal Australian Air Force, consisted of 15 east-west flight lines or runs and two north-south or key runs. The aerial camera used was generally the Fairchild K 17, having a frame format of 23 x 23 centimetres (9 x 9 inches) and nominal 150 millimetre (6 inch) focal length lens. The areal extent was a 1: 253 440 scale map sheet of 1.5 degrees of longitude by 1 degree of latitude with the key runs at the nominal east and west extents of the map sheet. Sometimes a north-south central key was acquired which more often than not was actually flown along the full degree meridian within the map sheet. Along each run the aerial photographs generally had a forward overlap of 60% and 25% sidelap. The 60% overlap was used when plotting detail from the photographs in a photogrammetric plotter. By laying out every second photograph there was sufficient overlap to cover the area without gaps. For a 1: 253 440 scale map sheet area some 600 photographs were needed for photogrammetric plotting while only 300 were needed for areal coverage.
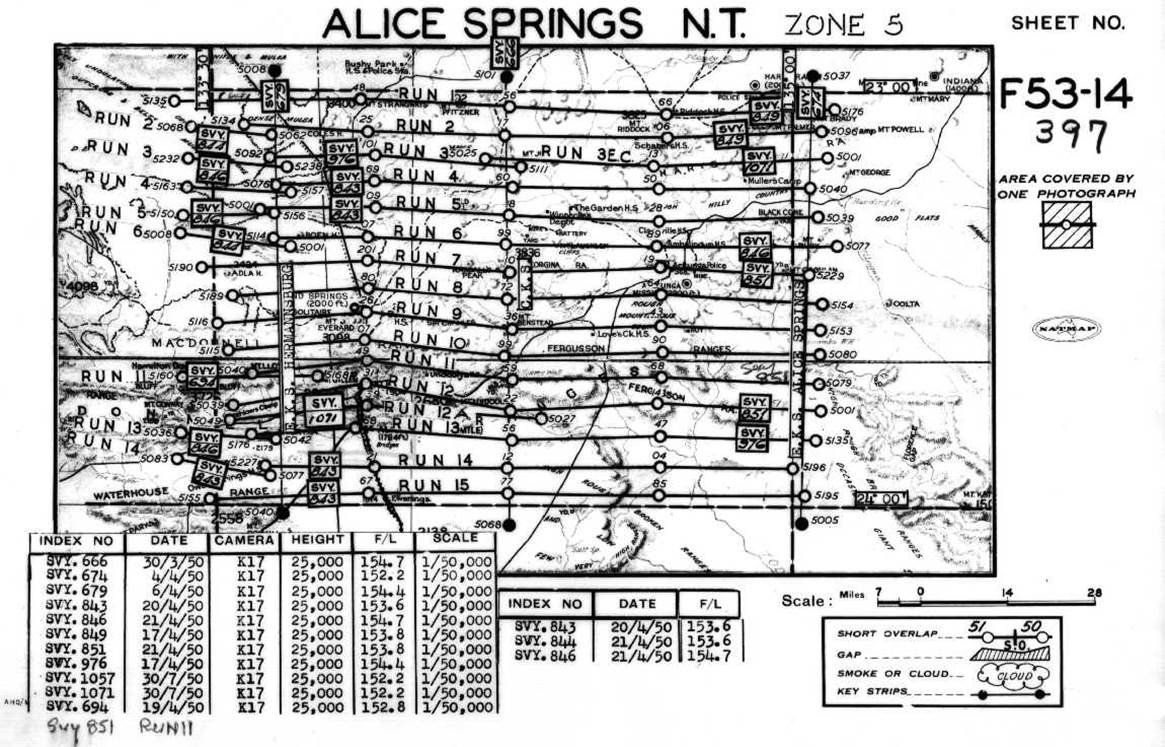
Flight line diagram for 1: 50 000 scale aerial photography acquired over the 1: 253 440 scale map sheet of SF53-14 Alice Springs in 1950.
At the completion of acquiring the aerial photographs for a 1: 253 440 scale map sheet a flight line diagram was prepared. On the best map base available was plotted the aircraft’s flight paths, the centre of selected photographs in relation to ground features, and film reference numbers. An example is shown above. The flight line diagram was the basis on which the required prints from the relevant aerial photography negatives could be ordered.
Arrangements of aerial photographs laid out to view a portion of the earth's surface were sometimes known by different names. As a member of the National Mapping Council, National Mapping conformed to the Council’s definitions of such assemblies. In turn these definitions were largely based on international conventions whereby :
|
1 |
a mosaic was an arrangement of overlapping aerial photographs whose edges were matched to form a continuous pictorial representation of a portion of the earth's surface; also called a shingle mosaic, scale and orientation were undefined other than that set by the photographs themselves.
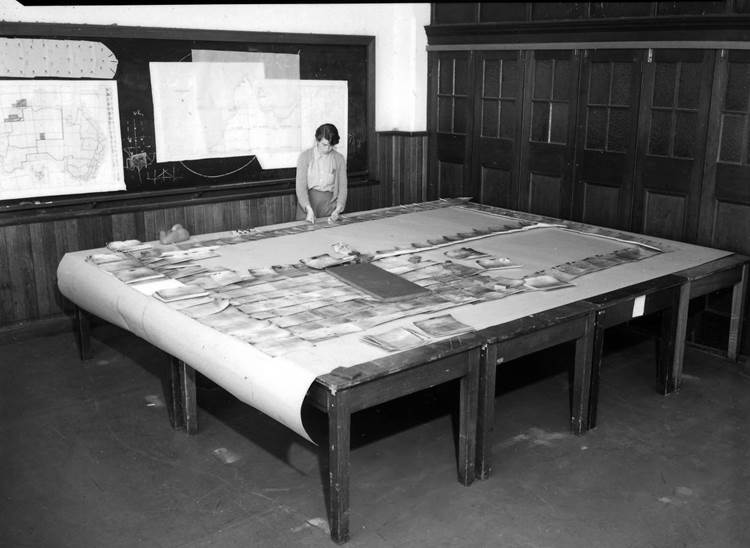
Preparing a shingle mosaic from aerial photographs at Gregory Hall.
|
|
2 |
an uncontrolled mosaic was an arrangement of overlapping aerial photographs, the detail of which had been matched from print to print without ground control or other orientation; this arrangement could be fixed to a base material and the assembly photographed to provide a now easily manageable photomap. The photomap may or may not have had annotation. Also sometimes called a Photo Index if details about the aerial photography was included. |
|
3 |
a semicontrolled mosaic was an arrangement of overlapping aerial photographs (#), the detail of which had been matched from print to print, laid to a common basis of orientation and scale without independent ground control; this arrangement could be fixed to a base material and the assembly photographed to provide a now easily manageable photomap from which approximate distances and directions could be obtained. The photomap was usually annotated and had a legend.
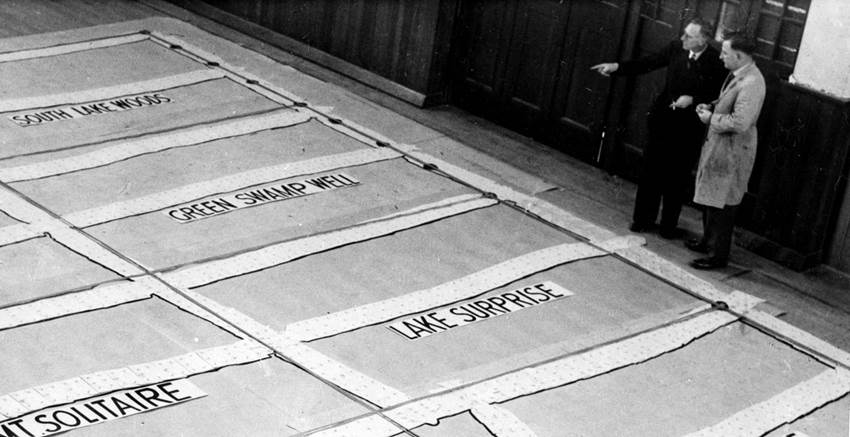
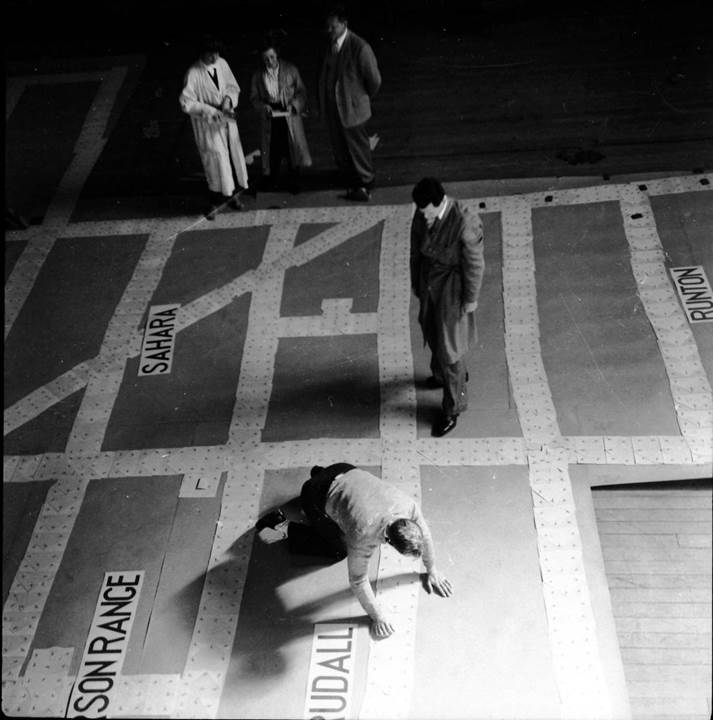
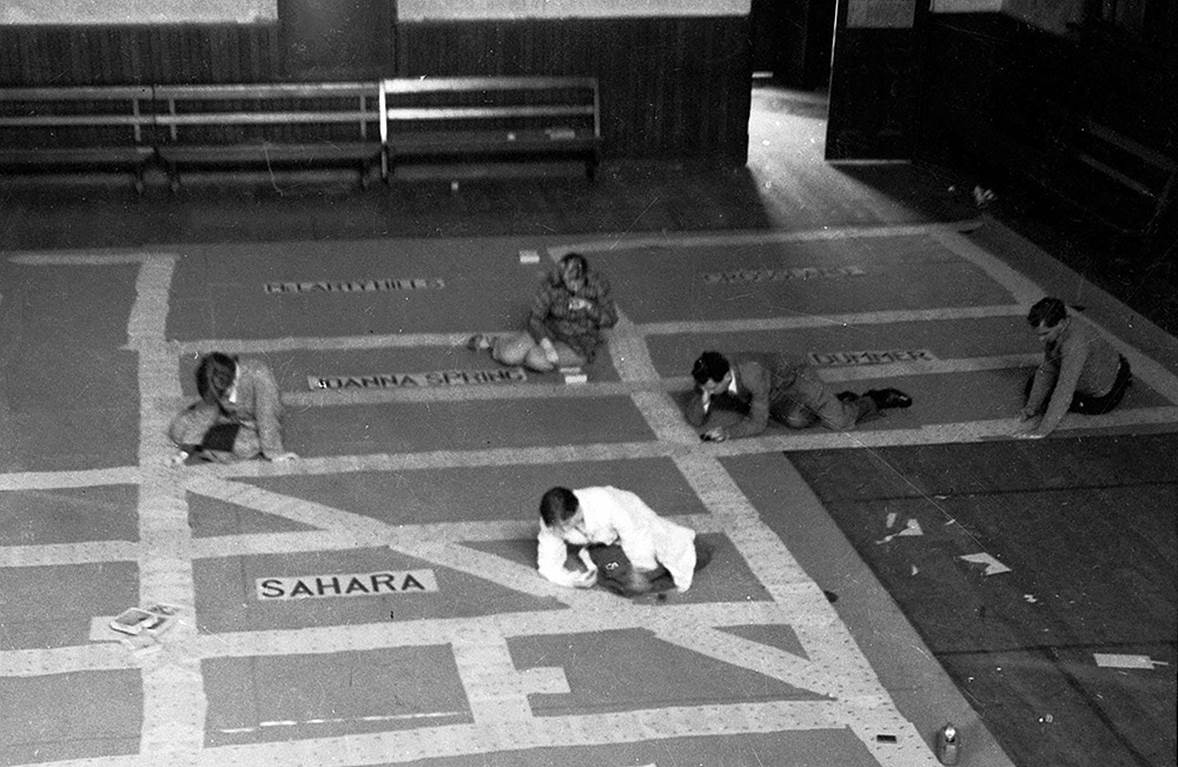
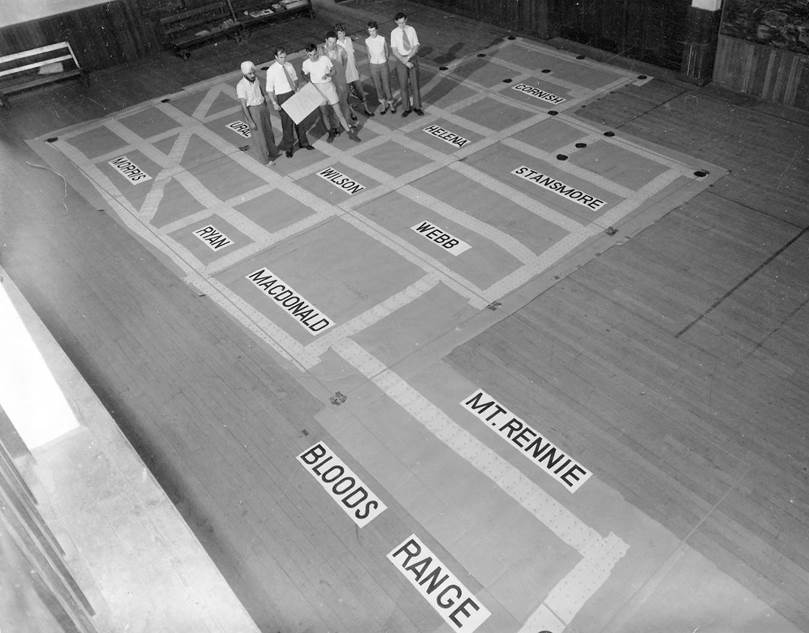
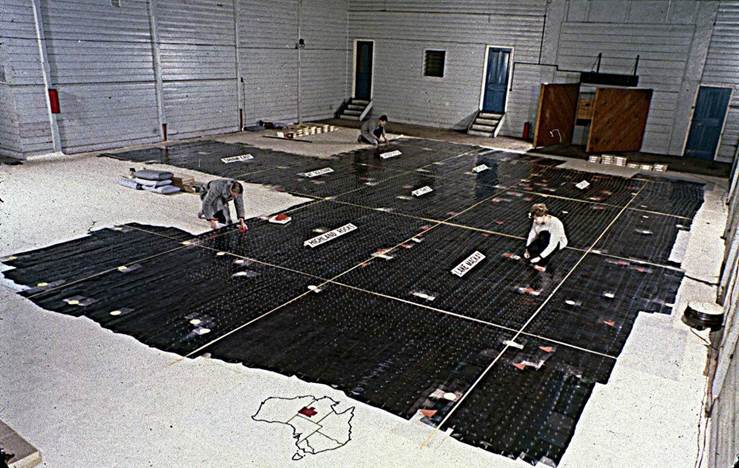
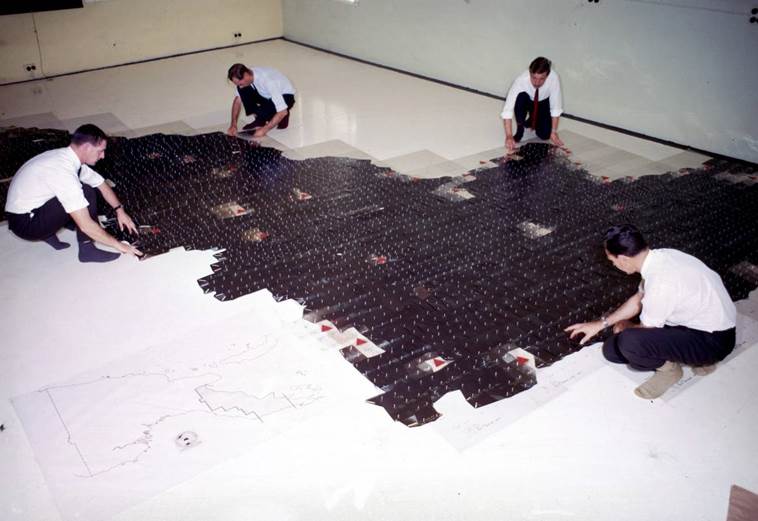
Rim Rimington (pointing) and Joe Lines assessing a completed semicontrolled mosaic laid out on the floor of Gregory Hall.
|
|
4 |
a controlled mosaic was an arrangement of overlapping aerial photographs (#), the detail of which had been matched from print to print, laid to fit ground control; this arrangement was generally used to provide the horizontal control needed to enable photogrammetric plotting of map detail. |
|
5 |
an orthophotomap, just to complete the set of definitions, was an arrangement of orthophotographs (aerial photographs with all the terrain, earth and camera related distortions removed and therefore all the features in the photograph were now truly positioned at scale) with the accuracy of a topographic map at the same scale. More about orthophotomaps is available via this link. |
|
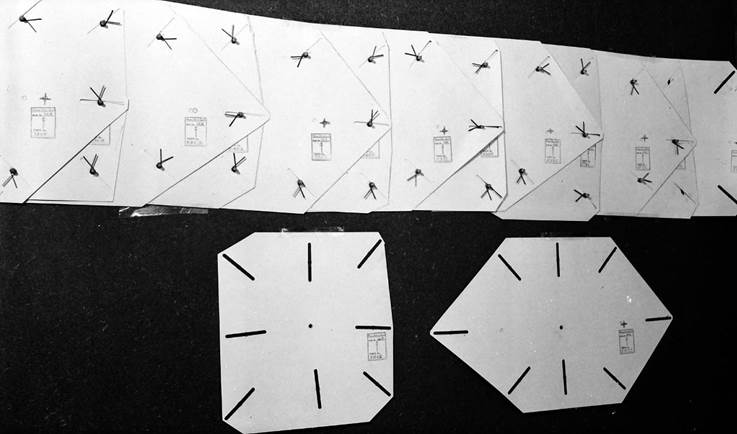
Note (#) : The prints of the aerial photography were replaced with squares of a cheap but stable material, like celluloid or old exposed Xray film called templates. Using a hand operated machine called a template cutter each aerial photograph and a blank template were aligned in the template cutter and radial slots cut in the template centred on eight predefined points being the centre of each edge and each corner. If the aerial photograph contained a ground control point a slot was cut for it. Special templates called azimuth templates were cut to help constrain the assembly during its formation. The image below shows a common (lower left) and azimuth (lower right) template and a small template assembly showing the fitting together of a series of templates. The template material shown here was a plastic called Flovic, but whatever template material was employed it needed to be rigid enough not to distort its shape or tear and be smooth enough to easily slide over and across itself and the base material.
Photograph of a common (lower left) and azimuth (lower right) Flovic template and a small template assembly showing the fitting together of a series of templates.
The template assembly was a form of graphic radial triangulation, whereby the common perimeter points were used to extend the triangulation by intersection and by resection. |
|
While shingle mosaics (1) were used for overview purposes, it is Nat Map’s production of uncontrolled (2 above) and semicontrolled (3 above) mosaics and their conversion to photomaps that is the main focus of this article.
Uncontrolled and Semicontrolled Mosaics for Photomaps
Uncontrolled mosaics were used to produce photomaps at 1: 63 360 (1 mile to 1 inch) scale in selected and resource rich areas. The area covered by these photomaps was 30 minutes of longitude by 15 minutes of latitude with the final photomap itself being 30 inches by 40 inches in size (about 1 metre square). A shingle mosaic of the area was prepared and covered by a sheet of glass to hold all the photographs flat and positioned while a photograph of the assembly was taken. By 1955 some 200 1: 63 360 scale photomaps were available.
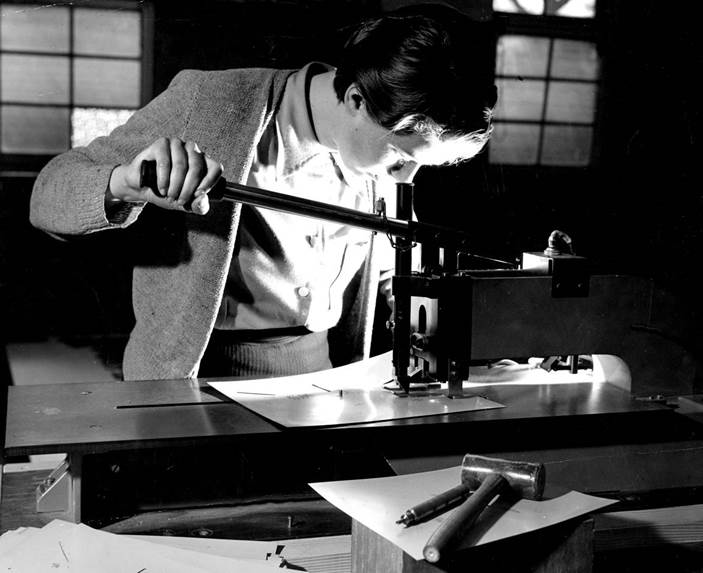
Cutting templates at Gregory Hall.
A program to produce photomaps at 1: 253 440 scale (4 miles to 1 inch) from semicontrolled mosaics, commenced in 1950. According to Lambert (1956) a special local technique had been developed in which the positions of the photographs along the edges and across the centre of a map sheet were established based on an average scale and the remaining photographs were then fitted within this framework. While independent ground control was not required for this process, if any such ground control was available then it was included to improve positional accuracy.
As blocks of adjoining 1: 253 440 scale map sheets were usually selected for photomapping the nominal photoscale of 1: 46 500 was usually adopted to generate the measurements at that scale for the block and each map sheet extent. As a check the diagonals of the extents would also be calculated. These measurements would be calculated using the then Transverse Mercator projection and corresponding yard grid (Clarke 1858 spheroid) which covered the whole of Australia in 8 zones. Each zone was 5 degrees of longitude wide with a half degree of common overlap. This was a simple projection with no provision for a scale factor and each zone’s true origin was at 34 degrees south latitude.
Large sheets of a base material were laid out on a floor. The base material would be joined as necessary to make one large sheet whose dimensions were sufficient to contain the whole block and this now single sheet would also be fixed to the floor to stop it moving while the work was in progress (noting that people would be actually walking and sitting on it during the various stages of the work). On this base sheet the dimensions of the block and the extents of each of the component 1: 253 440 scale map sheets would be drawn with the diagonals used to check the plotted dimensions.
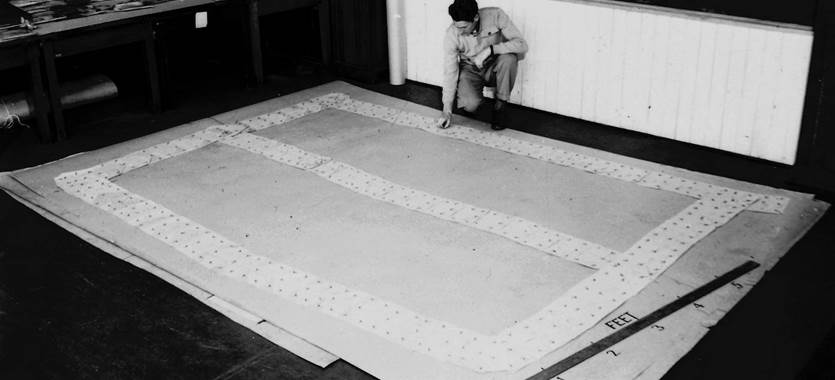
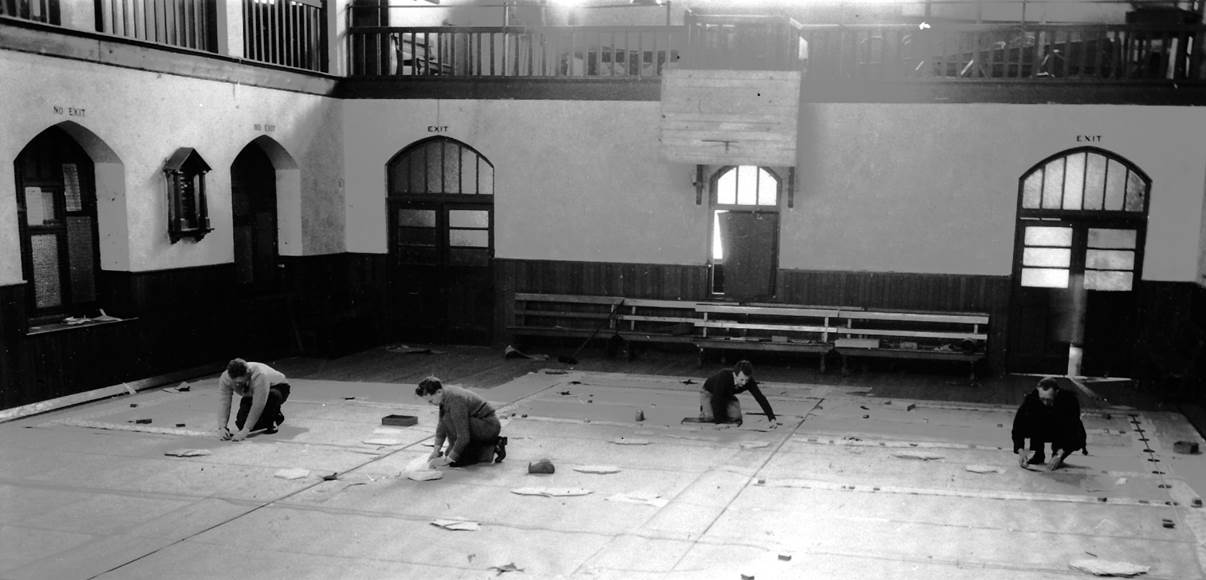
Marking, removing and annotating the perimeter control on the base sheet of a single 1: 253 440 scale map sheet.
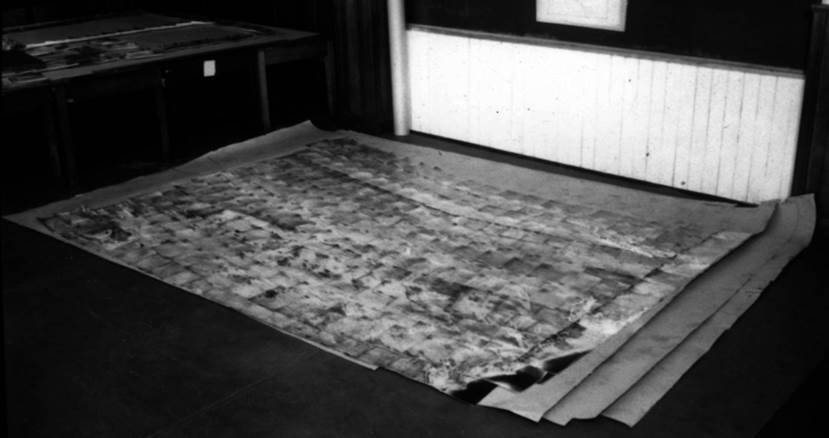
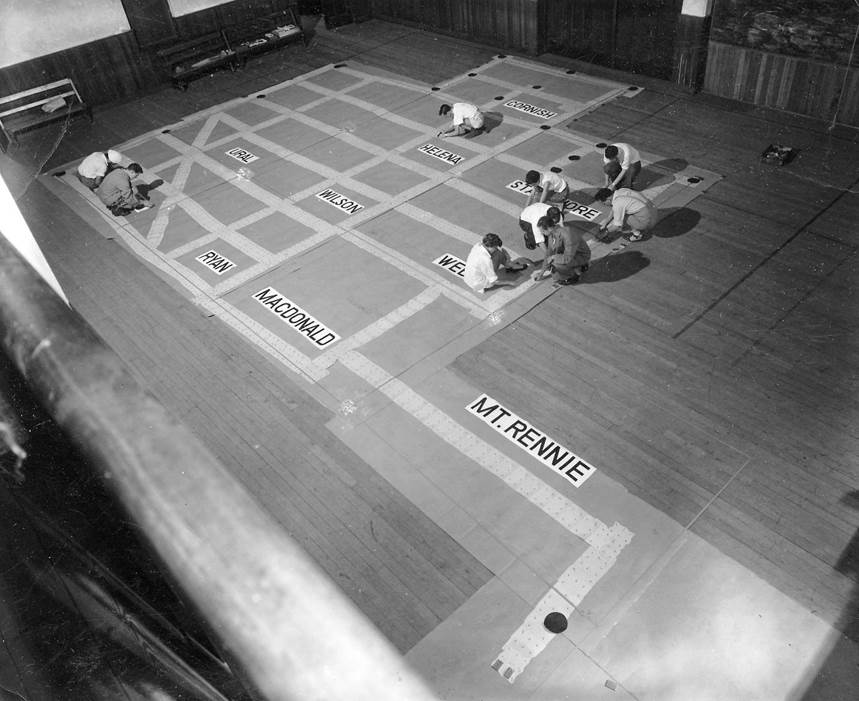
A completed 1: 253 440 scale mosaic fitted to its perimeter control.
Separately the templates for the block would be prepared. For each map sheet, the templates for runs 1, 8, 15, the east key and west key would be assembled using the lines on the base sheet. Along the common edges a decision would be made as to whether run 1 or 15 was used and generally the east key was preferred when both the east and west keys were available. Once this perimeter was established, the positions of each template’s centre and perimeter points were pricked through to mark the base material. As each template was then removed the marks on the base material were identified. The base material for each 1: 253 440 scale map sheet with its identifiable marks was then used to position all the applicable photographs. These photographs would be cropped of their surrounding frame. When completed the mosaic was now oriented and at average scale. Major detail was now annotated in ink to be visible at final scale and a separate legend composed.
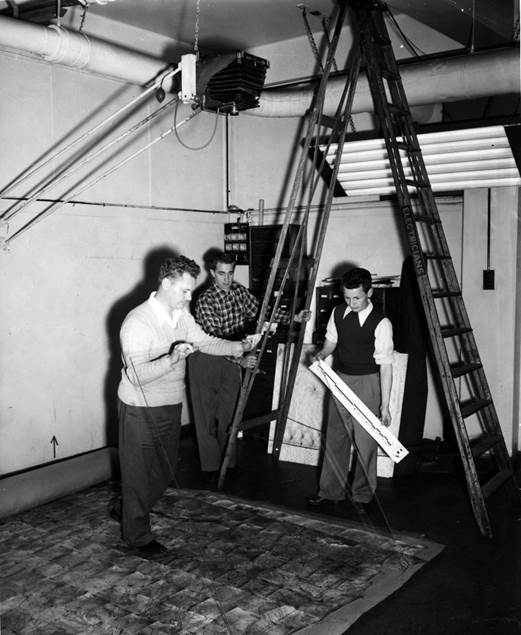
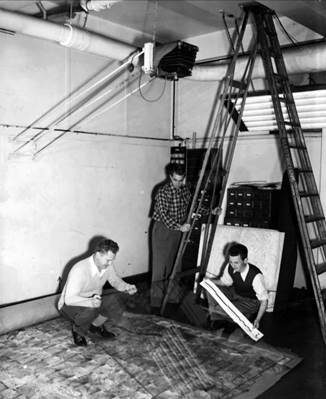
Photographic arrangement for producing photomaps from mosaics with Bill Trevena holding the glass plate, Len Bentley the ladder and Ben Konings the map legend.
The resulting annotated mosaic was then photographed from above in six sections. Each section at a scale of 7 miles to an inch was then mosaiced and photographed resulting in an enlarged photomap 30 inches by 24 inches in size (about 1 metre square) at 4 miles to one inch scale.
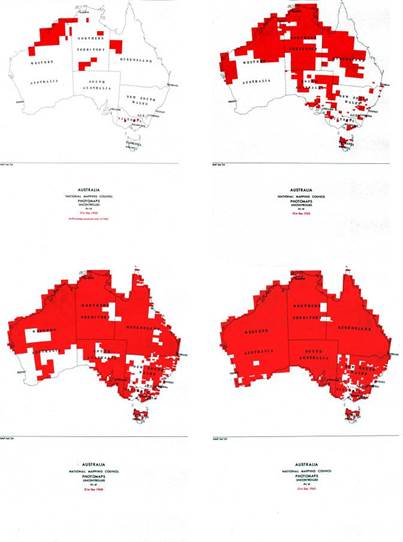
National Mapping’s 1955 and first map catalogue listed as published, some 200, 4 miles to 1 inch scale photomaps. By 1960, about 75% of the Australian mainland had been covered by approximately positioned photomaps at either 1 mile or 4 miles to the inch.
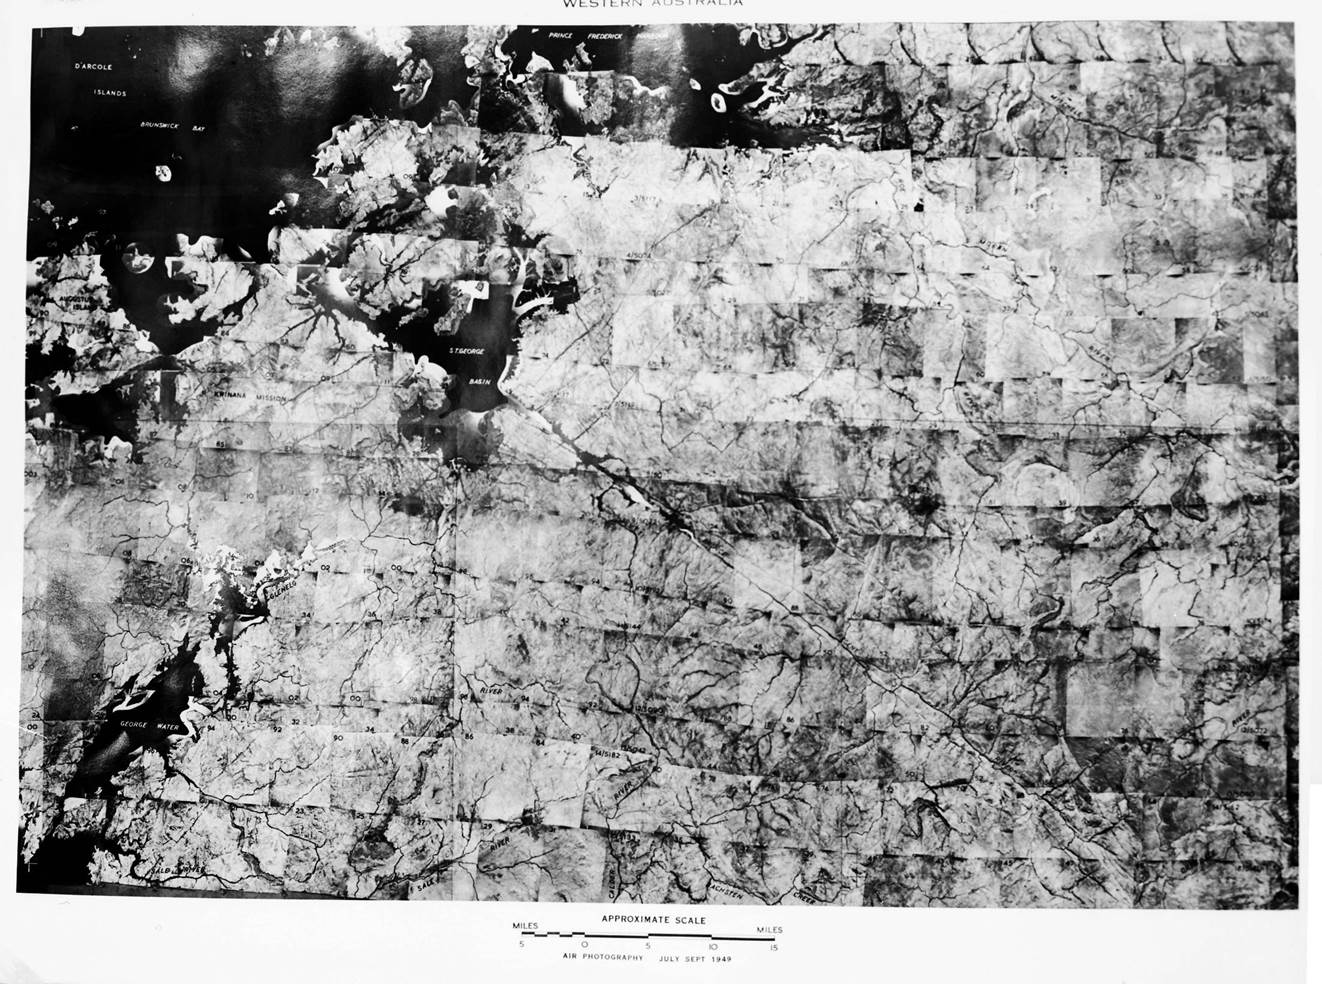
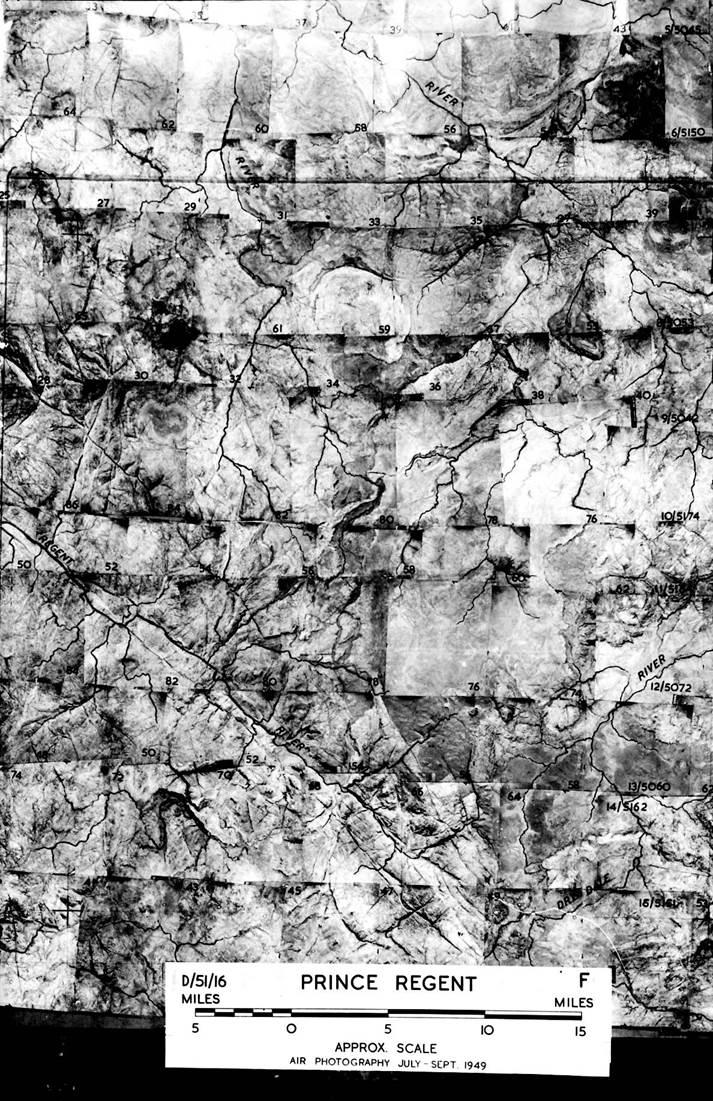
Sample of a published photomap at 1: 253 440 scale (4 miles to 1 inch).
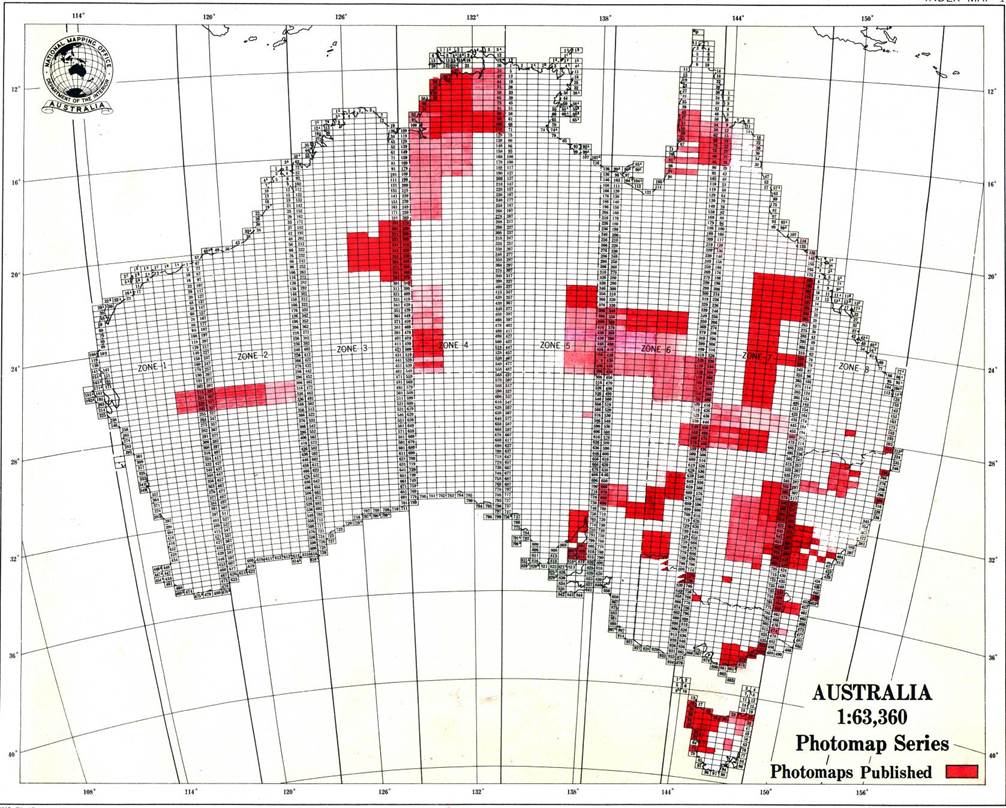
Published photomaps at 1: 63 360 (1 mile to 1 inch) as shown in the 1955 Map Catalogue;
this page had been hand annotated to also show photomaps published after that date.
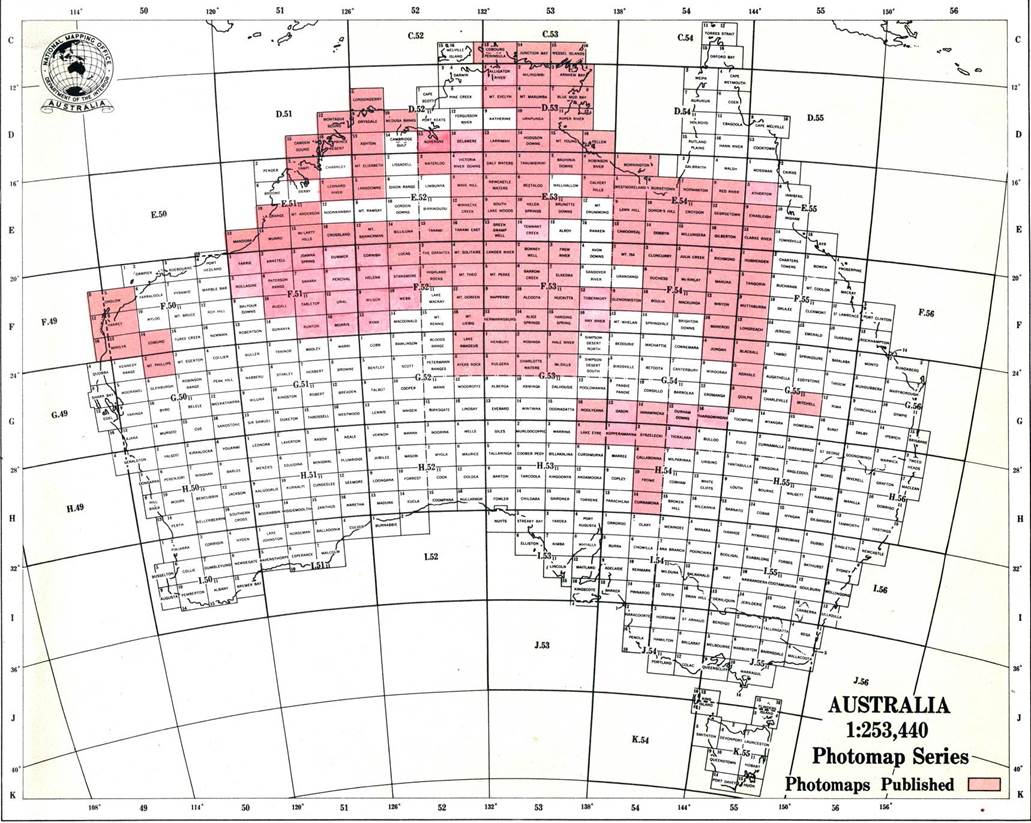
Published photomaps at 1: 253 440 scale (4 miles to 1 inch) as shown in the 1955 Map Catalogue;
this page had been hand annotated to also show photomaps published after that date.
Photomapping at Gregory Hall
In early 1948 the Survey and Photogrammetric Office of National Mapping was established in Melbourne. From 1949 to 1959 National Mapping operated from the All Saints Anglican Church Hall, Gregory Hall, in Chapel Street, St Kilda. During this time, photomaps of a significant portion of Australia were produced. As shown by the photographs in this article, the main hall floor was used for the layout of slotted template assemblies and the upper floor as office space. The All Saints Church Hall and former Vicarage is today listed by the Heritage Council of Victoria.
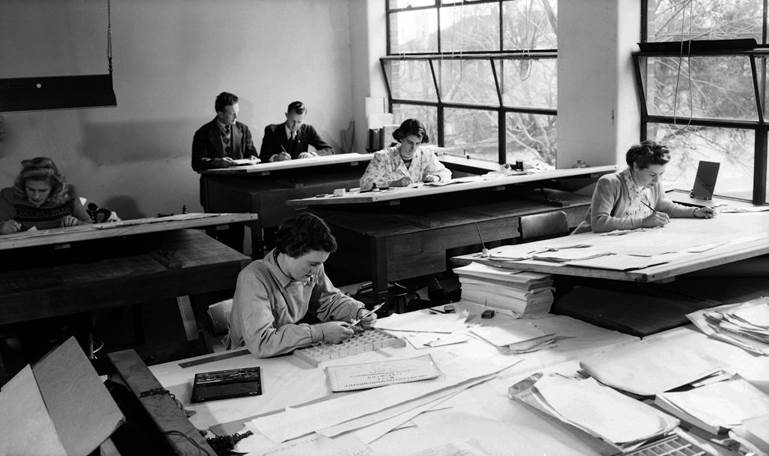
Draughting Office, Gregory Hall.
Further information
Subsequently, in Nat Map’s Rialto office between 1965 and 1972 1: 100 000 scale photo indices were produced from aerial photographs captured with Wild RC9 aerial survey cameras at a nominal 1: 80 000 scale. Automated photogrammetric techniques were used by Nat Map from 1968 to 1978 to publish 783 1: 100 000 scale orthophotomaps. An orthophotomap was a mosaic of 1: 80 000 scale aerial photographs where the photographic images had been rectified to their true plan positions. Owing to constraints imposed by the original 1: 80 000 scale aerial photography image, quality was an ongoing issue with many of the orthophotomaps and as a consequence they were only generated for some areas in the Northern Territory and in Queensland. Orthophotomaps were eventually replaced by digital map compilation techniques.
More about mosaicing and photomap production may be found in these two papers :
Hocking, David Roy (1967), Photogrammetric Planimetric Adjustment; and
Hocking, David Roy (1998), NATMAP Early Days, Map Compilation from Aerial Photographs 1948-1970s ;
and these internal National Mapping Office and Royal Australian Survey Corps Instructions are also available :
National Mapping Office (circa 1950), Instructions for the Guidance of Photogrammetric Draughtsmen – Four Mile Mosaics;
National Mapping Office (1951), Instructions for the Guidance of Photogrammetric Draughtsmen;
Royal Australian Survey Corps (Unknown), Manual of Photogrammetry and Topographical Draughting : Slotted Templates;
Survey Directorate GHQ, Middle East (1942), Instructions for the Use of Slotted Template Equipment, Technical Pamphlet No.13, Reprint of the pamphlet by Major DR Crone, OBE, RE, dated 9 November 1942.
|
Additional Photographs of Mosaicing and Photomap Production at Gregory Hall |
|
|
|
Early stage of the mosaicing process showing the base material with marked extents and template laying just commencing. |
|
|
|
Working on the perimeter templates. |
|
|
|
Working on the perimeter templates. |
|
|
|
Working on finalising the perimeter templates. |
|
|
|
Dave Hocking (holding plan) with Natmappers examining a semicontrolled mosaic perimeter at Gregory Hall. |
|
|
|
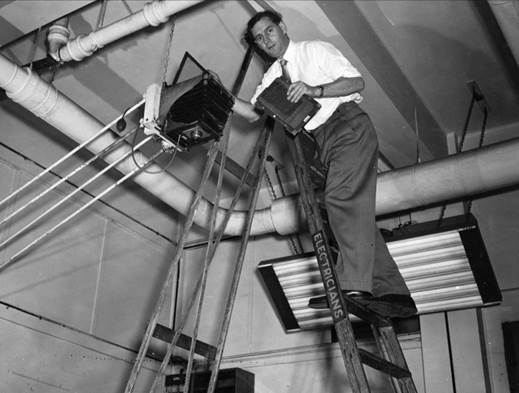
Photographic arrangement for producing photomaps (left) and inserting the film plate in the camera (right). |
|
|
|
The large format process camera which could photograph a whole 1: 253 440 scale map sheet in one frame. |
|
|
|
An enlarged section of a 1: 253 440 scale photomap. |
|
|
|
Total photomap production by National Mapping at 1950 (no photomaps produced prior to 1945), 1955, 1960 and 1965 from National Mapping Council (1966), Report on Work Completed during the Period 1945-65, Division of National Mapping, NMP/66/24. |
|
|
|
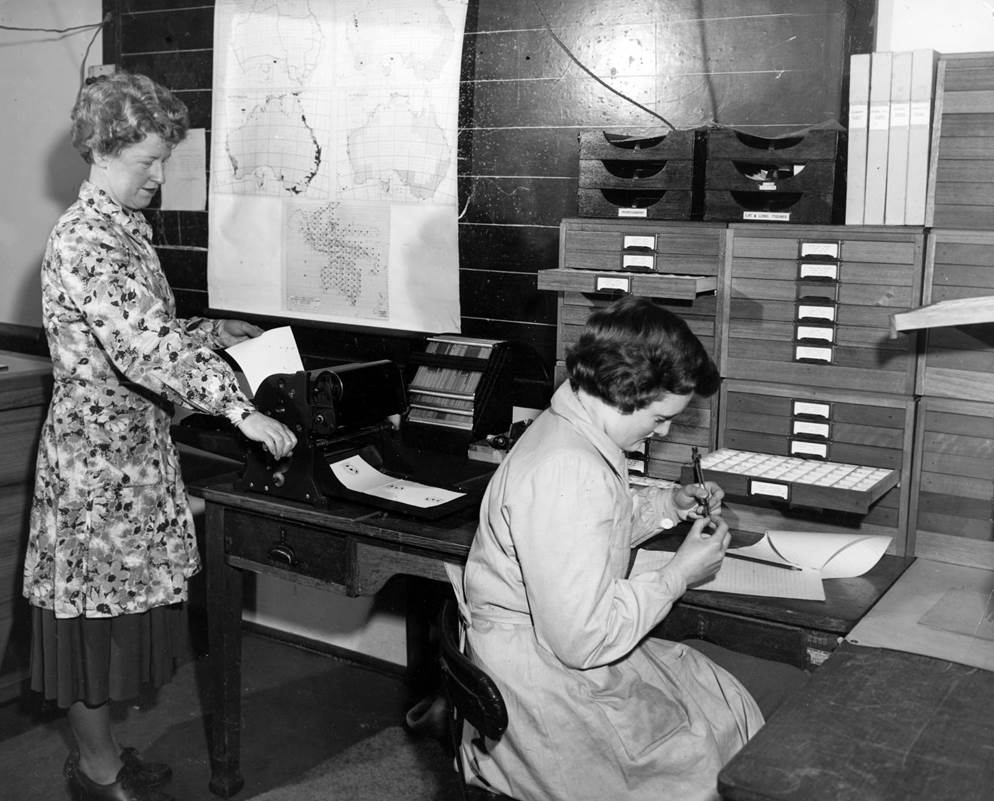
Bette Hobbs (standing) and Janet McLeod (seated) using what is believed to be a hand operated, Addressograph-Multigraph Corporation, Multigraph Printer; the draws behind Janet contained the set pieces of printer’s type that were selected and formatted in the printer to produce the required document, in this photograph the then Nat Map logo. |
|
All photographs used courtesy XNATMAP or Peter Hocking. |

PAPER NO. 17
Report on Colloquium Control for Mapping by Geodetic and Photogrammetric Methods (Ed. P.V. Angus-Leppan) held at the University of New South Wales, 22-24 May, 1967, pp.320-332.
PHOTOGRAMMETRIC PLANIMETRIC ADJUSTMENT
by
D.R. Hocking
Abstract: This paper describes improvements to the slotted template method of radial triangulation. Results are given of slotted template tests using the Canberra photogrammetric test block. A suggested procedure is outlined for obtaining block adjustment information for larger scale mapping when using an automated stereoplotting system.
1. Introduction
Graphical, slotted template and numerical radial triangulation methods are well known and have been used for many years to increase the density of horizontal control for mapping from aerial photographs. (1) The slotted template method is particularly suitable for intensifying control for rapid planimetric mapping.
Within the Division of National Mapping slotted template assemblies have been completed for over two hundred 1:250, 000 map areas in Australia covering nearly 1.25 million square miles and for about two hundred and thirty 1:50, 000 map areas in Papua - New Guinea covering approximately 41,000 square miles.
Where possible, templates have been assembled in large blocks and laid to the next line of control outside the area to be mapped, in order to obtain the best position from the ground control available.
Annexure 'A' gives examples of two large template assemblies; one covers 88,000 square miles (about the area of Victoria) in the semi-desert region of central Australia and the other about 20,000 square miles of generally mountainous country extending from sea level to over 11,000 feet in Papua - New Guinea.
Over the years many refinements have been introduced and it may be of interest to describe the more important developments in techniques and equipment leading to improved accuracy of the horizontal control for mapping using slotted template radial triangulation.
These developments have resulted in the control intensification procedure to be described, which is aimed at the rapid production of the 1:100, 000 scale Australian map series with 20 metre contours from 25,000 ft. RC9 photography. The vertical control is obtained from Airborne Profile Recorder (APR) profiles along the middle of the side lap between runs of mapping photographs so that no extensive aerial triangulation for heights is required.
2. Slotted Templates - General
The main steps between receiving the photographs and control, and passing the map base sheets to the stereoplotter operators for plotting detail are:-
1. Preparation of the photogrammetric work diagrams.
2. Obtaining diapositives.
3. Marking ground control, radial centres and tie points and transferring these points to adjacent diapositives.
4. Preparation of slotted templates.
5. Preparation of map base sheets.
6. Template assembly.
7. Pricking through template positions and identifying these on the map base sheets.
3. Procedure in More Detail
Photogrammetric Work Diagrams. The preparation of these diagrams is of the utmost importance in the systematic planning and execution of the photogrammetric work, particularly when a large block is being mapped.
The ground control, aerial photography flight lines and photocentres are plotted on overlays to the 1:250, 000 maps. Photo coverage usually consists of 8 east-west runs with RC9 camera taken at 25,000 feet with 800/o forward and 250/o side lap, giving about 190 models per 1:250, 000 map area. The best selection of models is made so that the photocentres of adjoining runs are as near as possible in line north-south. In addition, sufficient of the 35mm. APR profile positioning photocentres are plotted on the diagram to show the profile in relation to the side lap between runs of mapping photos.
Diapositives. Stable base film diapositives .004 inches thick compensated for lens distortion, earth curvature and atmospheric refraction for 7,000 metre flying height, are produced using the U4A printer. The diapositives can be printed with either a cross or a dot and circle at the photocentre. The 0.1mm. dot with a 4mm. diameter circle is preferred for more accurate point transfer.
Point Selection, Marking and Transfer. The ground control is transferred from the 1:30,000 scale spot photography to the 1:80, 000 scale mapping photography using a Bausch and Lomb Zoom 95 stereoscope. Vertical control is selected along the APR profile and if this is close to the centre of the common overlap then it may be used as both tie point and vertical control point. Otherwise a separate tie point is selected. In the case of badly tilted photos of rugged country, by levelling the model to APR profile heights, the nadir may be found and used as the radial centre. Point selection and transfer are done stereoscopically using Wild mirror stereoscopes with 8X binoculars cantilevered over the diapositives on a light table. Points are marked using a hand-held needle or scribe point.
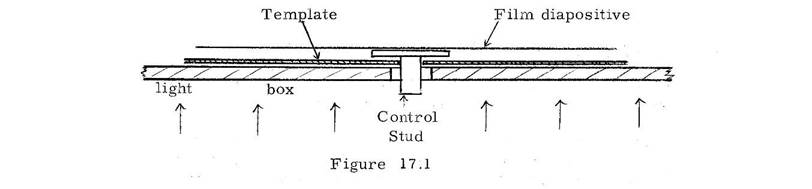
Preparation of Slotted Templates. The template material is "Flovic", a white opaque P.V.C. plastic .015 inches thick which is stiff, smooth, cheap, cuts cleanly and is not seriously electrostatic. Template blanks are cut about 10 inches square with a 4mm. diameter hole near the centre. A control stud (see Template Assembly paragraph) is put in this hole. Then on a light table, which has a hole in it to take the control stud shank, the radial centre on the diapositive is placed over the centre of the small circle on the base of the perspex insert in the control stud and the position of points on the diapositives pricked through to the template. See Figure 17.
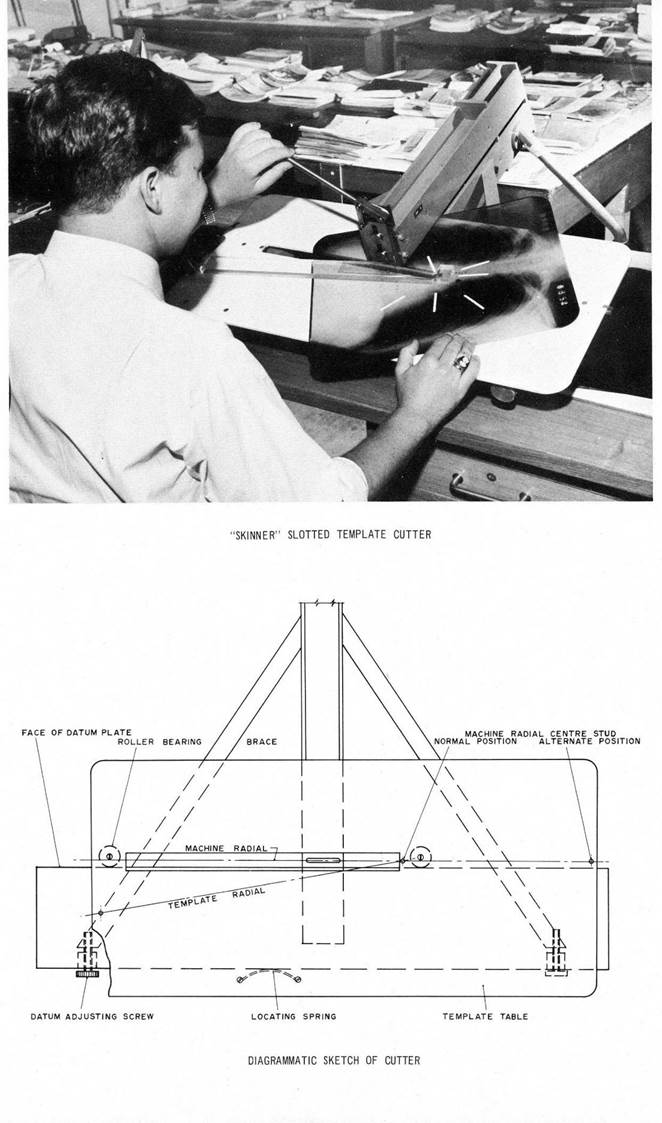
The templates are slotted on a machine designed by S.R. Skinner, Melbourne, in conjunction with the Division. (See Annexure 'B'). Accurate templates are produced quickly on this machine, which is comfortable to operate and is much cheaper than the imported product. An interesting design feature is the fixed angle of 10 degrees between the template radial direction and the machine (slot) radial direction with the point on the template being positioned between a double line on the base of the perspex cursor. In addition, the table can be displaced parallel to the slot radial enabling templates to be easily and accurately slotted at a different scale without any need for radial lines to be drawn on the template.
Two cursors are available which provide overlapping ranges of radial distances as follows:-
Normal cursor l cm. to 35cm.
Long cursor 31cm. to 65cm.
The slot is 4mm. wide and normally 50mm. long. However, a much longer slot can be cut by moving the table carrying the template and extending the slot to accommodate large radial displacements.
Preparation of the Map Base Sheets. Stable drafting film, "Ozatex" .003 inches thick, is used for the base sheets on which the sheet corners, graticule, grid and ground control points are plotted at 1:100, 000 scale using a Wild Co-ordinatograph.
A 4mm. diameter hole is punched at each map sheet corner to take a register stud and then the base sheets are laid out in one block. The exposed edges of the overlapping sheets are covered with tape to avoid any sharp edges on which the studs could lock during the template assembly. The masonite floor on which the assembly is laid is 32 ft. x 22 ft. and painted gloss white.
Template Assembly. As previously mentioned, the slot width in the template is 4mm. Some tolerance between the stud and slot is necessary before any adjustment can be made. The amount of tolerance depends mainly on photo tilts, terrain slopes and accuracy of point marking.
While a stud diameter of 3.85mm. giving a tolerance of 0. 15mm. may be used in a template assembly prepared from air-dried paper prints of a mountainous area in New Guinea, it is possible to reduce this tolerance when using the procedures described for slotted template triangulation in the relatively flat areas of Australia.
A stud diameter of 3.97mm. was selected and two types of studs are used:-
1. Control stud, a brass with a 0.8mm. diameter circle engraved on the base of a perspex insert.
2. Movable studs, brass with a 2mm, diameter hole concentric with the shank to take the pricking needle.
The control stud is a smaller edition of one which has a shank diameter of 0.25 inch and is used by the United States Geological Survey for stereo-template assemblies. Control studs are accurately positioned with the circle on the stud base concentric with the plotted ground control point, and securely taped to the base sheet.
Templates are then laid out between the control, run by run, with frequent tapping of the templates to obtain the best adjustment. The assembly is considered complete when all the templates are laid to the control and the entire assembly is free of buckles with all stud bases flat on the base sheets. Spring wire clips are placed on the studs and pushed down to lock the assembly prior to pricking through the template positions to the base sheets which is done systematically, run by run, to avoid missing any points.
It is not necessary to prick through the radial centre as it is the practice within the Division to show the photocentre on the manuscript map so that other agencies may add additional information, for example, geophysical data by radial methods. The photocentre can be added to the manuscript map at the detail plotting stage when the diapositives are in the stereoplotter.
As the templates are lifted, the pricked points are labelled and circled freehand on the base sheets which after being inked up are then passed to the Wild B8 or Kern PG2 instrument operators for topographic detail plotting.
Accuracy of Slotted Template Triangulation. Tests of the improved slotted template method have been made using the Canberra Photogrammetric Test Block consisting of 4 runs of 8 models of Wild RC9 photography with a 10, 000 ft. flying height above ground. This gives a block of 32 models at 1:35, 000 approximate photo scale compared with the 32 (usually) models at 1:80, 000 approximate photo scale for a 1:100, 000 map area.
Survey stations with photo identified ground control points have been established at all 45 model corners.
The 1959 RC9 photography which was the first to be flown in Australia is on pyro developed Super XX film and the quality is obviously below present day standards.
The flying is good and the photo tilts in grads are:-
Omega Maximum = 1.56 mean 0.56
Phi Maximum = 0.96 mean 0.45
The control distribution for the tests was as follows:-
4 controls, one at each corner of the block.
5 controls as above plus one in the centre.
9 controls as above plus four, each one midway between the corner control.
16 controls full perimeter control less alternate model corners on Runs 1 and 4.
The residuals are at the triangulation scale of 1:40, 000 (photo scale is 1:35, 000 approx.) and were obtained by comparing the template position read on the co-ordinatograph against the ground control co-ordinates.
Brief Description
|
|
Fixed Control |
Check Control |
m.s.e. in mm. |
|
|
Slotted template triangulation from hand marked points on film diapositives with photo-centre as radial centre.
|
4 |
40 |
± |
.16 |
|
4 |
40 |
|
.18 |
|
|
4 |
40 |
|
.18 |
|
|
5 |
39 |
|
.15 |
|
|
9 |
16 |
|
.12 |
|
|
16 |
28 |
|
.09 |
|
|
|
|
|
|
|
|
Same set of diapositives as above but with the nadir as the radial centre.
|
4 |
41 |
|
.18 |
|
4 |
41 |
|
.24 |
|
|
5 |
40 |
|
.16 |
|
|
9 |
36 |
|
.11 |
|
|
16 |
29 |
|
.08 |
|
The results tabulated are the most recent and include the maximum number of check control points. It is significant that with a tolerance of 30μ between stud and slot both sets of templates, nadir and photocentre, lay flat to the full model (45) control points.
Earlier test results, from three different sets of slotted templates using a point near the nadir as the radial centre gave an average m. s. e. for eight assemblies of ±0.19mm. when held to the 4 corner control points and using 32 check controls.
It is worth noting that the test block is a neat area, i.e., no 'overspill' of models is available. Experience with template assemblies and a recent paper by Ackermann (2) shows that improved planimetric accuracy can be expected when the photogrammetric block is extended beyond the neat line joining control points.
In the tests the average m.s.e. in position from templates laid to 4 control points is less than ±0.2mm. and it is expected that this figure would be improved using stable base film photography and extending the block adjustment to the next line of control.
Production results are, usually, not quite as good as test results. However, if the work is carefully done using the procedures described then a m.s.e. not greater than -±0.25mm. is anticipated in production. This would allow an adequate margin for the scaling-in error and plotting error thereby meeting the National Mapping Council, Standards of rap Accuracy, which require a m.s.e. in position not greater than ±0.3mm.
4. Future Developments - Automated Plotters
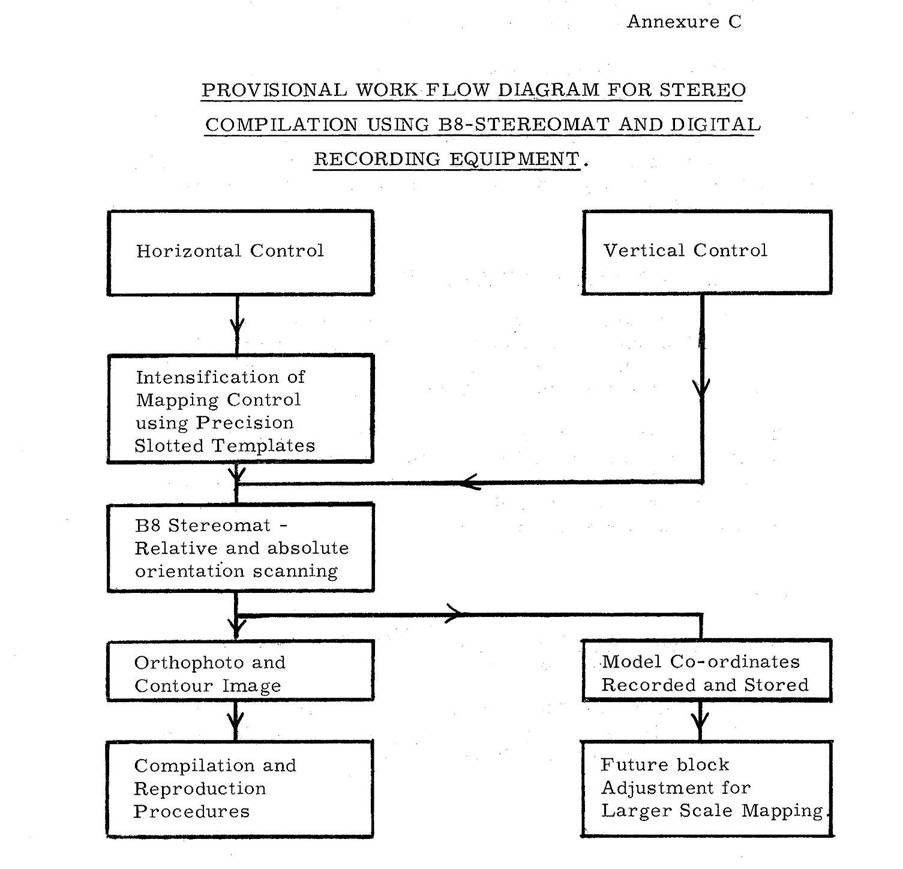
The Division expects delivery of a B8 - Stereomat Automated Plotter later in 1967 and the arrival of this instrument is awaited with keen interest. A provisional flow diagram covering the map control segment of the system is attached as Annexure C.
The main idea is to carry out the absolute orientation by levelling to APR heights and scaling in to slotted template positions. Then, after scanning the model for the orthophoto and contour image data the model co-ordinates would be recorded and stored for future block adjustment for larger scale mapping when required.
References.
(1) I.T I.T.C. Textbook of Photogrammetry. Vol. III, Chapter 111.2. Radial Triangulation. Delft.
(2) F. Ackermann. On the Theoretical Accuracy of Planimetric Block Triangulation. International Symposium of Spatial Aero-triangulation 1966, University of Illinois.
SLOTTED TEMPLATE ASSEMBLY FOR AUSTRALIA 1:250,000 R502 SERIES.
Area : 88,000 sq. miles; 1:50,000 template scale; Number of templetes : 8,300; Number of studs : 17,000; Map control : Astro and Geodetic.
SLOTTED TEMPLATE ASSEMBLY FOR 1:50,000 BASE MAPPING FOR RESOURCE SURVEYS IN PAPUA AND NEW GUINEA.
Area : 20,000 sq. miles; 1:50,000 template scale; Template material : Xray film and Cobex; Map control : Geodetic.
Annexure B
NATMAP EARLY DAYS, MAP COMPILATION FROM AERIAL PHOTOGRAPHS 1948 ‑1970S
David R. Hocking
This paper describes the methods used to compile maps from aerial photographs, commencing 50 years ago, by the National Mapping Section / Office as it was variously known in those early days before becoming the Division of National Mapping (Natmap). Some of these products were: aerial photo indexes, mosaics, radial line plots, slotted template assemblies, 'shift & trace' or Zeiss Sketchmaster or Wild A6 plotted map compilation sheets. These map‑substitutes and planimetric small scale maps at 1:253 440 and 1:250 000 were urgently needed by users, such as Natmap surveyors and geo‑scientists who wanted information about the country they were working in and needed to record their findings as accurately as possible in relation to the terrain. With the first priority special mapping needs being satisfied, a more precise method of slotted template planimetric adjustment of very large blocks of aerial photos for horizontal position at 1:100 000 scale was introduced in the 1960s. Vertical control for the 20 metre contour interval specified for the 1:100 000 scale topographic map series was obtained using airborne radar /laser terrain profiling along the sidelaps of the aerial photo coverage. Stereoplotting of map detail and contouring from stereoscopic models formed from overlapping aerial photos using Kem PG2 and Wild B 8 instruments is described.
Aerial photographs, until recently, have been the main provider of topographic information for a national mapping program. Satellite imagery is now being used to revise major features of the small scale, 1:250 000 data base. The high resolution, 1 metre ground sample distance, satellite imagery expected to be available during 1998/99 will be used to upgrade the medium and large scale, 1:100 000 and 1: 250 000 data bases. Aerial photography will continue to be used for the large scale project mapping needed for engineering, mining, construction, and so on and, no doubt, both digitized aerial and satellite imagery will be used on some projects.
During the past 80 years the major events in the imagery available for mapping Australia at small and medium scales are:
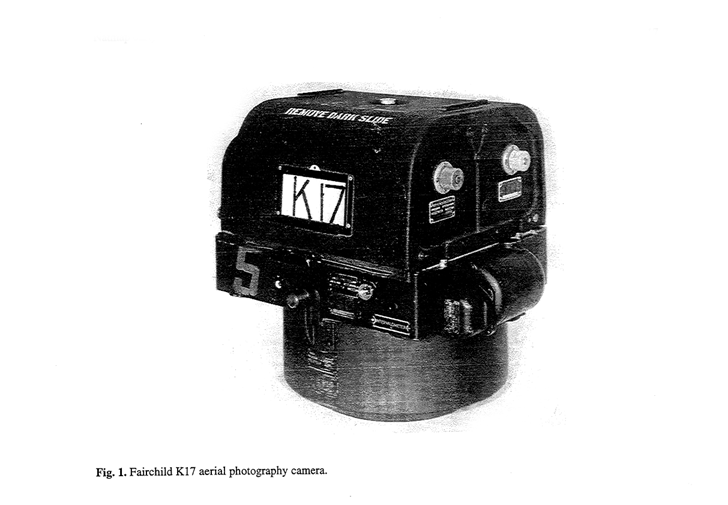
The 1:50 000 scale Fairchild K17 camera aerial photos obtained from 25 000 feet by RAAF, 87 PR (Photo Reconnaissance) Squadron, 1947‑1953. These photos provided the basic data for the 1:253 440 and 1:250 000 R502 map series.
The 1:80 000 scale Wild RC9 or RC10 camera aerial photos taken from 25 000 feet and obtained by Natmap using contractors during the 1960s and 1970s. These photos provided the basic data for the 1: 100 000 series and the 1:250 000 National Topographic Map Series.
The eagerly awaited availability in 1998/99 of 1 metre high resolution images from the Space Imagery Eosat (SIE) 'Ikonos 1' satellite. This imagery will provide the basic data for up‑grading medium and large scale data bases. See www.spaceimage.com for more details.
SUMMARY OF AERIAL PHOTOGRAPHY DEVELOPMENT IN AUSTRALIA
1920s After the First World War some general purpose cameras were used and photos taken with the camera held over the side of the aeroplane.
1924 RAAF, Royal Australian Air Force, first areas for mapping, using a P18 plate camera which had a 4"x 5" format.
1927 RAAF, F8 (Eagle 1), 100 exposures on film, 7"x 8¼" format with 8¼" lens. Ca.
19 000 square miles photographed in eastern Australia.
1930 RAAF, F8 or Williamson Eagle 111.
1936 RAAF, Williamson Eagle IV, 7"x 9" format. Commercial aerial survey companies started operating.
1939 RAAF photographed areas for NAS ‑ (Aerial Geographical and Geophysical) Survey of Northern Australia.
1940 RAAF used Eagle IV to photograph large areas of Australia.
1942‑45 US Air Force acquired small scale reconnaissance photography with simultaneous exposures of three cameras, one vertical. two oblique depressed 30 degrees, one port and one starboard normal to the flightline, to cover strategic areas of Australia.
1943 RAAF obtained the Fairchild K17 9 x 9 / 6 inch, wide angle (90 degrees) Metrogon lens cameras. (Fig. 1)
1944 Victoria and Tasmania set up state government aerial survey agencies to provide photogrammetric services. Aerial photography obtained by commercial companies.
1945‑53 Demand increases with RAA.F us the Fairchild K 17, 9 x 9 / 6 inch and, later Williamson OSC (Ordnance Survey Camera).
Civilian agencies use the Williamson Eagle IX, 9 x 9 with a choice of 6, 8¼, 10, 12 or 14 inch focal length lens. In 1948, the RAAF 87 (PR) Squadron photographed
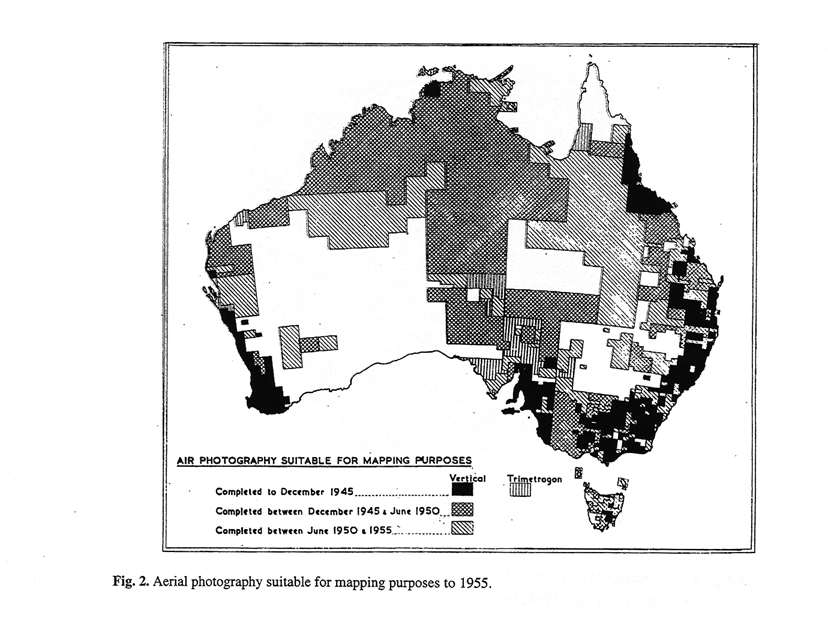
~ 650 000 square km in northern Australia. Until 1954 all aerial photography work for the Commonwealth was done by the RAAF, ‑ 3.25 million km2. (Fig. 2).
1954‑59 Commercial companies acquired aerial photography for the Commonwealth.
1960 Natmap purchased Wild RC9, 230 x 230 / 88 mm superwide angle SWA (120 degrees) camera. Initially, the RC9 camera was hired to the successful contractor, but contractors such as Adastra Airways, Civil Aerial Surveys, Kevron Aerial Surveys and Queensland Aerial Survey Co. soon purchased their own SWA cameras, either Swiss Wild or German Zeiss.
1976‑80 High altitude 12 500 m 'Lear Jet' Wild RC 10, 150 mm (1: 80 000) and 88 mm
(1:140 000) scale photography.
1970‑98 Commonwealth, State and Territory mapping and geo‑spatial information agencies increased their use of commercial aerial survey companies for aerial photography,
photogrammetric, survey and mapping services (see www.ozemail.com.au/~aasa for more details).
High resolution Satellite Imagery
The Earthwatch, 'Earlybird' 3 metre, high resolution imaging satellite was unfortunately lost in space (see www.digitalglobe.com). Space Imaging Eosat's, 'Ikonos' 1 metre, high resolution imaging satellite was due to be launched in 1998, but has been delayed until mid‑1999 (see www.spaceimage.com).
K17 AERIAL PHOTOGRAPHY
In 1947 a 'Four‑mile to the inch', 1: 253 440 scale map area of 1 degree latitude x 1½ degrees longitude was covered by 15 runs of 40, K17 aerial photos taken from 25 000 feet with 60% forward lap and 25% side lap, a total of about 600 photos for stereo cover or 300 for non‑stereo coverage. When Natmap field survey work started in 1948, aerial photos were scarce with a single set, the field set of matte photos, being shared between the Natmap and CSIR (Commonwealth Scientific and Industrial Research) field parties. Reliable maps did not exist and field workers had to lay out the photos in a rough shingle mosaic to get some idea of the country they were working in. Laying out hundreds of photos in the field was a challenging task with any sort of a breeze blowing!
The Tennant Creek Reconnaissance Map, produced in 1948 by W.A. (Alan) Thomson and K.O. (Ken) Johnson, was the earliest compilation by Natmap using the photogrammetric method of radial line plotting of map detail from aerial photos. (Salt 1933) (Fig. 3)
Photo Indexes were prepared by plotting aerial photo centres on the best available base map and joining these to form the runs of photos. Runs were labelled with the first and last photos numbered and every fifth photocentre along the run. Photo coverage was then checked for compliance with coverage and overlap specifications.
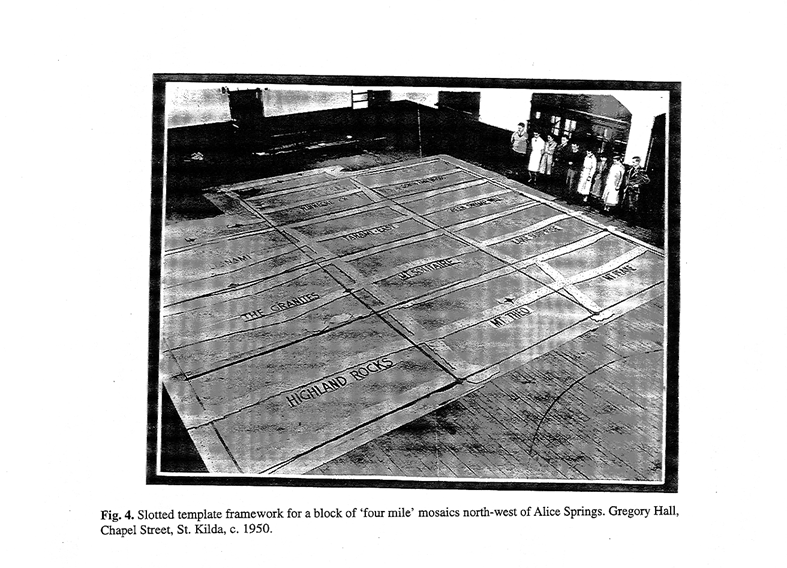
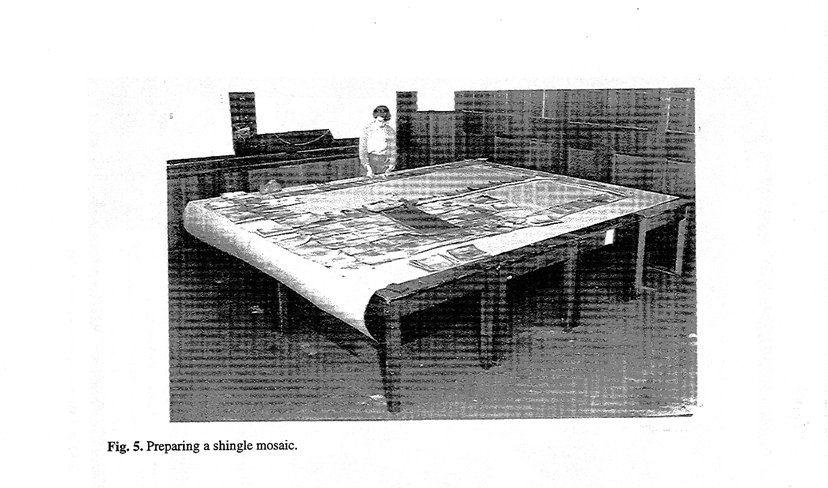
Photo Mosaics in this era were usually prepared by laying a framework of slotted template runs at photo scale (1:46 500) between survey control points. Ideally, control would be identified on Runs 1 and 15 and East and West Key Runs. (Fig. 4) The slotted template positions would be pricked through to the kraft paper base sheets, the photos laid over the framework positions with the other photos used to fill in the gaps by matching detail. (Fig. 5) This was known as a shingle mosaic with Run 1 overlapping Run 2 and so on. Run and photo numbers were added, major detail annotated and then the shingle mosaic was photographed in six sections, (Fig. 6) mosaiced at 7 miles to an inch, and enlarged to 4 miles to an inch. (Fig. 7).
These 1:253 440 (4 miles to the inch) scale photomaps were produced for use as a base for geological, soil, timber, aeronautical, geographical and other maps. The photomaps were prepared from unrectified aerial photographs controlled by slotted template plotting based generally on astronomical fixations. (NMO 1955 Map Catalogue).
SLOTTED TEMPLATE ASSEMBLY
A photograph is not a map. However, on a near vertical perspective photograph of terrain with gentle slopes, directions from the photocentre to points of detail on that photo can be considered true radial directions. This is the basis of radial line plotting and the Slotted Template Assembly (STA) method of extending control points for mapping from aerial photographs.
In 'Point Selection', photocentres and points of detail, called pass points, tie or wing points, were selected and transferred to the overlapping photos along the run and to the adjoining runs. Ideally, some survey control points were selected as pass points.
In 'Template Making', the photocentre and pass points were pricked through from the photo on to the template material, such as exposed x‑ray film. A hole was punched at the photocentre and slots cut, using a 'Cassella' slotted template cutter, through the pass points and transferred photocentres to represent the radial directions. The slotted templates were annotated with the run number and photo number then trimmed.
'Template Assembly' involved drawing a rectangular coordinate grid at the nominal photo scale, for example 1:46 500, on the assembly base board and plotting the survey control points. Studs were fixed at control points and templates laid between the control points, along the runs and adjoining runs with floating studs at the photo centres and in the slots. The slotted template assembly (STA) was laid flat without strain the positions of the photo centres and pass points were pricked through the holes in the centre of the studs to the base compilation sheets. The templates were taken up, STA positions circled, photo centres labelled and the index to adjoining sheets shown on the drafting film map compilation sheets together with the control points, grid ticks and map sheet corners. (Hocking 1967)
PLOTTING MAP DETAIL
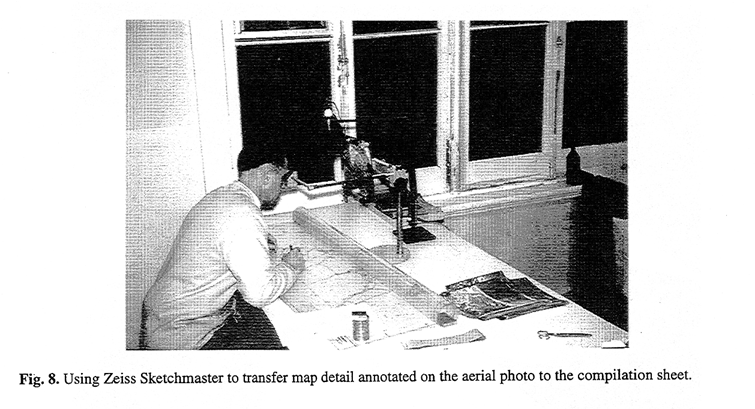
Overlapping photos were viewed stereoscopically and map detail, interpreted, selected and marked up with coloured inks within the lines joining the pass points. Map details were transferred to corresponding positions on the compilation base sheet by 'the shift and trace method' which meant matching the points on the photograph to the STA points on the map compilation base sheet and tracing off the marked up detail. (Salt 1933) It is important to realize that there was more than a 5 to 1 (1:46 500 to 1:253 440) reduction between the compilation scale and the final map scale. Later, Zeiss sketchmasters were used to transfer annotated photo detail to map compilation sheets more quickly and more accurately. (Fig. 8)
Some indication of the elevation of the terrain was given by plotting spot heights derived from aneroid barometer readings in the field. The spot heights were obtained about every four miles (one inch on the map) along roads, tracks, at creek crossings, homesteads, aerodromes, high ground etc. (Hocking 1985)
The 1:253 440 Planimetric Series was drawn on the Transverse Mercator Projection in zones 5 degrees wide with origins at intersections of parallel of latitude 34ºS with the Central Meridian of each zone. These planimetric maps were produced for some special priority areas of Australia, showing all types of natural and cultural features, including railways, roads, tracks and towns. Relief was indicated by spot heights and hachures. (NMO, 1955 Map Catalogue)
TOPOGRAPHIC MAPPING
'Precise' Slotted Template Assembly (STA) for 1:100 000 Planimetry
A most significant improvement occurred in 1960 with the introduction of the super wide angle, Wild RC 9 camera taking 1:80 000 scale photos which meant that less than 200 photos (stereomodels) covered a 1:250 000 map area compared with the 600 needed with K17 photo coverage. During the 2 or 3 years transition from K17 to RC9 photos an obvious disadvantage was that photo interpretation of map detail was more difficult on the smaller scale 1:80 000, RC9 photography. However, most Natmap operators were well experienced and soon able to cope with the smaller photo‑scale.
Film diapositives (0. 10 mm. thick) were printed using a U4A projection printer fitted with a 7000 metre flying height correction plate for earth curvature, air refraction and RC9 lens distortion. Point marking was done using 8x or 10x magnification stereoscopes and either orange 'Letraset' or black 'Mecanorma' rubdown dot and circle point marks to avoid pricking or drilling holes in the film diapositive.
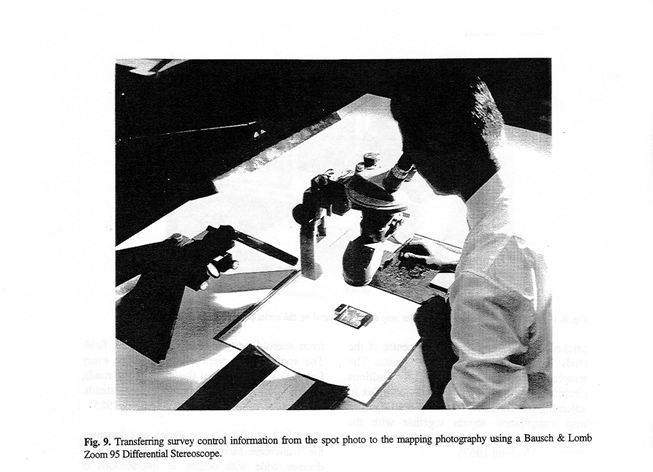
Spot photos of control points were available to allow positive identification of survey control on the diapositives. To obtain spot photos, the control points were marked on the ground, then using a Hasselblad camera near vertical photos were taken at 500, 1500 and 3000 feet above ground. Using a Bausch and Lomb Zoom 95 Differential Stereoscope the control was then transferred from the larger to the smaller scale photographs which provided an accurate position on the mapping photos of the control point. (Fig. 9) This technique was a vital requirement in order to maintain map accuracy.
Control for 1:100 000 mapping was based on the Australian Geodetic Datum 1966. However, in the period leading up to the adoption of AGD66 a provisional datum based on the '165' figure (semi‑major axis 6 378 165 m) compared with the adopted '160' m provided coordinates sufficiently accurate for 1: 100 000 scale mapping.
Control point density was ideally half a degree around the perimeter with one degree spacing of control within the block. However, the control point density usually averaged between a half and one degree network of geodetic control (Ford 1979) and airborne Tellurometer 'Aerodist' control. (McMaster 1980)
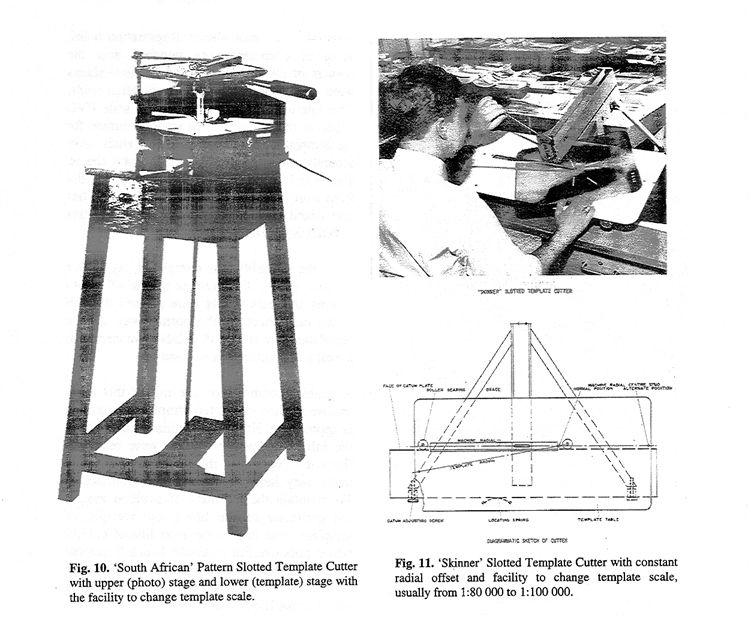
Using the 'South African' pattern slotted template cutter, normal templates were made from 0.35 mm thick white 'Flovic' blanks with a pre‑punched centre hole. (Fig. 10) Azimuth templates were made from 0.35 min thick clear 'Cobex' using the 'Skinner' constant radial offset slotted template cutter. The 'Skinner' cutter facilitated changing the template scale, usually from 1: 80 000 to 1: 100 000. (Fig. 11) Azimuth templates were used to reduce the bowing of a run of templates by bridging with the direction of the photo centre 2 photos distant marked on every second photo. This was done by using the second of three successive photos and accurately transferring the photo centres of the first and third photos to the middle photo. These transferred image points were joined with a fine line and image points along this line transferred to the first and third photos. Then on the first and third photos a line was drawn radially from the photo centre points through these marks. Every second template was an azimuth template and every other a scale template. (Gamble 1950) This technique is analogous to strengthening azimuth in a survey traverse by reading the angle at station 1 to 3 and at station 3 to 5.
Stereo templates were used occasionally to locate templates firmly at control, to get a strong fix on a control point; for example, where the control point was close to the base line and a strong radial intersection was not possible. The stereo templates were prepared from stereo instrument plots of a relatively oriented model of overlapping photos, thereby transforming the perspective projection to a parallel projection with the pass points and control point plotted at approximately STA scale. These points were pricked through to two sheets of 'Flovic' and, using the Zeiss Radial Secator RS1, slots were cut from diagonally opposite pass points used as radial centres and a (double) stereo template prepared.
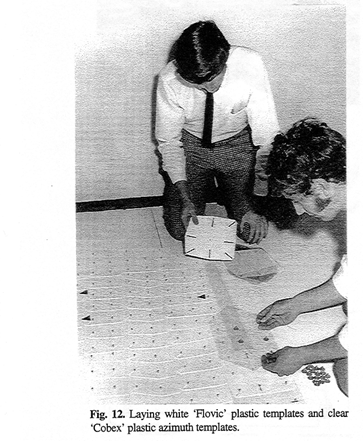
Base sheets and overlay sheets were 0.1min double‑matte 'Ozatex' pre‑printed with standard marginal information for 1: 100 000 manuscript mapping. Grid intersections, 10 minute graticule intersections, control points and register holes were plotted using the 'Decograph' coordinate plotter. Contour and vegetation overlays were prepared as plain sheets of the same size and material as the base sheets. Registration holes, 4mm in diameter, were punched near the corners of all base sheets and the base sheets were joined together with 2 registration studs. The internal edges were covered with PVC adhesive tape to provide a smooth surface for the templates to slide on. Control studs were securely stuck in position on the base sheets. The templates were assembled systematically from west to east and north to south. Coast ties and island runs were added when W‑E runs covered the coast. (Fig. 12).
After the assembly was completed, laying flat without strain, the stud positions of photo centres and pass points were pricked through to the base sheets in the normal way. As the templates were lifted, all points were circled in pencil and identified as necessary.
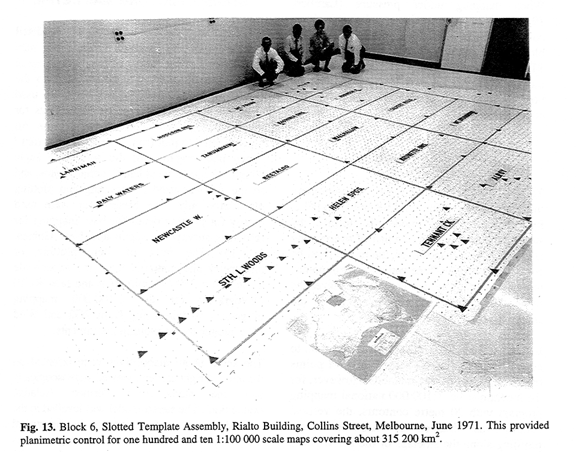
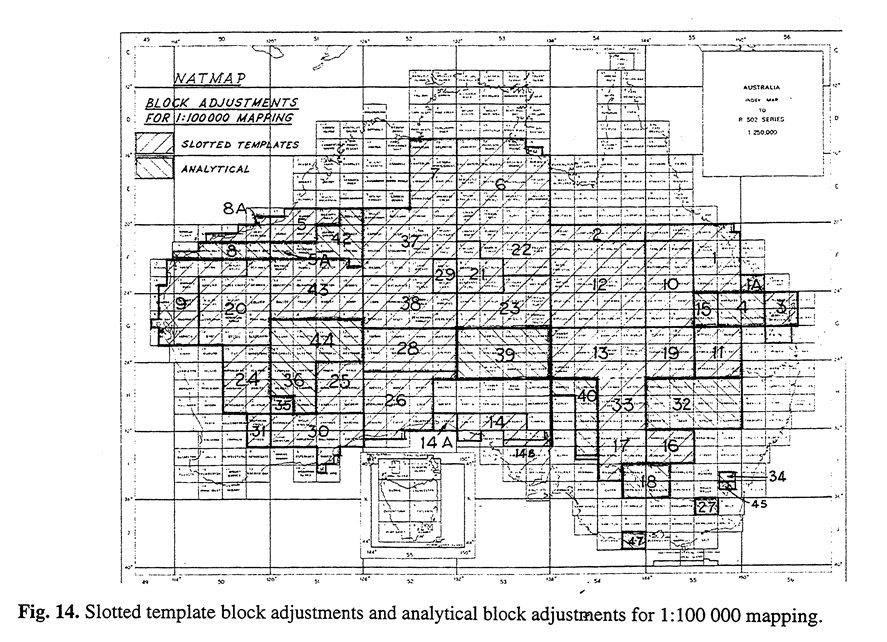
A general comment on the use of this more precise method of slotted template adjustment is appropriate. Natmap recognized that most of the inland undeveloped areas were relatively flat with slopes less than 5 degrees and laid many very large blocks of slotted templates. To maintain the accuracy of position around the perimeter of the block, an overspill of templates was laid to the next line of control where possible. For example, Block 6 covered 19 x 1:250 000 areas or 110 x 1: 100 000 areas of the Northern Territory. (Fig. 13) Some statistics for Block 6 are:
|
|
Block 6 |
Overspill |
Total |
|
No of templates |
3076 |
704 |
3780 |
|
No of studs |
6250 |
1450 |
7700 |
|
plus control studs |
130 |
|
|
|
plus register studs |
220 |
|
|
|
|
|
|
|
|
Area |
315 000 sq. km. |
|
379 200 sq. km. |
It is interesting to compare the Block 6 area with the combined area of the states of Victoria and Tasmania which is approximately 300 000 sq. km. (Some of these comments on Block 6 STA are based on a 1971 report by Mr. R.G. Foster, Supervising Draughtsman. Bob, who unfortunately died recently, was the acknowledged expert on precise slotted template adjustments in Natmap).
When mapping under pressure (Lambert 1963), and before massive number‑crunching computers were available for large analytical block adjustments, there was a lot in favour of STA block adjustments of 2000 to 3000 models, with direct transfer of the minor horizontal control positions to the base map compilation sheets. (Fig. 14)
VERTICAL CONTROL
To plot map detail using stereo‑plotting instruments, such as the Wild B 8 and Kern PG 2, in which a virtual model is formed by stereoscopic observation of a pair of overlapping aerial photo film diapositives, the model must be levelled and scaled. Three vertical control points, not in a straight line, are necessary to level the model, and two horizontal control points are needed to set the correct scale.
In large scale project mapping it is common to establish the individual vertical control points by direct ground survey methods. However, for the medium scale, 1:100 000 national mapping program with 20 metre contours, the vertical control was obtained by airborne terrain profiling along the sidelaps of the aerial photo coverage and this provided vertical control in every model. Selected key runs were flown over photo‑identified 3rd order level benchmarks and the east‑west profiles adjusted to the level network.
Approximately 200 000 km of radar terrain profiling was obtained under contract by Adastra Airways during 1967‑72 from 3000 m above ground to avoid turbulence. The radar sampled an area about 50 m in diameter which was considered satisfactory at that time in desert areas of low relief. A similar amount about 205 000 km of laser terrain profiling was flown by Adastra during 1971‑75, also from 3000 m. This sampled a much smaller area, about 1‑2 metres of the ground.
The reductions and adjustments were done by Natmap personnel and it was remarked that 'enough profiling tapes had been processed to encircled the earth 5 times'! (Wise 1979)
STEREO‑PLOTT1ING MAP DETAIL
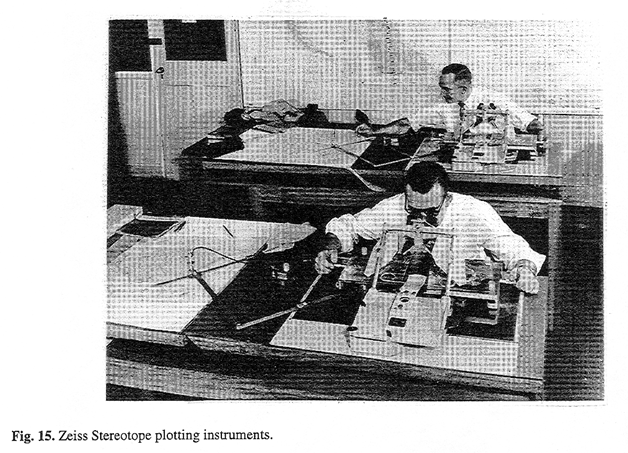
In the 1950‑60s the stereo‑plotting of map detail was carried out by photo‑interpretation of map detail from a stereo‑model of overlapping aerial photos and transferring selected detail to the map compilation sheet. Initially, Natmap used Wild A6 and Zeiss Stereotope instruments for stereo‑plotting map detail. However, the A6 was designed to plot from wide angle 150 min / 6 inch photography, not the superwide angle 88 mm / 3.5 inch focal length aerial photos, and so the A6 was used for training and plotting planimetry only. The Stereotopes were used mostly for plotting detail for base mapping for resources surveys in Papua and New Guinea. (Fig. 15) The bulk of stereo‑plotting of planimetry and contours from the super‑wide angle 230 x 230 / 88 mm RC9 and later RC10 photography for the 1: 100 000 mapping program was done using Kem PG2 and Wild B8 analogue stereo‑plotting instruments.
The aerial photo diapositives were oriented on the left and right carders, viewed stereoscopically and the stereo‑model formed (relative orientation). The stereo‑model was levelled to the vertical control and scaled to the horizontal control (exterior orientation). A pantograph was used for changing from model scale to the plotting scale of the map compilation sheet.
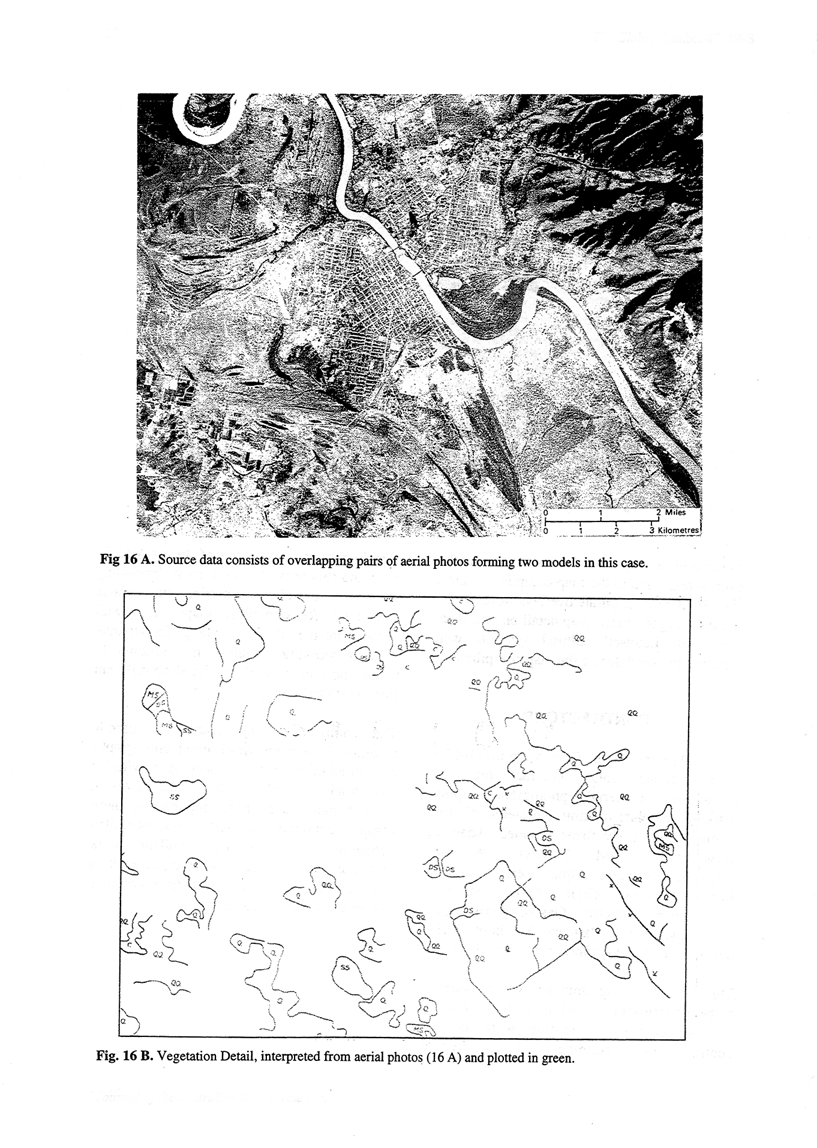
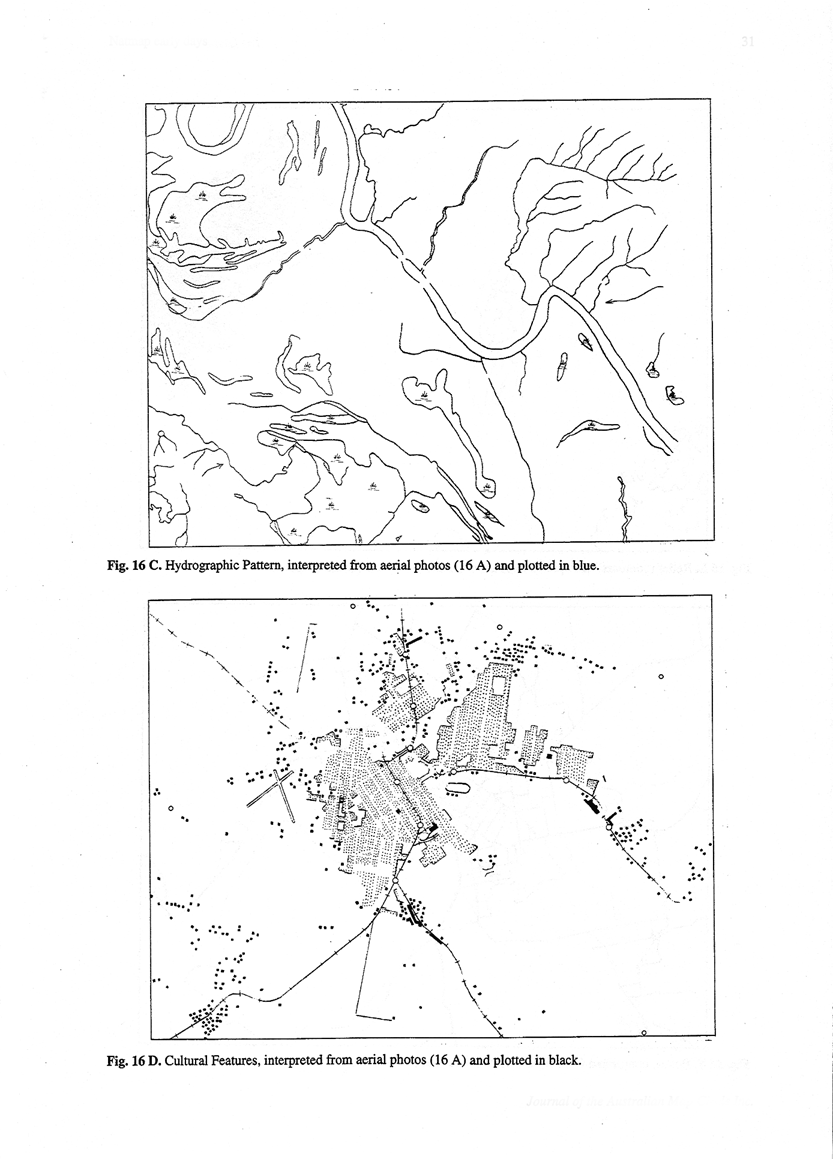
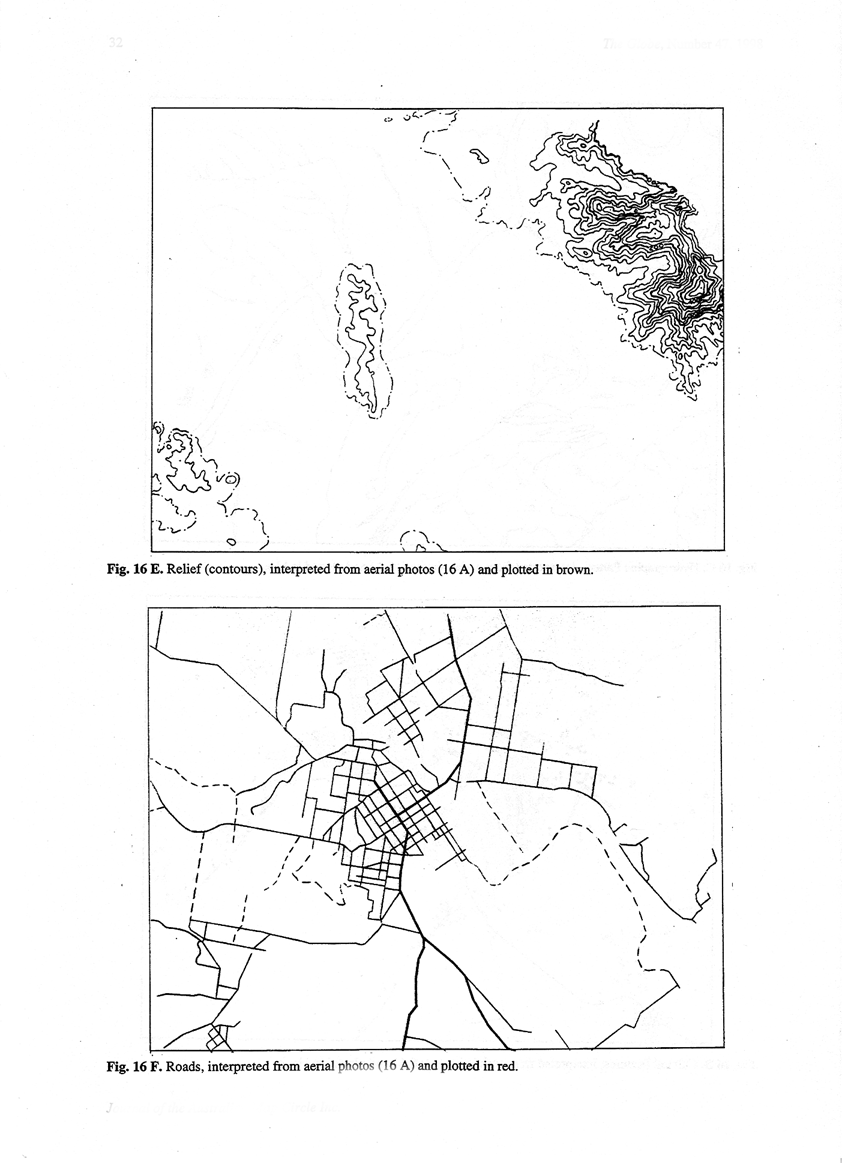
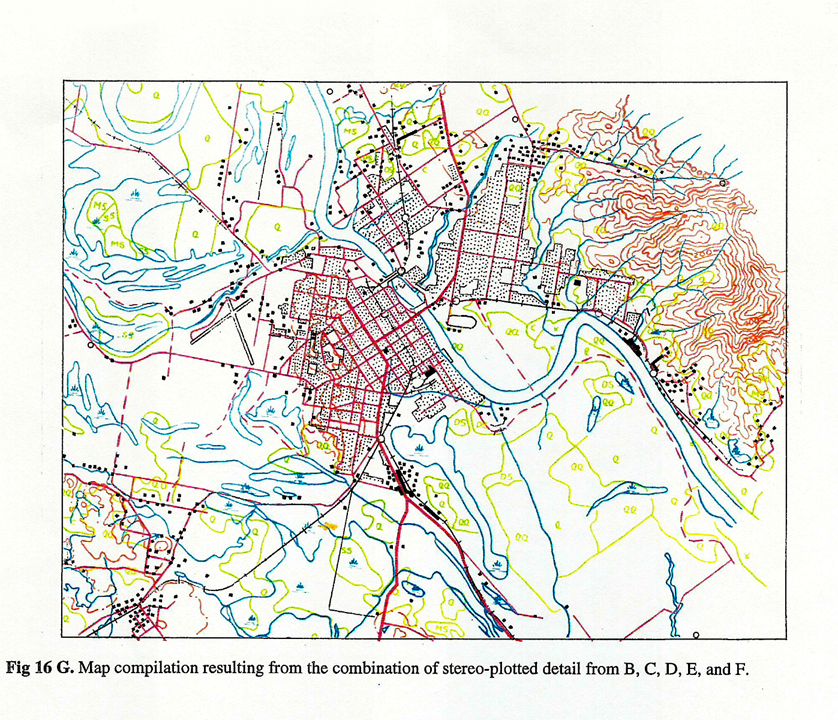
Selected planimetric detail was plotted by placing the index floating dot mark in the stereo‑model on to the detail, and plotting that detail by lowering the ball point coloured ink pen on to the compilation sheet. The colours used were: blue for watercourses, lakes and other water features, red for roads, tracks and so on, and black for railways, buildings etc. Contours at 20 metres plus the odd numbered 50 metres required for the 50 metre interval on the 1:250 000 series were plotted in brown on an overlay registered to the map compilation sheet. The index mark was set at the required contour level and kept in contact with the stereo‑model and that particular contour plotted on the overlay, the index mark then fixed at the next contour level, plotted and so on. Spot heights were used to assist with the interpretation of the terrain. (Hocking c.1967)
Vegetation was plotted in green on another overlay registered to the map compilation sheet. (Fig. 16, A to G) Separate overlays were used to avoid having too much map detail on one sheet. Sheets of 'Letraset' cultural symbols were prepared and used during the map compilation.
CONTRACTORS
Up to 20 private sector firms were involved at various times, under contract on such operations as aerial photography, point marking, template making and stereo plotting of map detail. These firms included: Adastra , Geosurveys, AAM Surveys, Watsons, Associated Surveys, Alpha Aerial Surveys, Aerial Surveys, Civil Aerial Surveys, Photomappers, Photec, Qasco, Aerometrex, P. Livings, Pike & Partners, Southern Aerial Surveys, GH&D, GeoSpectrum, and others.
The contract photogrammetry was considered to be a successful operation for both Natmap and the contractors. Putting work out to contract forced Natmap staff to prepare unambiguous specifications of the work to be done and this proved to be a most demanding yet useful exercise in sorting out various procedures for compiling maps. It is well known that it is difficult enough for separate sections working in the same building to follow the same procedures, let alone different firms scattered all round Australia.
The contractors' staff learnt to compile medium scale maps from aerial photographs and, in addition, contract mapping provided a base load of work for the firms involved. Further more, and most importantly, these mapping contracts increased the pool of skilled people available to do map compilation work in the event of a national emergency. It is worth noting that many of these firms continue to operate in the private sector.
ACKNOWLEDGEMENTS
1 wish to thank the people who helped me remember. However, memory fades and any errors are mine. Clive Freegard worked wonders with the old photos. Keith Barrie, Kevin Crane and Alan Thomson kindly read the paper and suggested improvements. My wife, Iris, an exNatmapper, sorted out the diagrams and so forth. Finally, sincere thanks are due to all the people who worked in the National Mapping Melbourne and Canberra offices during those years, helping to put Australia on the map.
REFERENCES
Ford, R.A. (1979) 'The Division of National Mapping's Part in the Geodetic Survey of Australia', The Australian Surveyor, 1979, vol 29, nos. 6,7 & 8.
Gamble, S.G. (1950) 'A Suggested Improvement in the Slotted Template Method of Controlling Vertical Air Photographs', The Canadian Surveyor, vol x, no. 3.
Hocking, D. R. (c. 1967) 'Notes on Automatic Photointerpretation for Medium Scale Mapping' unpublished.
Hocking, D. R. (1985) 'Star Tracking for Mapping ‑ An Account of Astrofix Surveys by the Division of National Mapping during 1948 ‑ 1952' paper presented at the 27th Australian Survey Congress, Alice Springs.
Lambert B. P. (1963) 'Mapping Under Pressure' paper distributed at the United Nations Conference on Science and Technology, held at Geneva.
Lines J. D. (1992) Australia on Paper ‑ The Story of Australian Mapping, Fortune Publications, Box Hill.
McMaster C. G. (1980) 'Division of National Mapping Aerodist Program' Technical Report. No 27, Department of National Development and Energy, Canberra.
Map Catalogue (1955) First Edition, Compiled by the National Mapping Office, Department of the Interior, Canberra.
Salt, LS.A. Lieut. R.E. (1933) A Simple Method of Surveying from Air Photographs, Professional Papers of the Air Survey Committee No. 8, H.M. Stationery Office, London.
Vincent D. (1982) Mosquito Monograph, David Vincent, Adelaide.
Wise P. J. (1979) 'Laser Terrain Profiling' Division of National Mapping Technical Report No. 26, Department of National Development and Energy, Canberra.
___________________________________________________________________________
Hocking, David Roy (1998), NATMAP Early Days, Map Compilation from Aerial Photographs 1948–1970s, The Globe, No.47, pp.16-33.
Sources
Crum, Shannon (1995), Aerial Photography and Remote Sensing, The Geographer's Craft Project, Department of Geography, The University of Colorado at Boulder.
Hocking, David Roy (1967), Photogrammetric Planimetric Adjustment, Colloquium on Control for Mapping, University of New South Wales 22-24 May, 1967.
Hocking, David Roy (1998), NATMAP Early Days, Map Compilation from Aerial Photographs 1948–1970s, The Globe, No.47, pp.16-33. 16-33.
Lambert, Bruce Phillip (1956), The National Geodetic and Topographic Survey, Conference of the Institution of Engineers (Australia), Canberra, April 1956.
Lambert, Bruce Phillip (1969), Geodetic Survey and Topographic Mapping in Australia, The Australian Surveyor, Vol.22, No.7, pp.515-528.
Lines, John Dunstan (1992), Australia on Paper – The Story of Australian Mapping, Fortune Publications, Box Hill.
McLean, Lawrence William (2019), Personal communications.
Menzies, Roderick William and Wise, Paul Joseph (2011), The 1:100,000 Scale Topographic Mapping Program-Assisted by Technology, paper presented to the 100 Years of Topographic Mapping Conference, held in Canberra during 28-29 March 2011, CD-ROM.
National Mapping Council (1963), Definitions of Terms Used in Photogrammetric Surveying and Mapping, National Mapping Council of Australia, NMP/63/042 (at its 1985 meeting the Council decided to discontinue this publication and instead use the American Society of Photogrammetry's (1984) Multilingual Dictionary of Remote Sensing and Photogrammetry that was edited by Dr George Antonovich Rabchevsky (1936-2005)).
National Mapping Council (1966), Report on Work Completed during the Period 1945-65, Division of National Mapping, NMP/66/24.
National Mapping Office (circa 1950), Instructions for the Guidance of Photogrammetric Draughtsmen : Four Mile Mosaics, internal document.
National Mapping Office (1951), Instructions for the Guidance of Photogrammetric Draughtsmen, internal document.
National Mapping Office (1955), Map Catalogue, First Edition, April 1955.
Rabchevsky, GA (Ed.) (1984), Multilingual Dictionary of Remote Sensing and Photogrammetry, American Society of Photogrammetry, Falls Church: Virginia, USA.
Royal Australian Survey Corps (Unknown), Manual of Photogrammetry and Topographical Draughting : Slotted Templates, internal document.
Survey Directorate GHQ, Middle East (1942), Instructions for the Use of Slotted Template Equipment, Technical Pamphlet No.13, Reprint of the pamphlet by Major DR Crone, OBE, RE, dated 9 November 1942.
Wise, Paul Joseph (2011), Australia’s First 1:250,000 Scale, Uniform Topographic Map Coverage : The R502 Story, 100 Years of National Topographic Mapping Conference, Canberra 2011, Paper 6 on CD-ROM.