The Topographical Map Series of Australia
(sections extracted from Tyson, B.T. (1965), University of Melbourne, revised, edited and updated for website, 2021)
(as a historical 1965 document the word recent herein refers to being available circa 1960)
Preface
Australian topographical mapping was, until 1945, almost entirely the responsibility of the Defence Forces; only in the last dozen years has any sizeable contribution been made by civilian organisations. The post war years saw the creation of the Commonwealth and State civil mapping authorities, and some years passed before a reasonable degree of co-ordination was achieved.
During these years the maps and their makers underwent many changes as the national requirement for all types of maps increased rapidly. These changes resolved gradually into the present national series ranging in scale from 1 : 1 Million to 1 : 31 680, but the technology of surveying, photogrammetry and cartography is still undergoing nothing less than a revolution.
It is surprising therefore that until now, no single work tracing the development of national mapping in Australia has been available, although much has been written in a variety of journals, reports, and official correspondence. With the current awareness in many professions of the significance of national mapping, I hope that this book will prove to be an interesting and useful contribution to the field of Australian cartography.
Acknowledgements
I would like to express my gratitude to the many officers who found time to assist me with the collection of data and material. I am indebted particularly to Mr BP Lambert, Director of National Mapping, for his patient co-operation throughout almost two years of research. In addition, I am most grateful to Brigadier L FitzGerald, OBE, Director of Military Survey 1942 to 1960 - it was due entirely to his encouragement and enthusiasm, that I proceeded with publication of this work.
Department of National Development, Division of National Mapping :
Mr.
B.P. Lambert
Mr. J.D. Lines
Mr. B.E. Goodrick
Mr. D.R. Hocking
Mr. F.A. Wells
Mr. J.A. Yarra
Mr. W. Crocker
Mr. C.S. Tyler
Map Sales Office, Melbourne :
Mr. L. McCraith and Mr. F.C. Aiken
Department of Army, Royal Australian Survey Corps :
Col.
D. McDonald
Major J.K. Nolan
Capt. F.E . Thorogood
Capt.
J. Bullen
W/O1. T. Chisholm
Sgt. D.R. Owen
The Surveyors General :
New South Wales, Victoria, South Australia, Tasmania, Western Australia and Queensland
B. T. Tyson, M. A. , Lecturer,
Department of Town and Regional Planning, University of Melbourne.
15 October, 1965.
|
CONTENTS |
|
|
|
PART I : THE DEVELOPMENT OF NATIONAL MAPPING |
|
|
|
The early history |
|
Mapping between the wars |
|
Mapping during World War II |
|
Post war planning and co-ordination |
|
The present mapping organisations |
|
Development of the post war series : |
|
The first stage 1945-1956 |
|
The second stage 1956-1961 |
|
The third stage 1961-65 |
|
National Topographic Map Series (NTMS) [added 2021] |
|
|
|
PART II : A DESCRIPTION OF THE CURRENT SERIES |
|
|
|
The 1 : 1 Million Australian Geographical Series |
|
The 1 : 250 000 Topographic and Planimetric Series |
|
The 1 : 100 000 Topographic Series |
|
The 1 : 50 000 Topographic Series |
|
The 2 inches to 1 mile scale State Standard Series |
|
|
|
PART III : AN EVALUATION OF THE CURRENT SERIES |
|
|
|
The need for maps |
|
The National Mapping Programme |
|
The map-user survey [deleted 2021] |
|
|
|
|
|
APPENDICES |
|
|
|
1 : Standards of Map Accuracy, National Mapping Council |
|
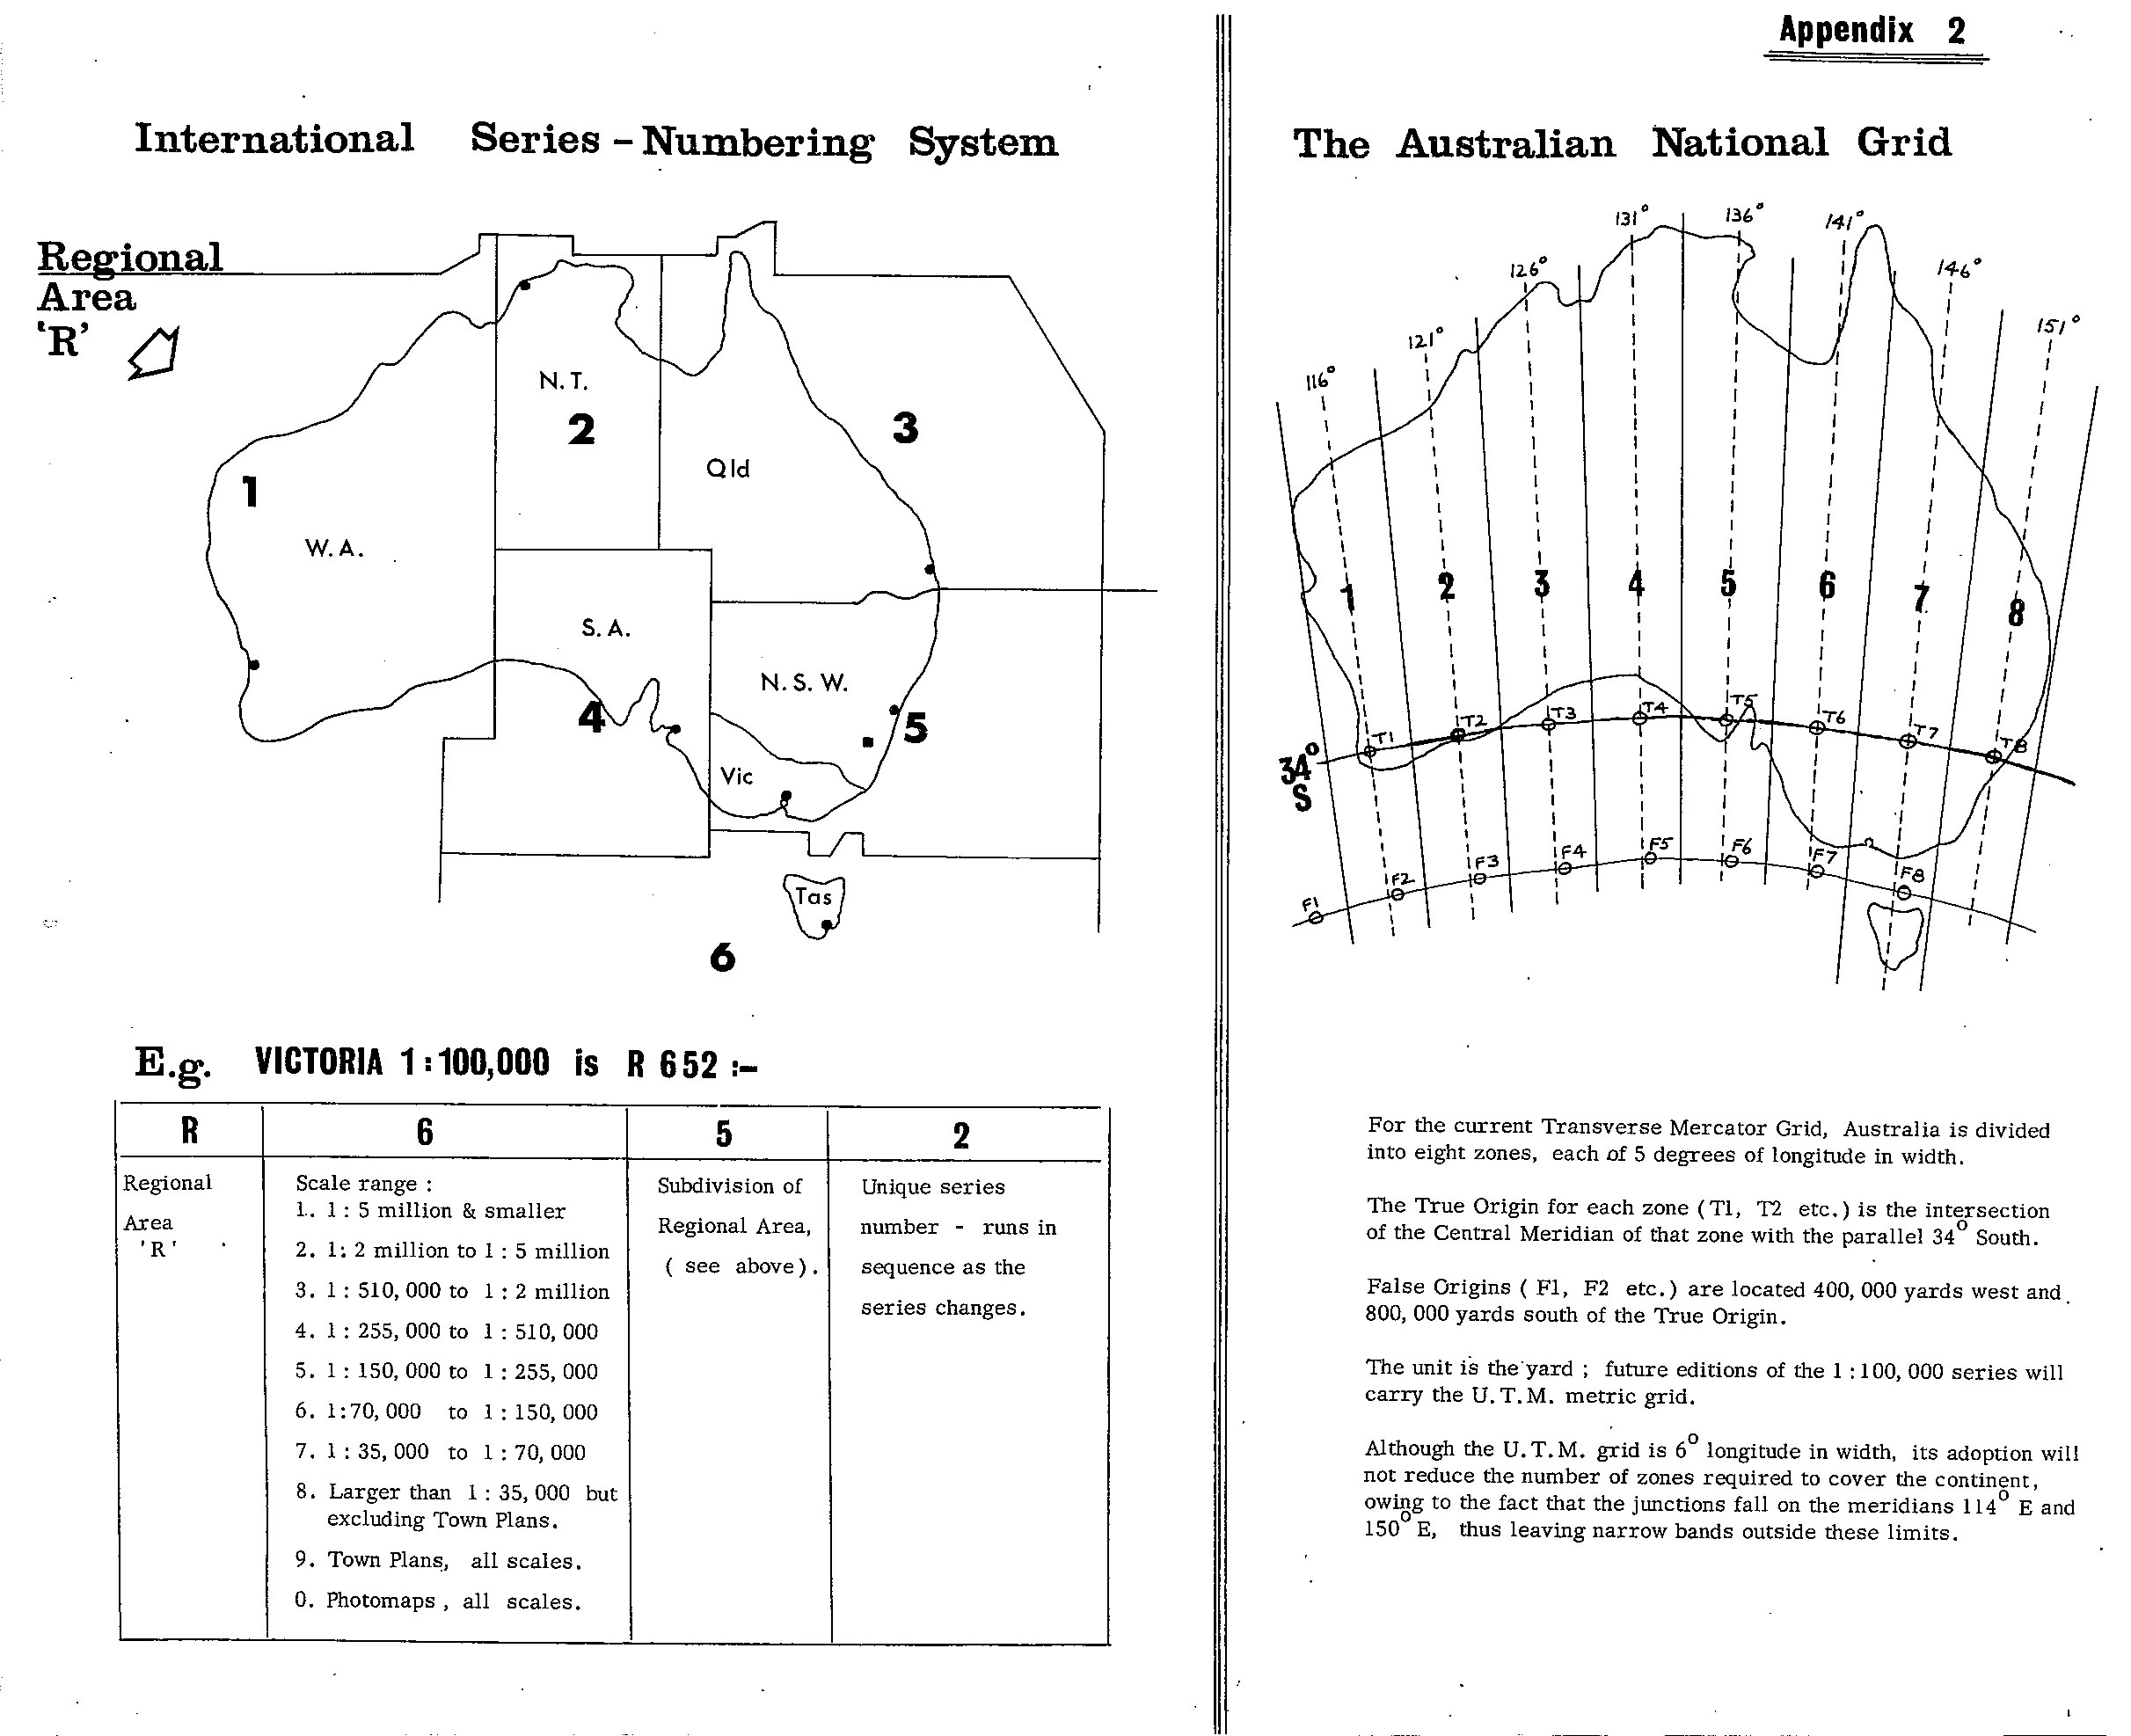
2 : The International Series - Numbering System |
|
: The Australian National Grid |
|
3 : Work-flow chart, Australian Geographical Series |
|
4 : Work-flow chart, Army 1 : 250 000 Series. |
|
5 : Work-flow chart, National Mapping 1 : 250 000 Series |
|
6 : Work-flow chart, NSW 2 inch Standard Topographic Series |
|
|
|
FIGURES |
|
|
|
6 : Time-scale : development of the present series |
|
7a : Extract : post war Army 4 miles to 1 inch sheet, full colour (*) |
|
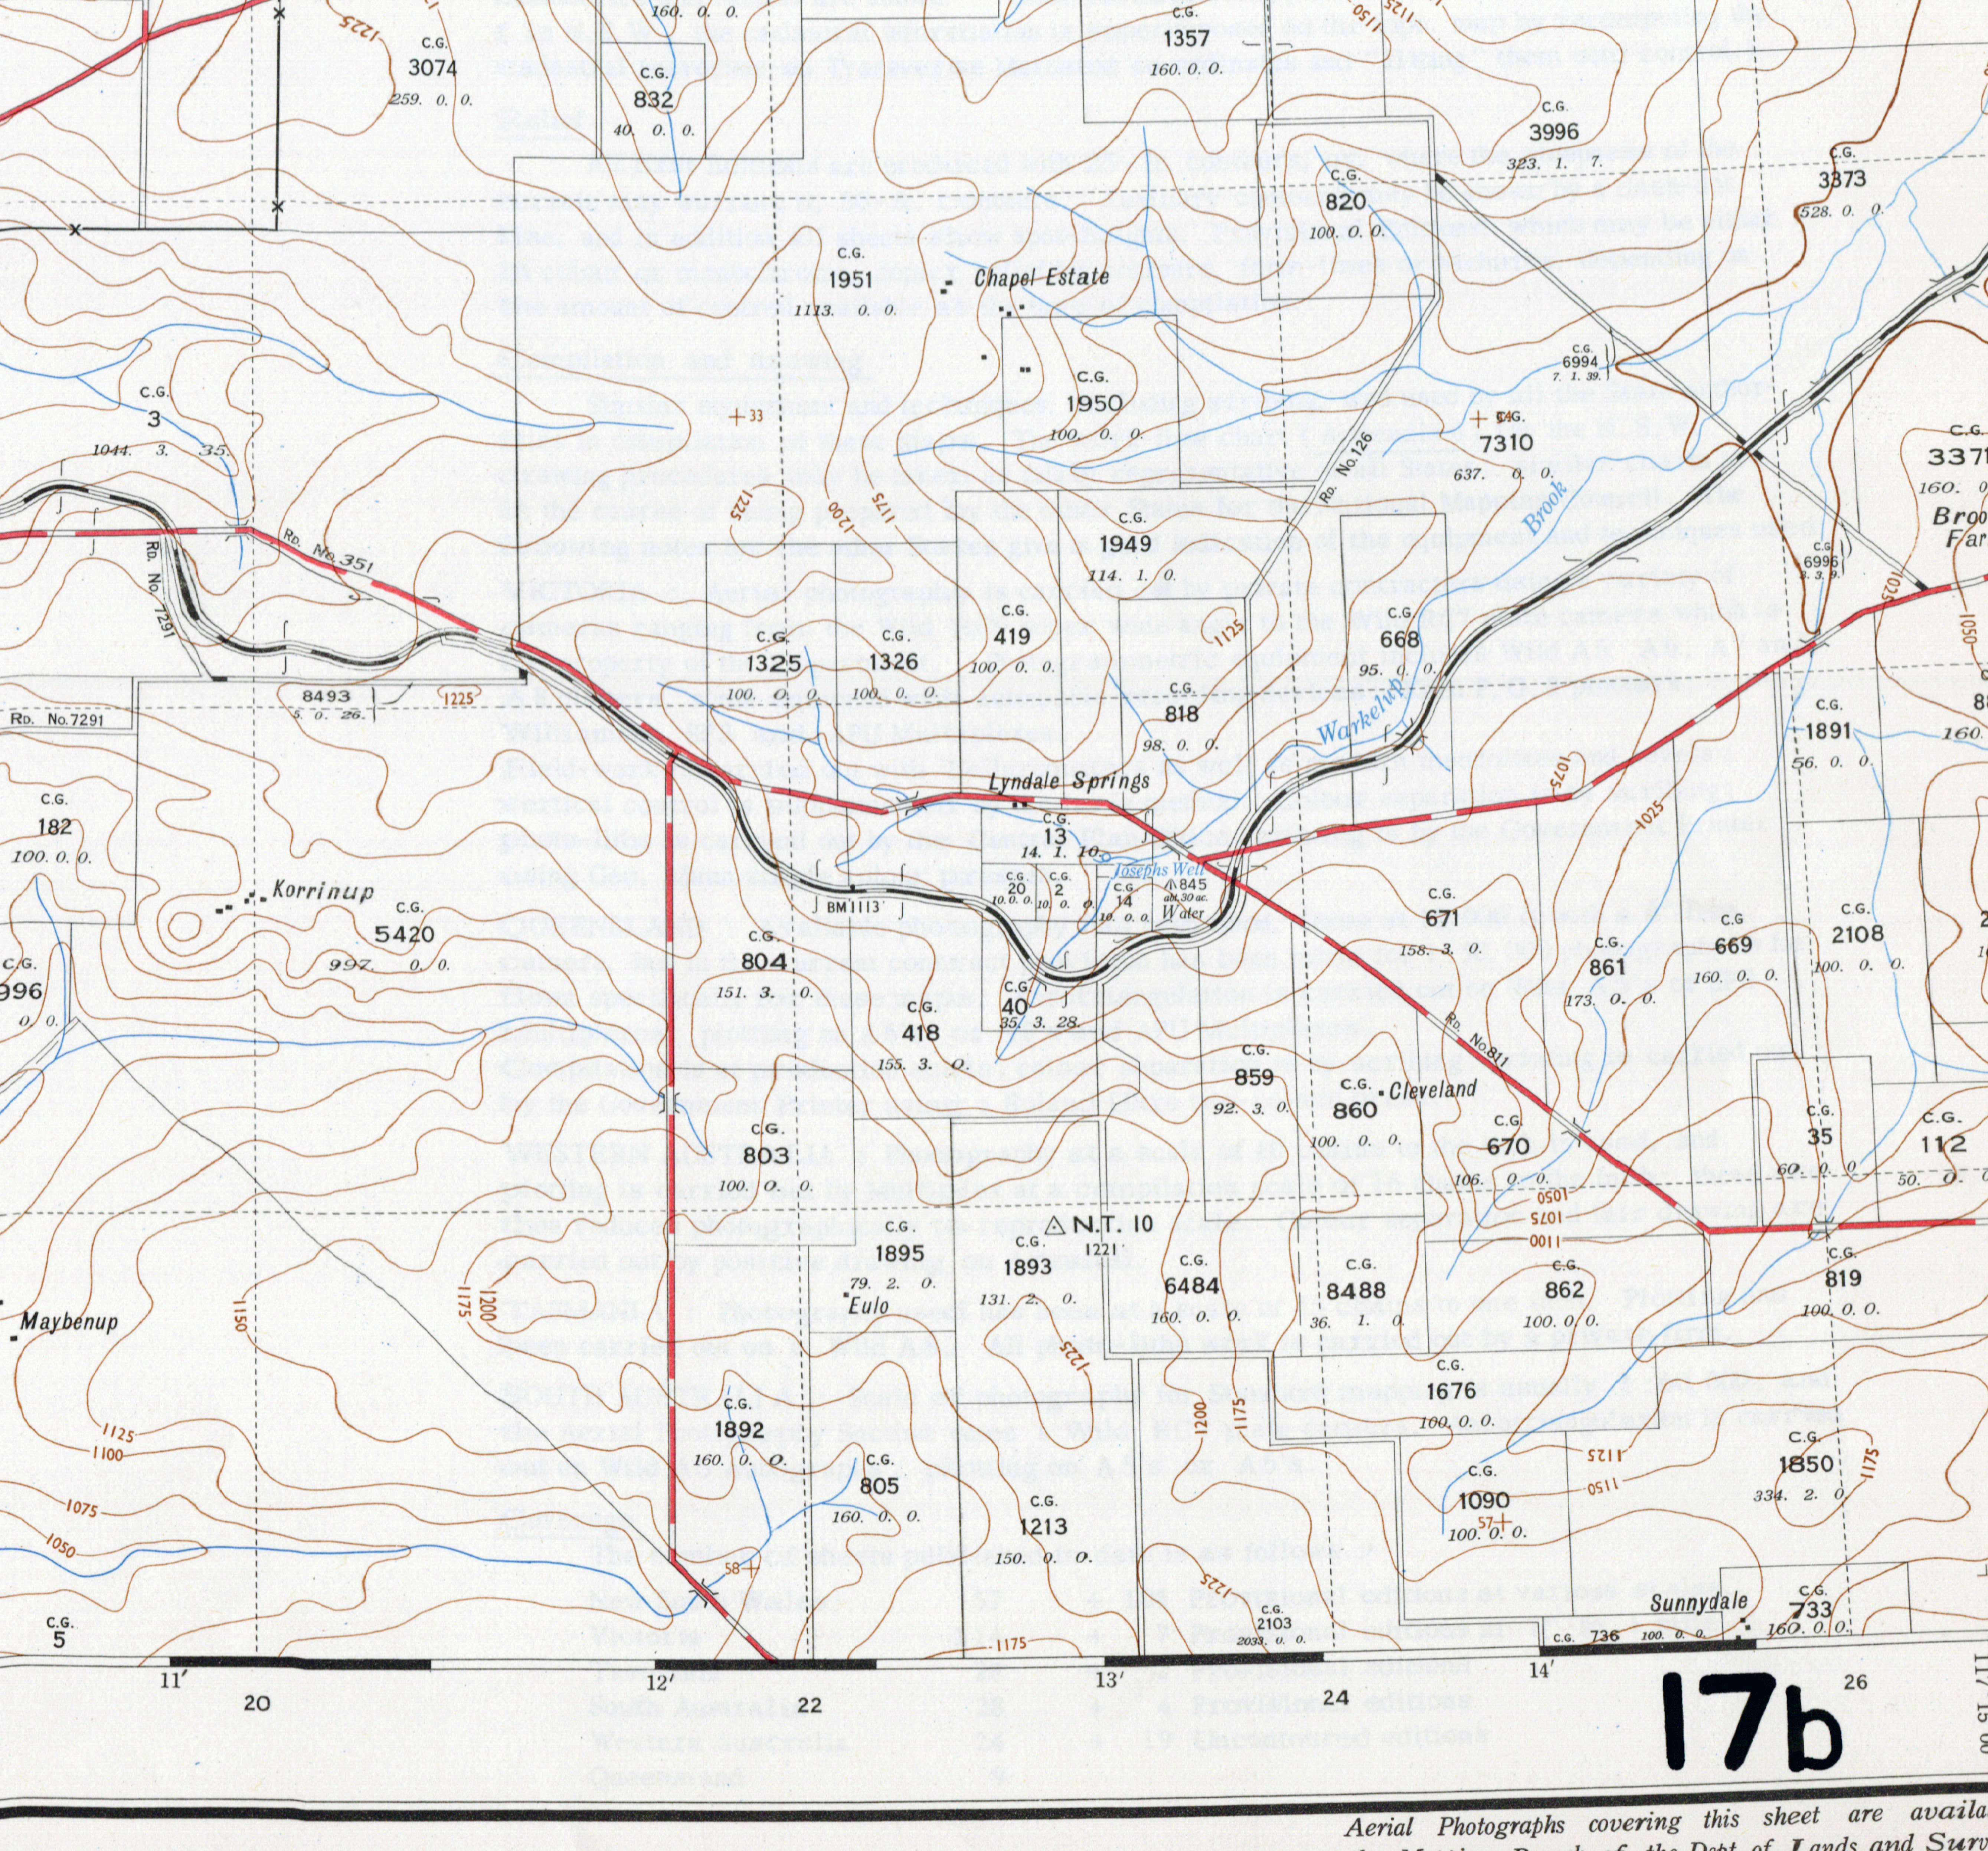
7b : Extract : post war Army 4 miles to 1 inch sheet, black-&-white (*) |
|
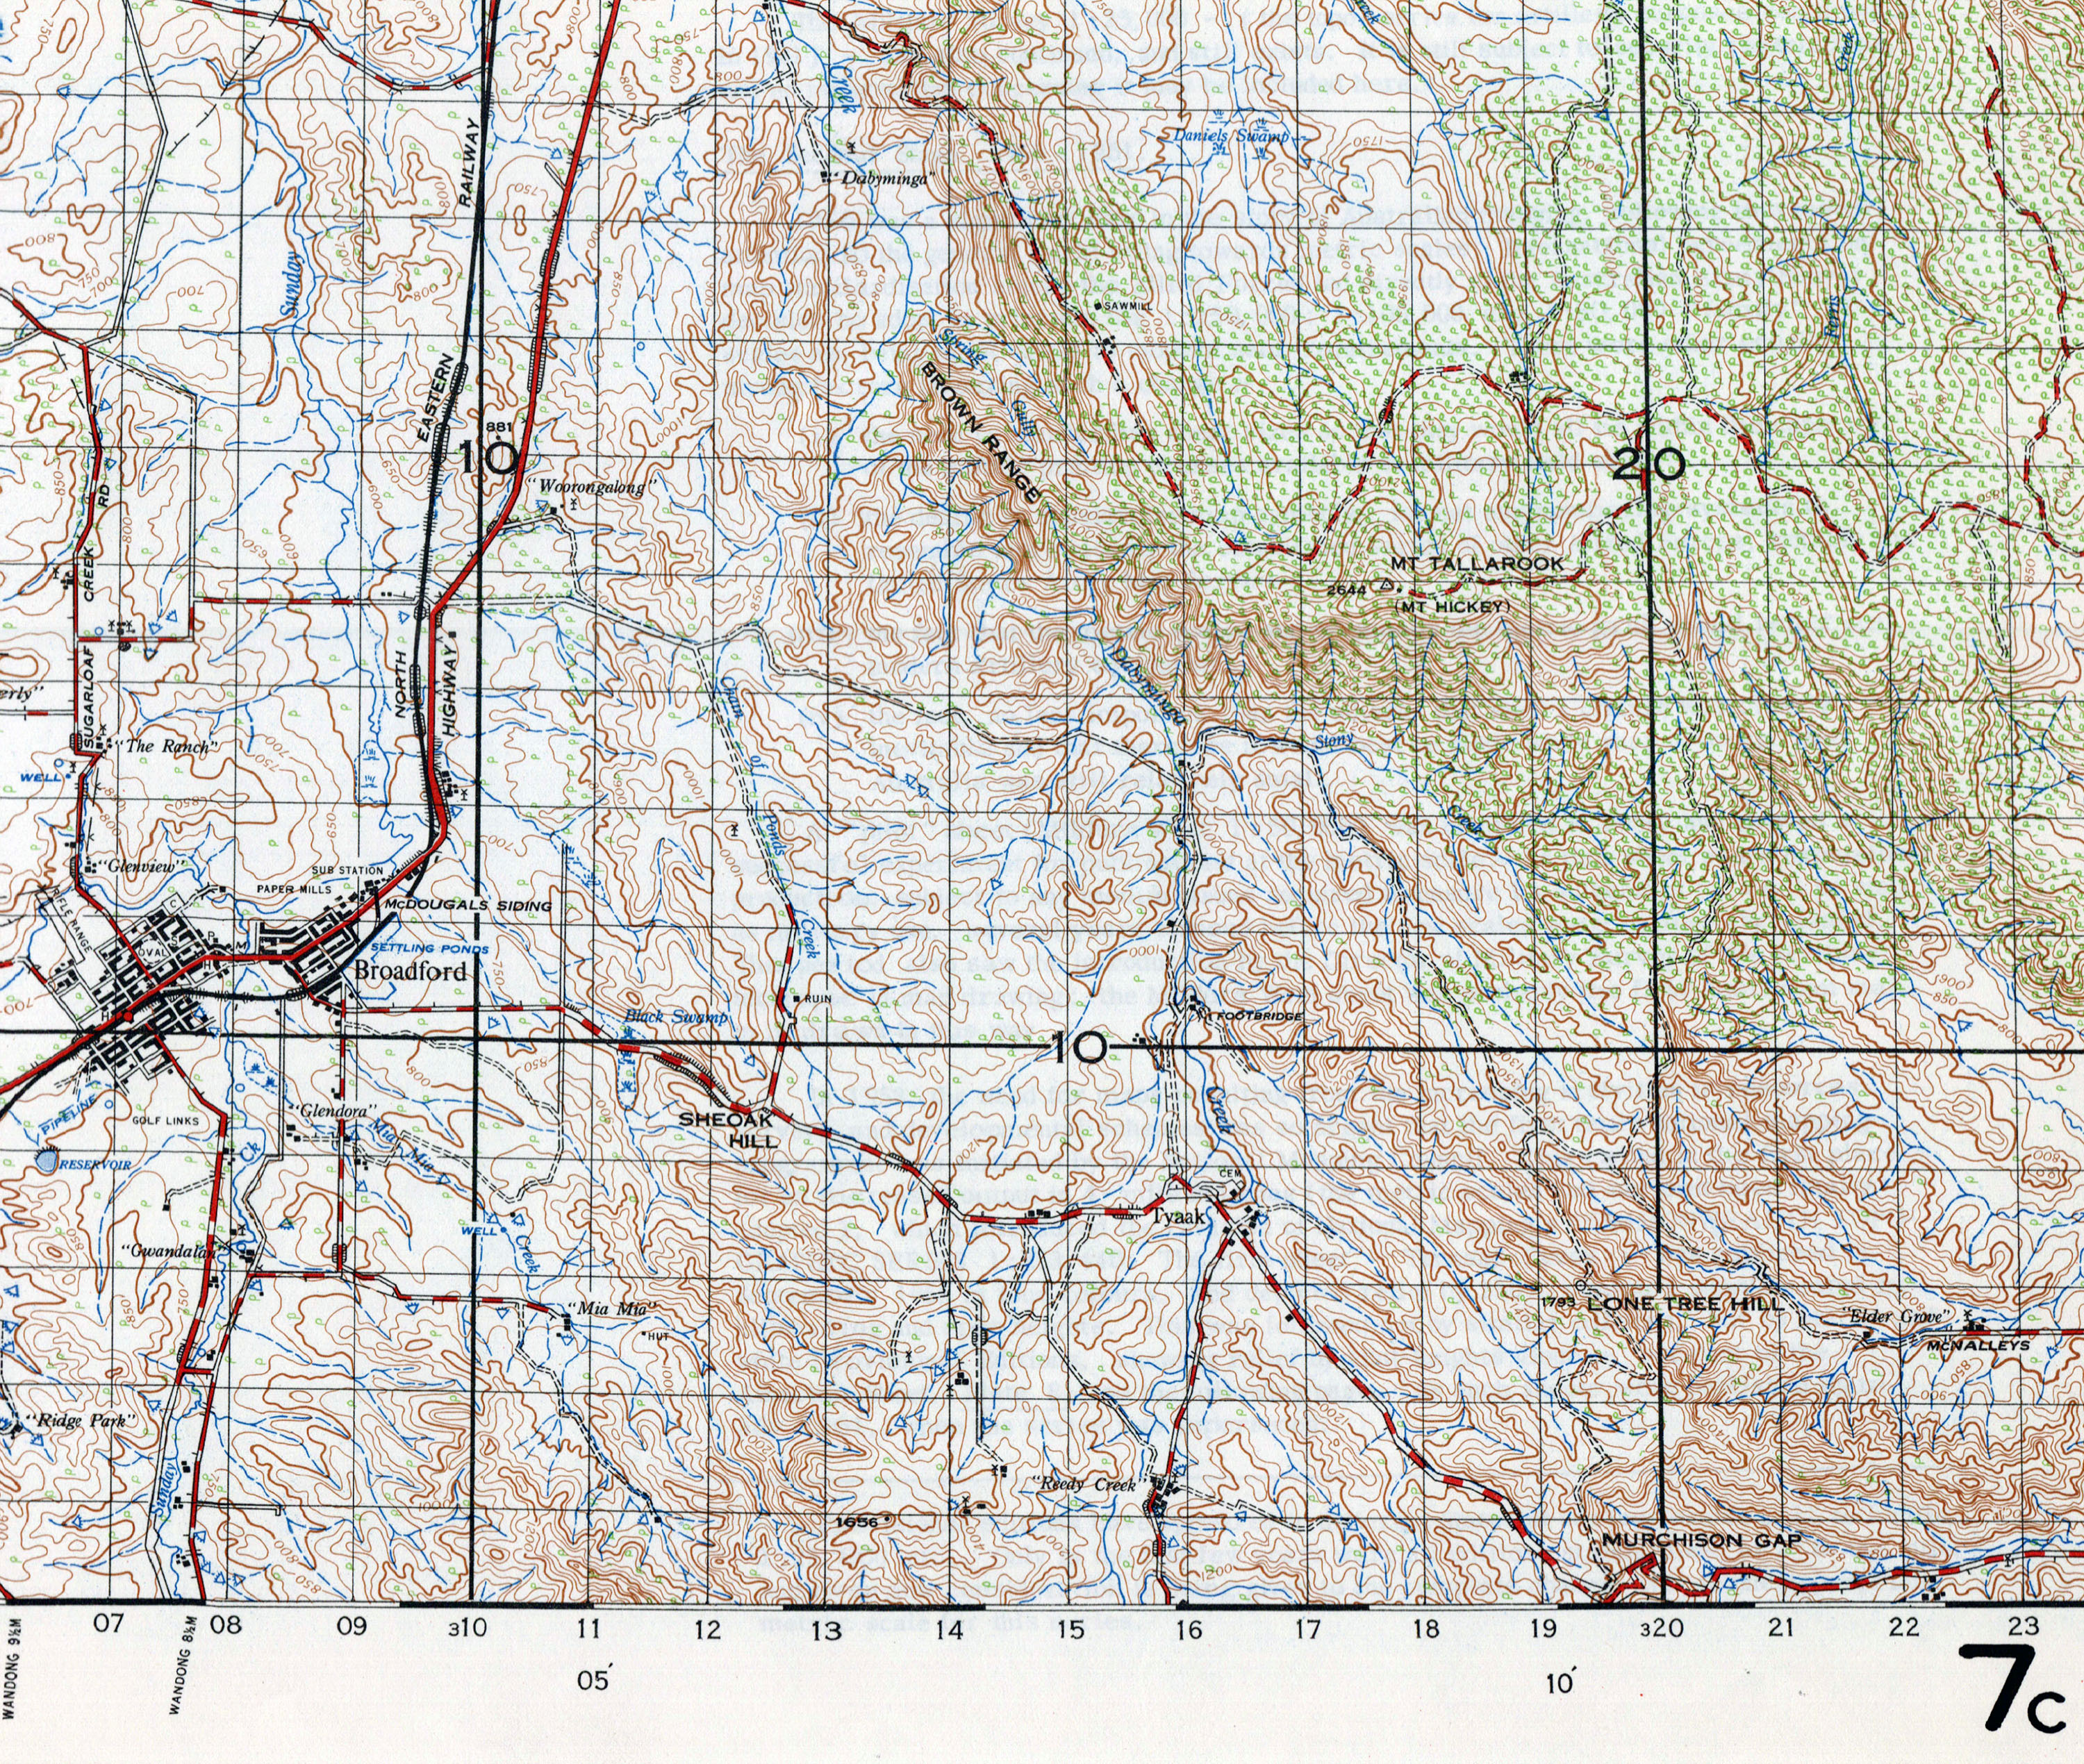
7c : Extract : post war Army 1 mile to 1 inch sheet, full colour (*) |
|
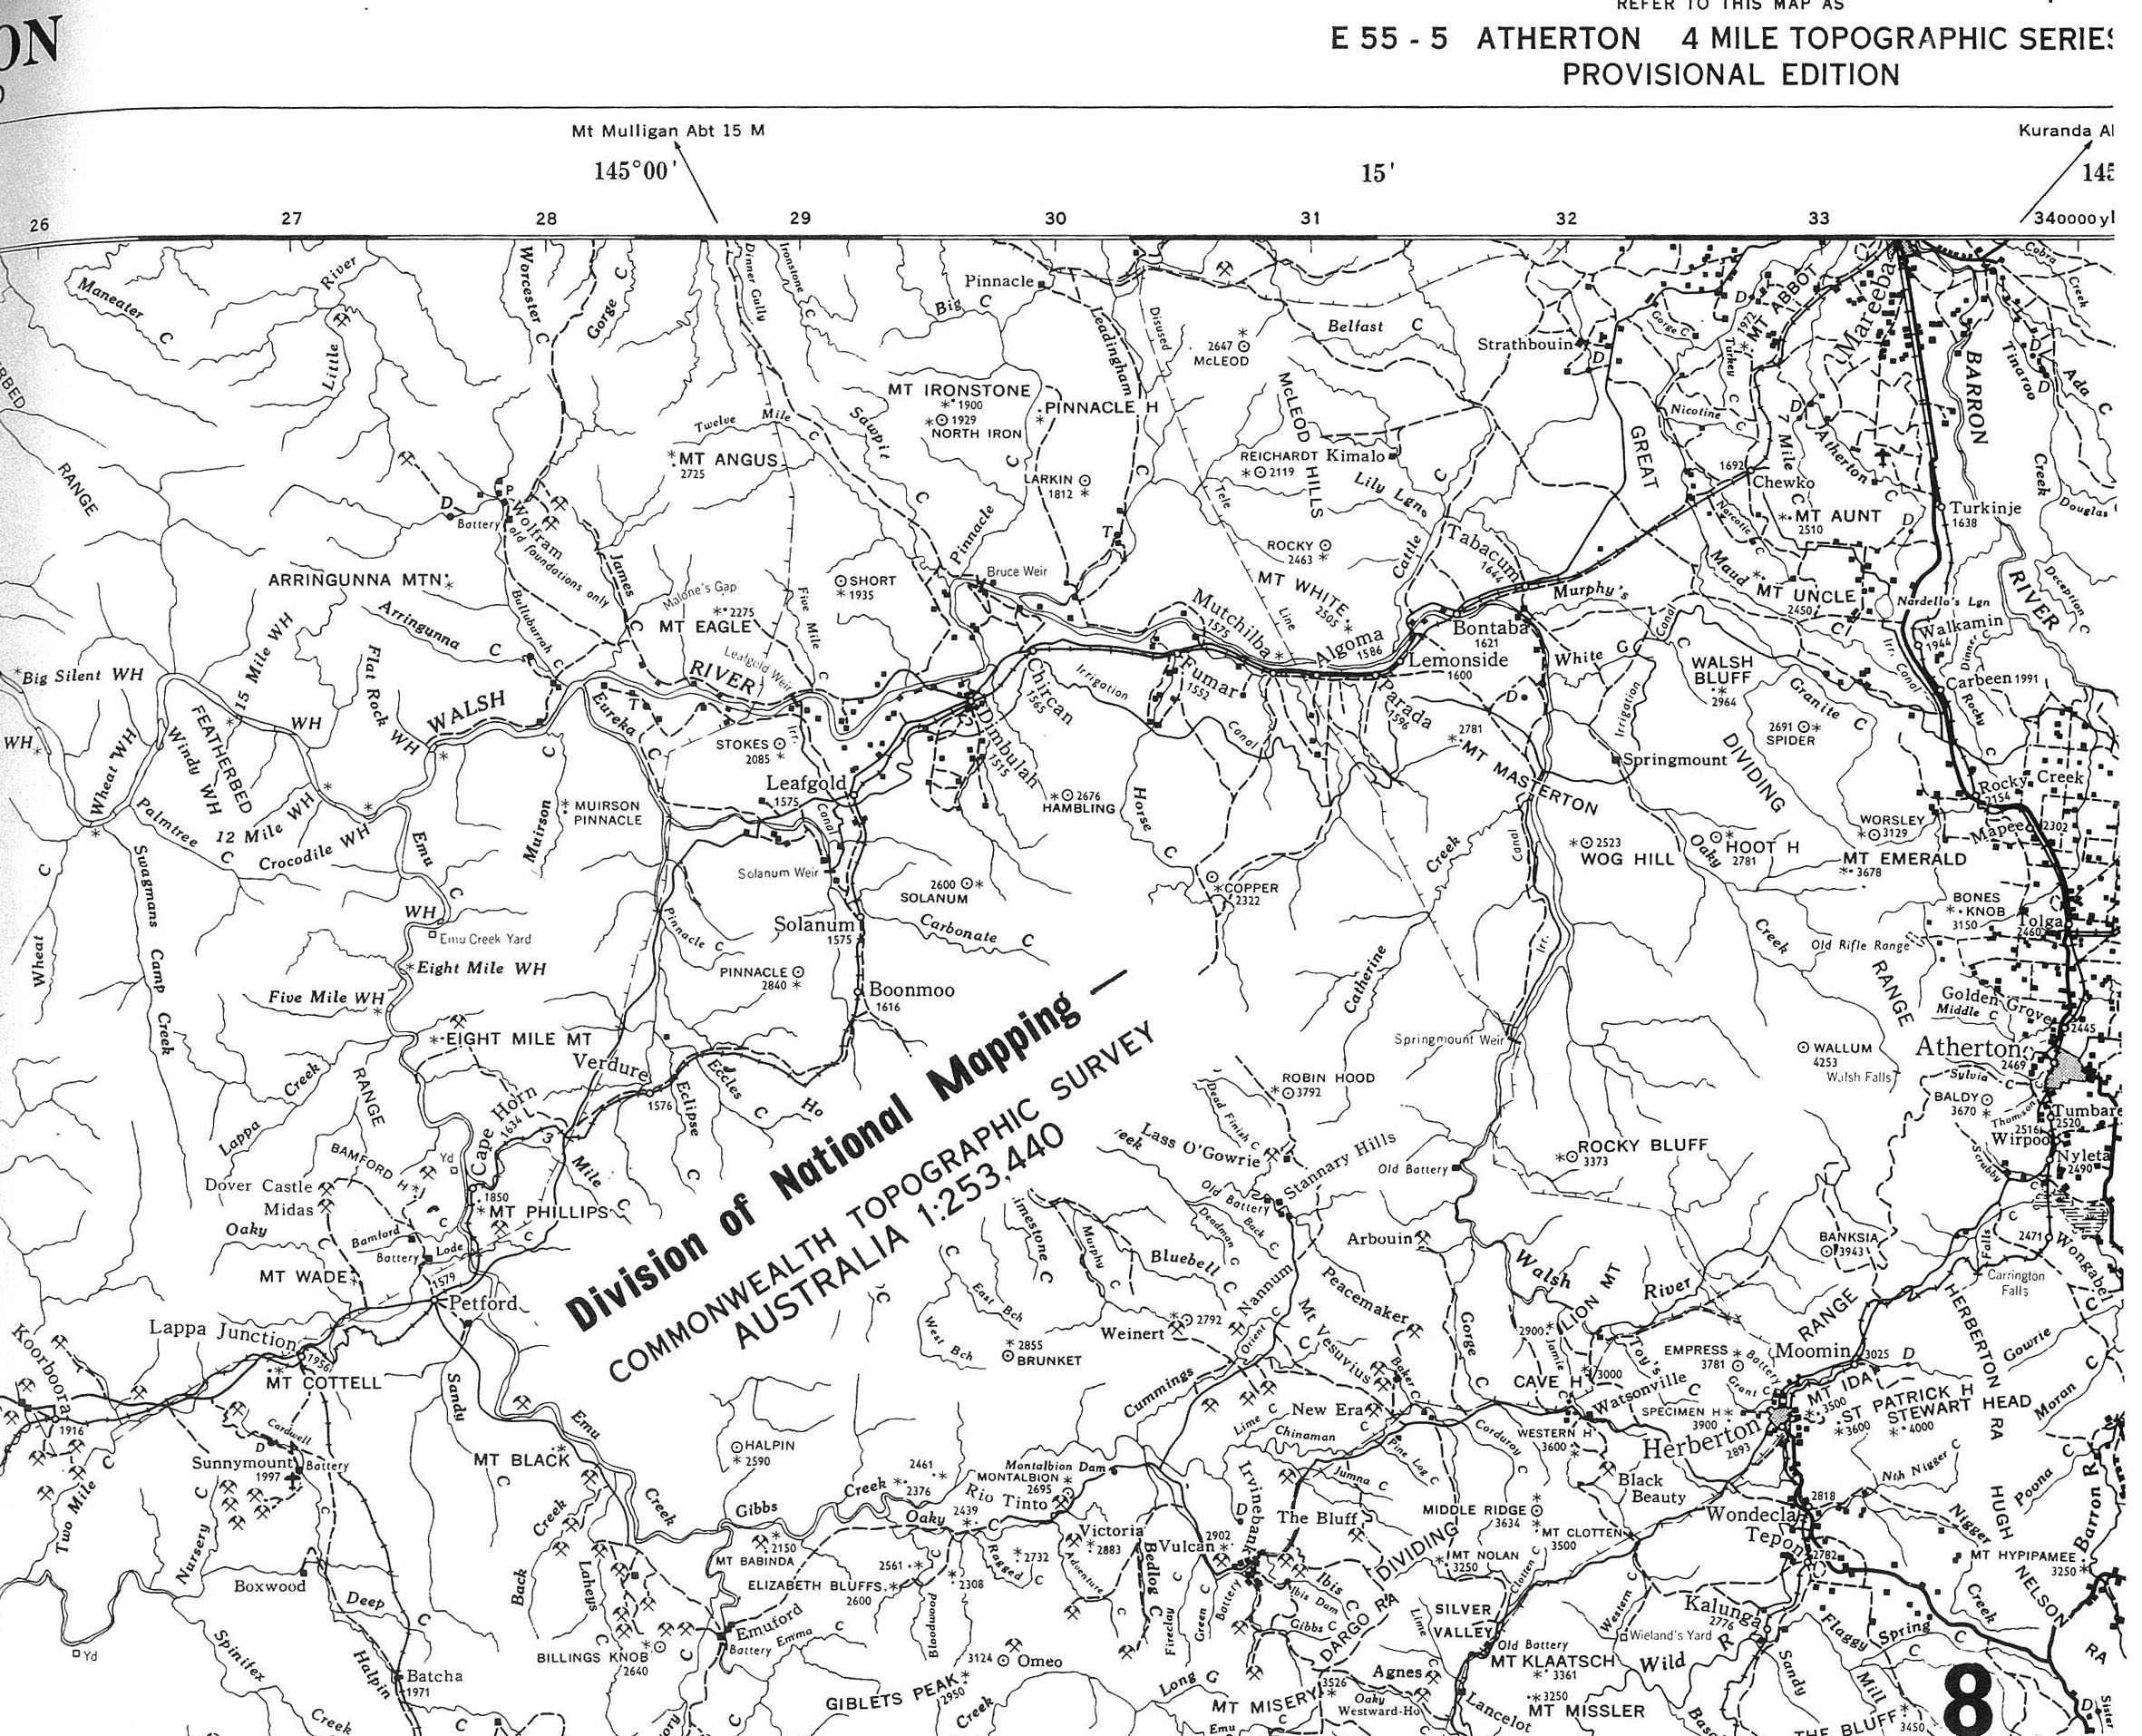
8 : Extract : a Division of National Mapping 4 miles to 1 inch sheet (*) |
|
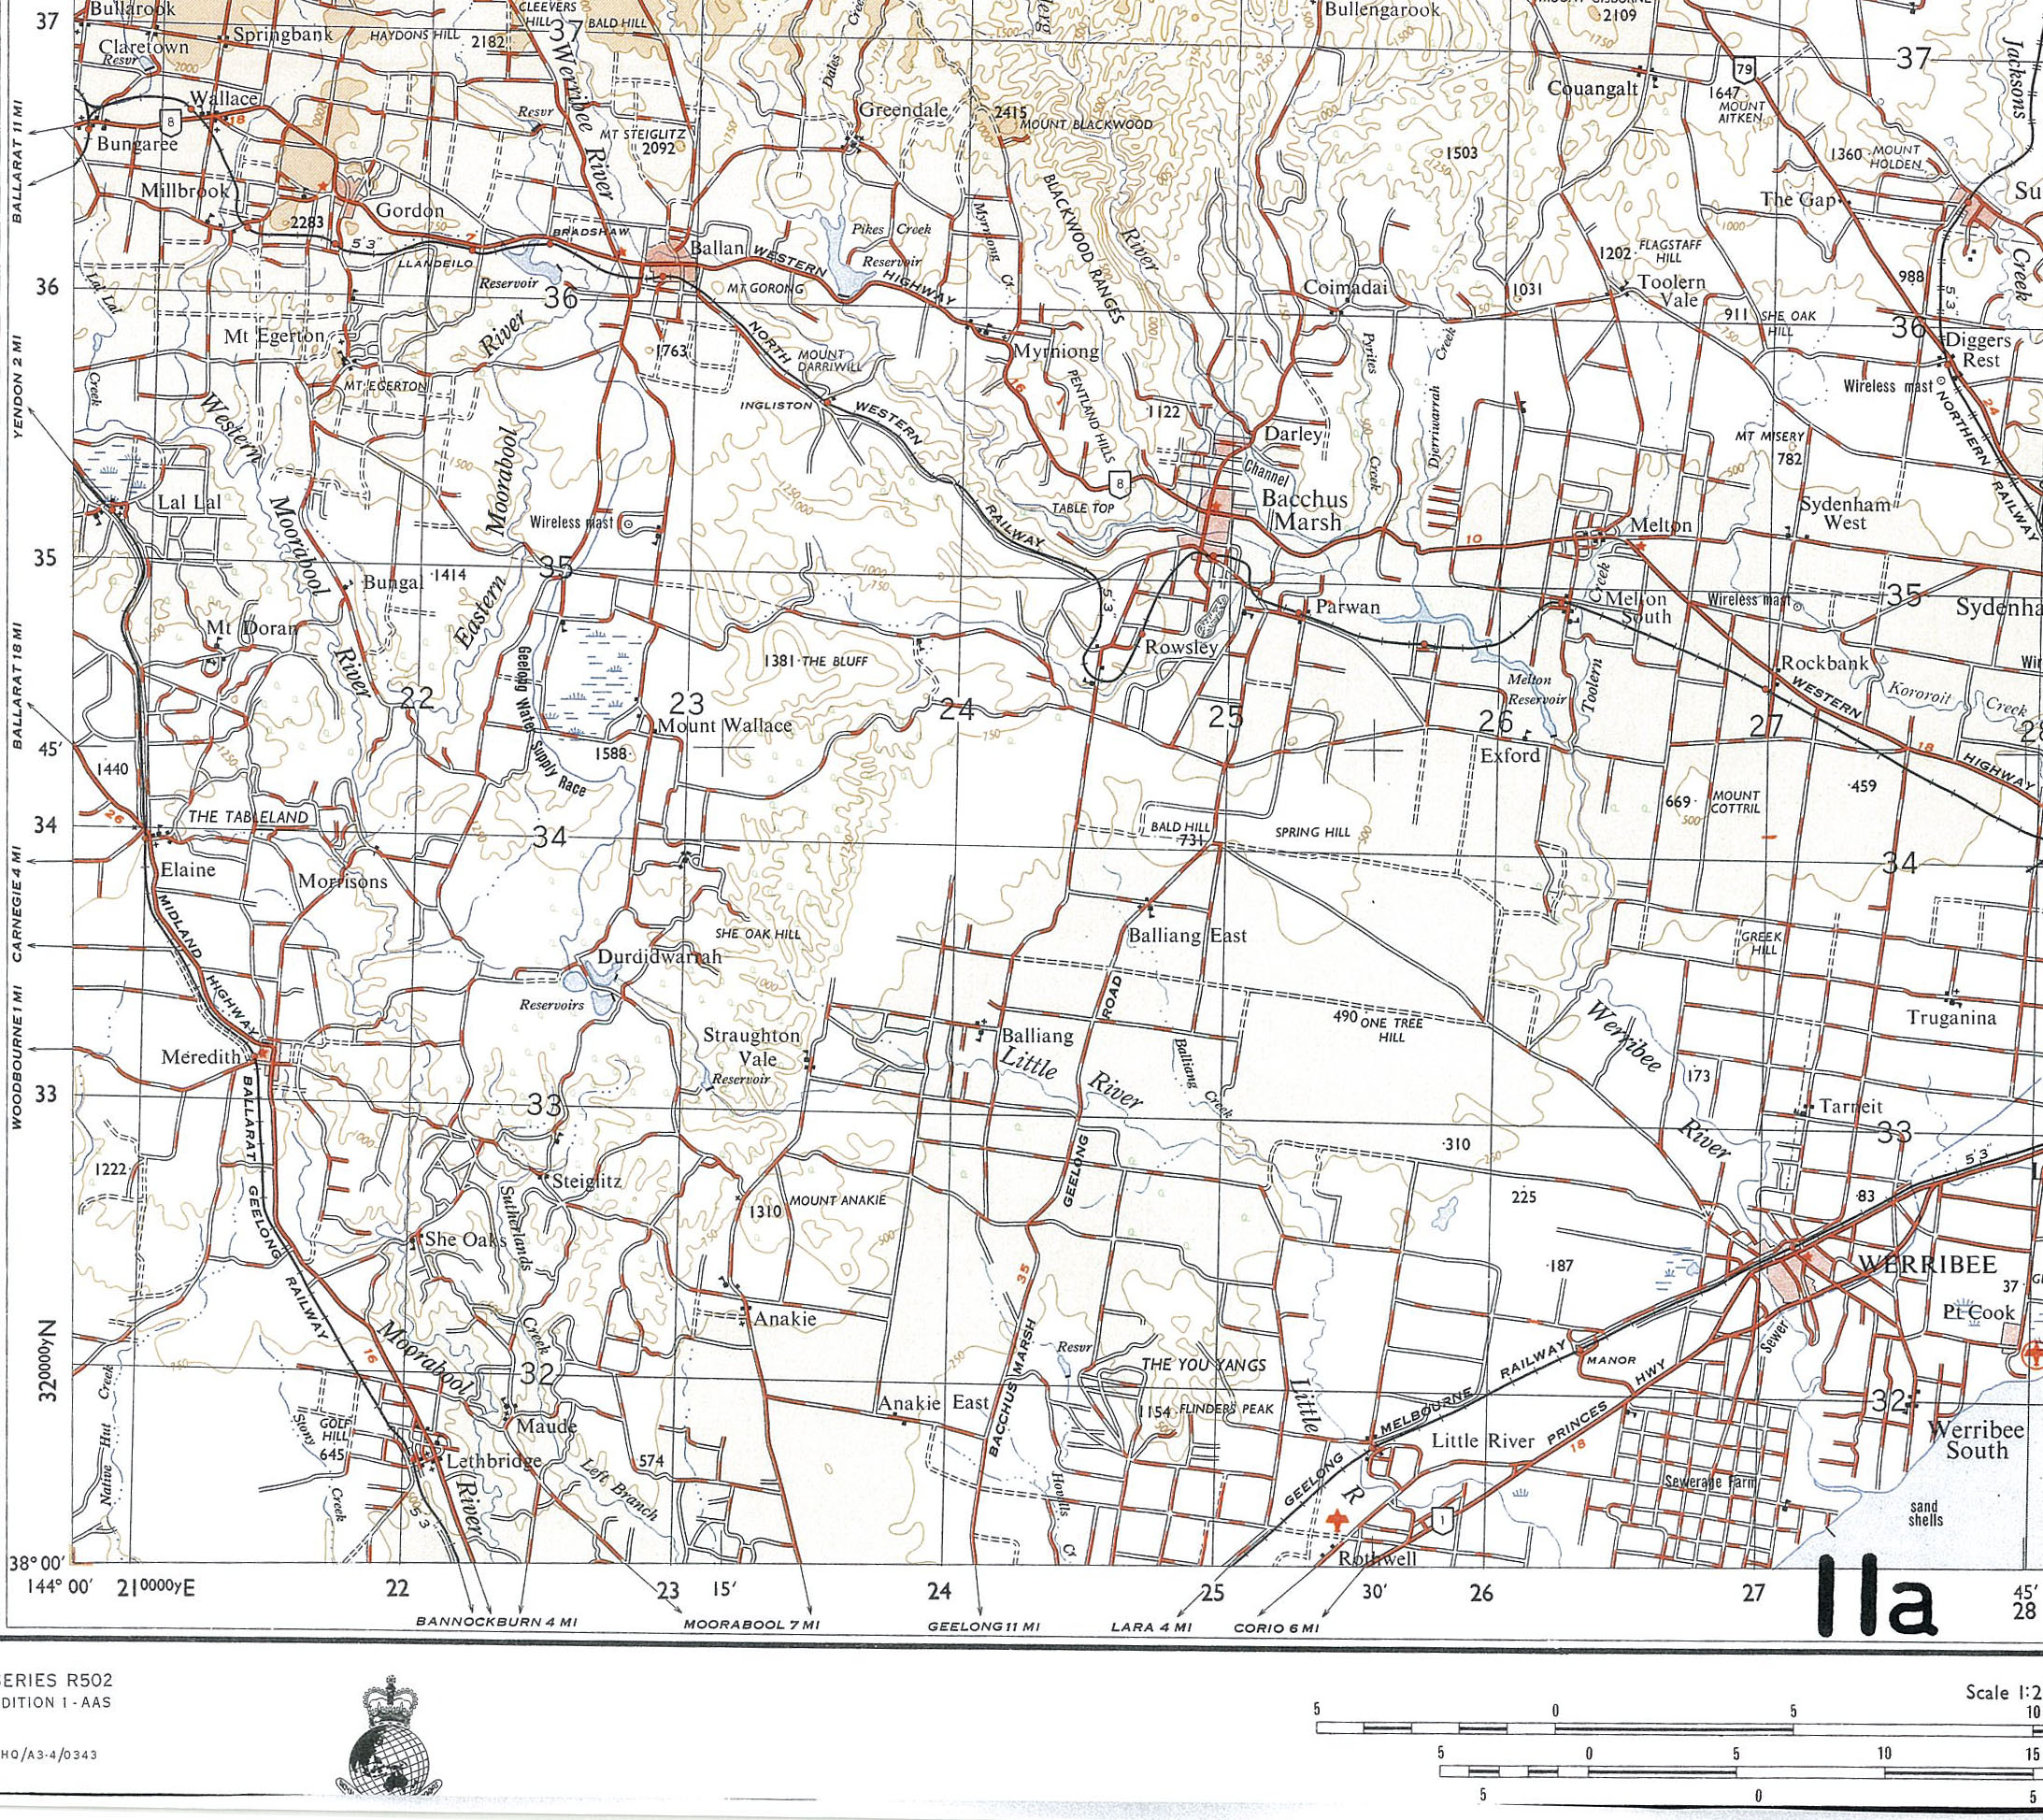
11a : A recent Army 1 : 250 000 (*) |
|
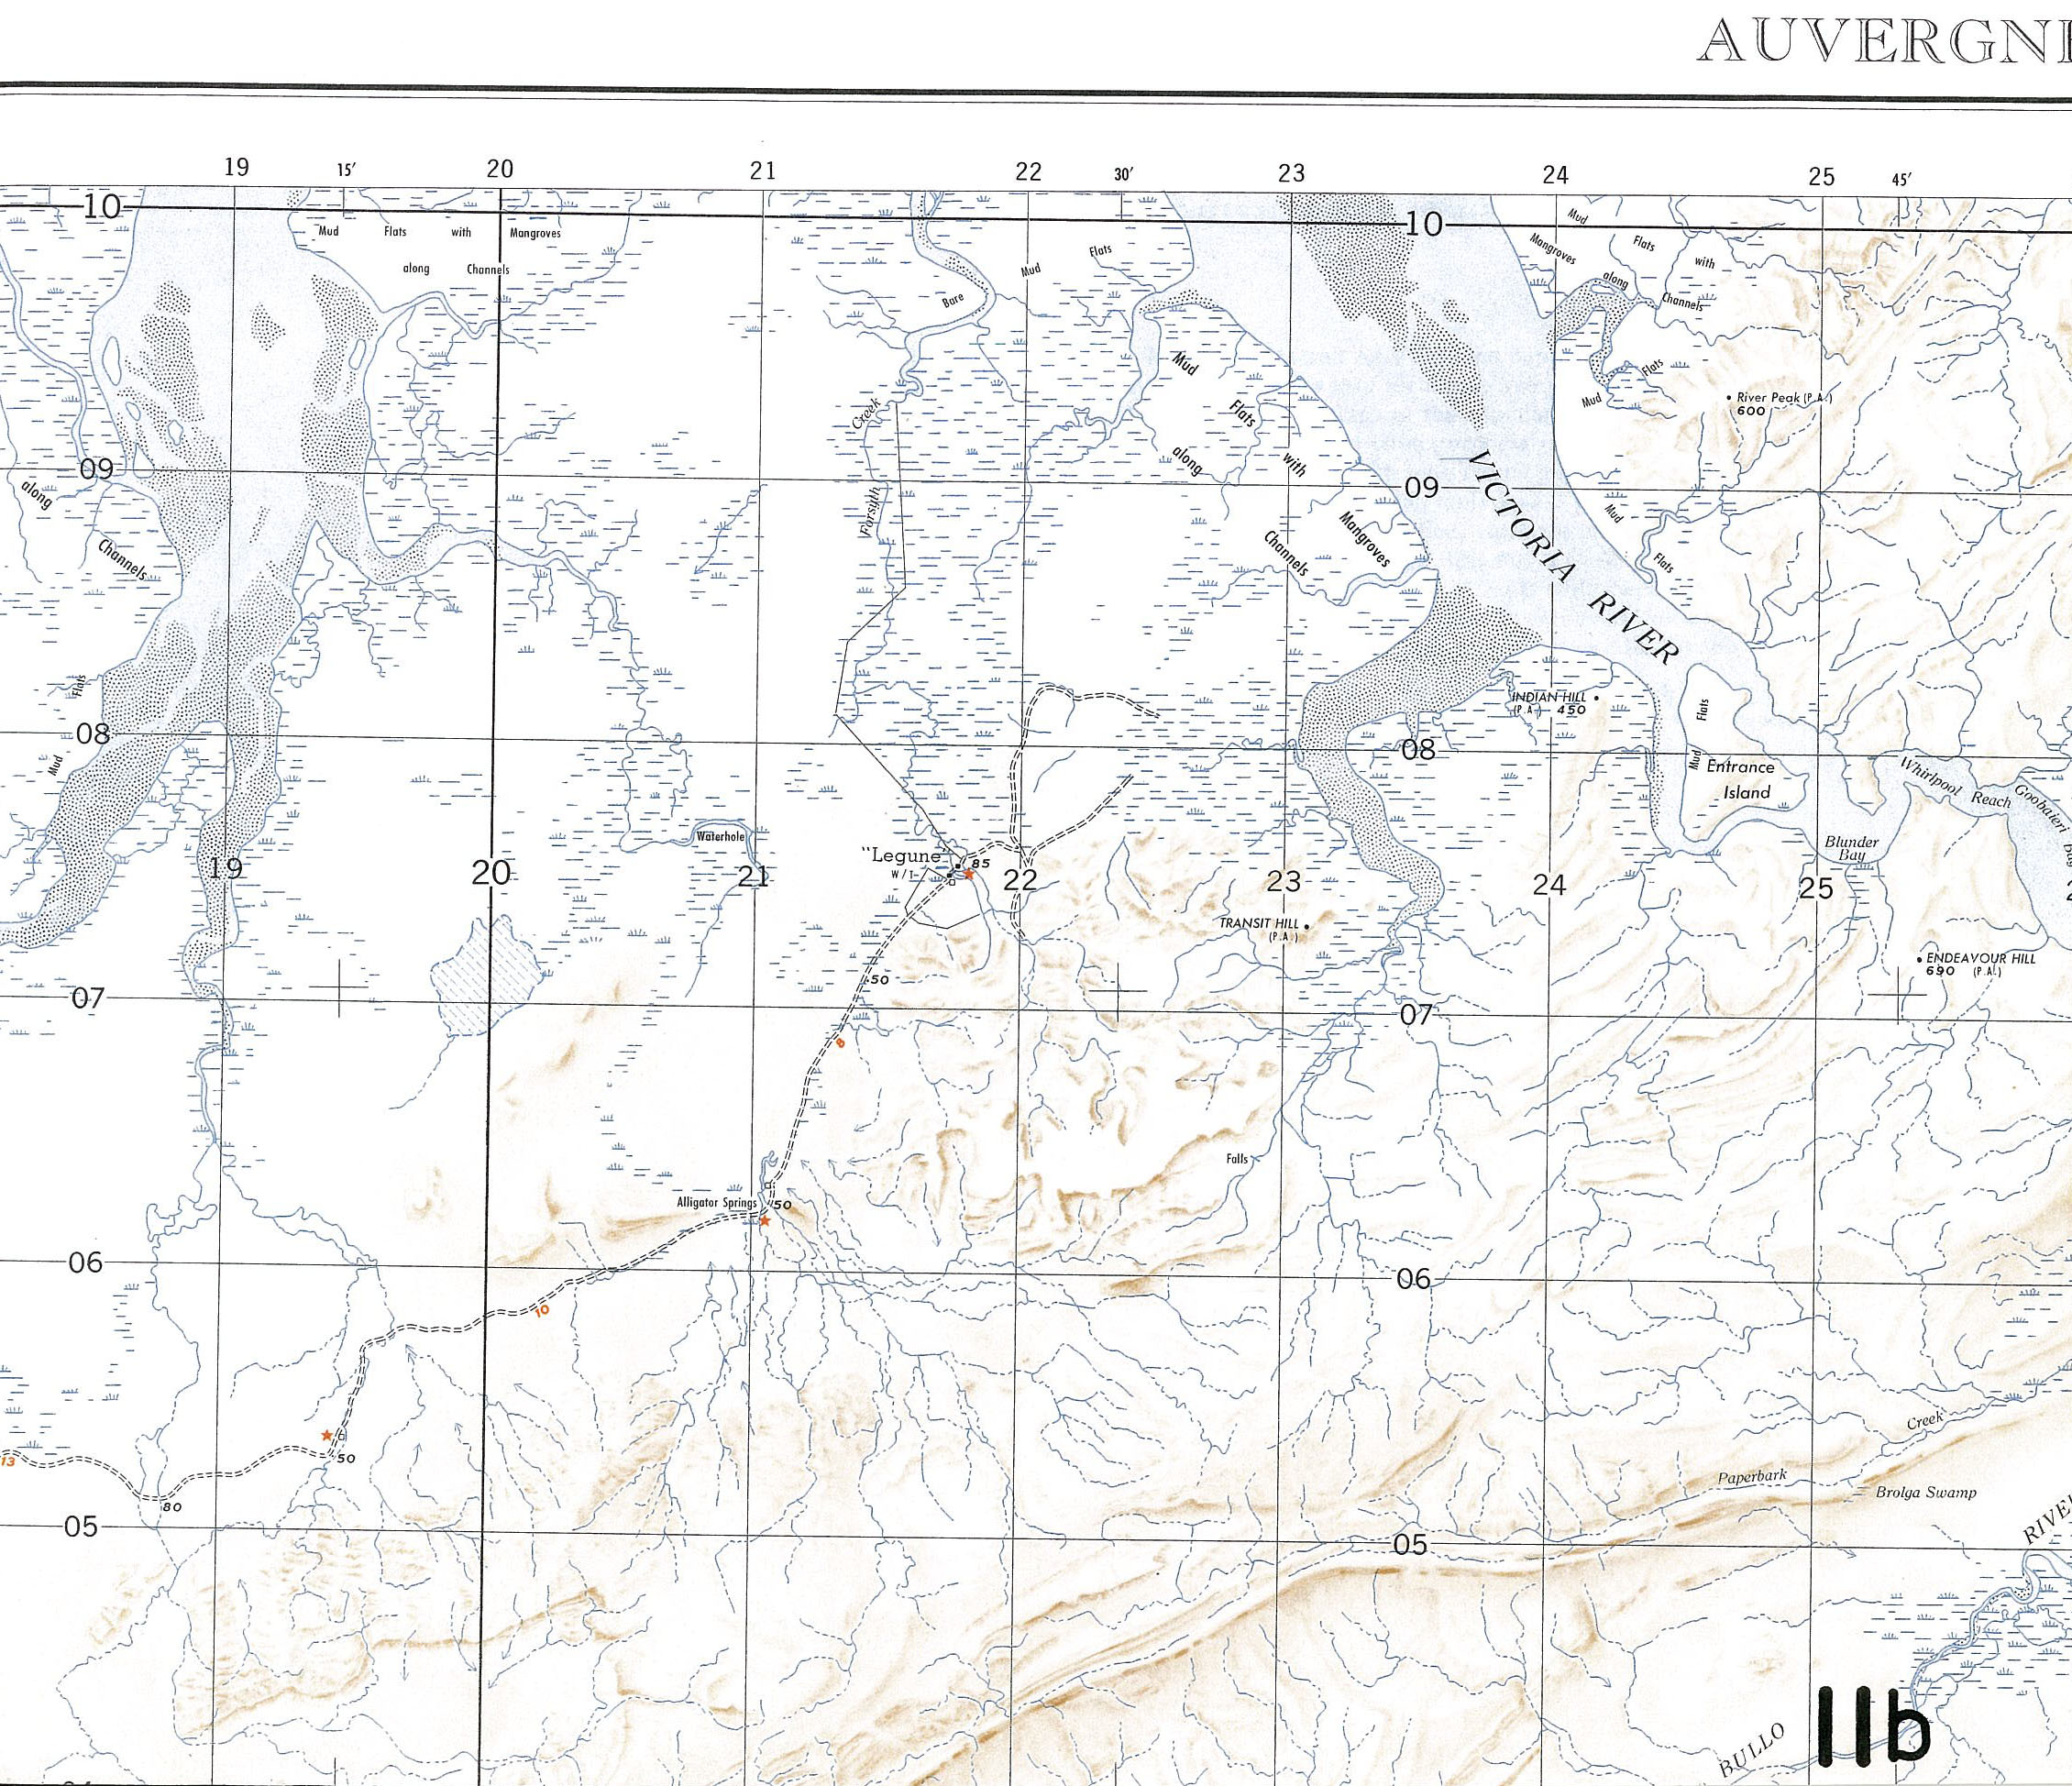
11b : A recent DNM 1 : 250 000 (*) |
|
(*) Maps marked thus are included by kind permission of the Director of National Mapping, Department of National Development. |
NOTE ABOUT MAP SCALES and MAP SERIES [added 2021]
The following tables provides a list of the map scales used herein and the equivalence of the imperial map scales to their metric values. Where applicable the Series Designator (Military) and/or the commonly used series name for the maps at a particular scale is also given.
|
MAP SCALES |
|
|
IMPERIAL |
METRIC |
|
16 miles to 1 inch [*] |
1 : 1 013 760 |
|
No equivalent |
1 : 1 000 000 also 1 : 1 Million |
|
8 miles to 1 inch (R401, 8 mile series) [#] |
1 : 506 880 |
|
No equivalent |
1 : 500 000 |
|
4 miles to 1 inch (R501, 4 mile series) [#] |
1 : 253 440 |
|
No equivalent |
1 : 250 000 (R502 series, generally uncontoured) [#] |
|
No equivalent |
1 : 250 000 (NTMS 250K series) [#] |
|
No equivalent |
1 : 100 000 (NTMS 100K series) [#] |
|
1 mile to 1 inch (R700, 1 inch series) [#] |
1 : 63 360 |
|
No equivalent |
1 : 50 000 (R700) |
|
1 mile to 2 inches (2 inch series) [#] |
1 : 31 680 [&] |
|
40 chains to 1 inch |
1 : 31 680 [&] |
|
No equivalent |
1 : 25 000 |
|
Notes : [*] Used primarily for general, state wide mapping but shown here for comparison purposes with its equivalent metric scale. [#] Series Designator (Military) and/or the commonly used series name for maps at this scale is shown in parenthesis. [&] As there were 80 chains in a mile, 40 chains equalled half a mile or a scale of half a mile to 1 inch or 1 mile in 2 inches meaning these two scales were the same as shown metrically. |
|
Part I : THE DEVELOPMENT OF NATIONAL MAPPING
THE EARLY HISTORY
The sixty year period between about 1815 and 1875 saw the opening up of the interior of Australia by one party after another of explorers, many of whom were surveyors. Their trips varied greatly in terms of success, but almost all of them produced information of a descriptive as well as a technical nature, building up a knowledge of the land which was later to form the basis of much of the mapping and surveying of the continent.
With these first explorers came the first maps of the settled coastal areas, notable among them being Meehan's 1807 map of Sydney land grants and occupation, and Mitchell's 1834 Map of the 19 Counties. Mapping of the interior developed as settlement followed these early explorations, chiefly for the purpose of delineating property boundaries, and partly for communication. Parish maps were the basis for recording cadastral information, but they showed little if any topographical detail, and were compiled without any control survey other than fragmented traverses.
A series of individual triangulation surveys was commenced under the early Surveyors General; New South Wales led the way in 1828 under the energetic direction of Thomas Mitchell, then Tasmania in 1833 under James Sprent. While these surveys were of a high order of accuracy, those in the other States were less satisfactory, and activities in this field declined towards the end of the [19th] century. A national geodetic survey and mapping scheme was recommended from time to time, but no action followed; cadastral mapping was to remain the principal concern of the authorities for many years.
Topographical mapping may be said to have commenced soon after 1907, when the Defence Forces were allocated the task of producing strategic maps and plans. This they attempted to do by adding contours and topographic detail to existing cadastral maps, but it was quickly realised that efficiency and co-ordination could only come with the institution of a proper triangulation system. Consequently, the Survey Section of the Royal Australian Engineers came into being, first of all basing their work on the existing State triangulation systems, and in 1914 commencing their own programme of geodetic survey.
Unfortunately, this was disrupted by World War 1 and in 1915 the Survey Section became the Australian Survey Corps, and with a strength of about 20 was sent overseas. At the end of the war, after attending courses with the UK Ordnance Survey, these men returned to Australia, and the Survey Section, Royal Australian Engineers was re-formed. Sections were established in other States as mapping continued with the production of 1 inch to 1 mile (1 : 63 360) scale topographical maps in coastal areas around the various capital cities.
Between 1913 and the end of World War 1, the following 1 mile scale sheets were published :
|
Year |
Map Sheet |
|
1913 |
Canberra |
|
1915 |
Adelaide |
|
1916 |
Melbourne |
|
1916 |
Perth |
|
1916 |
Sunbury |
|
1916 |
Lake Macquarie |
|
1917 |
Newcastle |
|
1918 |
Sydney |
MAPPING BETWEEN THE WARS
The Military Survey of Australia continued after the first World War, and consisted mainly of 1 inch to 1 mile scale mapping in New South Wales, Victoria and Queensland. In 1932 the Survey Section RAE resumed the title Australian Survey Corps, and at the same time commenced a geodetic survey which eventually linked South Australia, southern Victoria, eastern NSW and Queensland. Map sheets were produced at the average rate of about 4 sheets per year up to 1939. The following extract appeared on the Redcliffe (Queensland) sheet published in 1928, and reveals something of the field methods employed at that time :
Heights determined by vertical angulation, dumpy level and clinometer. The topography was carried out by means of service plane table & Reeve's pattern telescopic alidade.
1926 saw the publication by the Federal Department of Works of the first sheet of the 1 : 1 Million International Map of the World (IMW) series; by 1930, the Sydney, Bodalla, Melbourne and Canberra sheets had been published. Unfortunately, only five more sheets were to appear before the second world war suspended publication.
The advent of aerial photography had, in 1930, far reaching effects on both mapping techniques and the demand for maps. Photogrammetry, essentially using aerial photographs to produce maps, first supplemented and then quickly replaced Plane Tabling in the production of medium scale maps. In 1936 the 1 inch to 1 mile scale map of Sale was compiled entirely from aerial photos - the first map to be published in Australia by photogrammetric methods (principal point traverses were plotted, transferred, and adjusted to a master control sheet, and detail plotted by the Arundel, graphical radial line triangulation, method. Photos were contoured under an ordinary stereoscope after obtaining height data in the field).
In spite of all these advances, there was still a lack of co-ordination between the mapping agencies. A Commonwealth Survey Committee, set up in 1935 to try and effect the much needed co-ordination, made several unsuccessful representations to Cabinet over the ensuing four years for the initiation of a national geodetic and topographic survey.
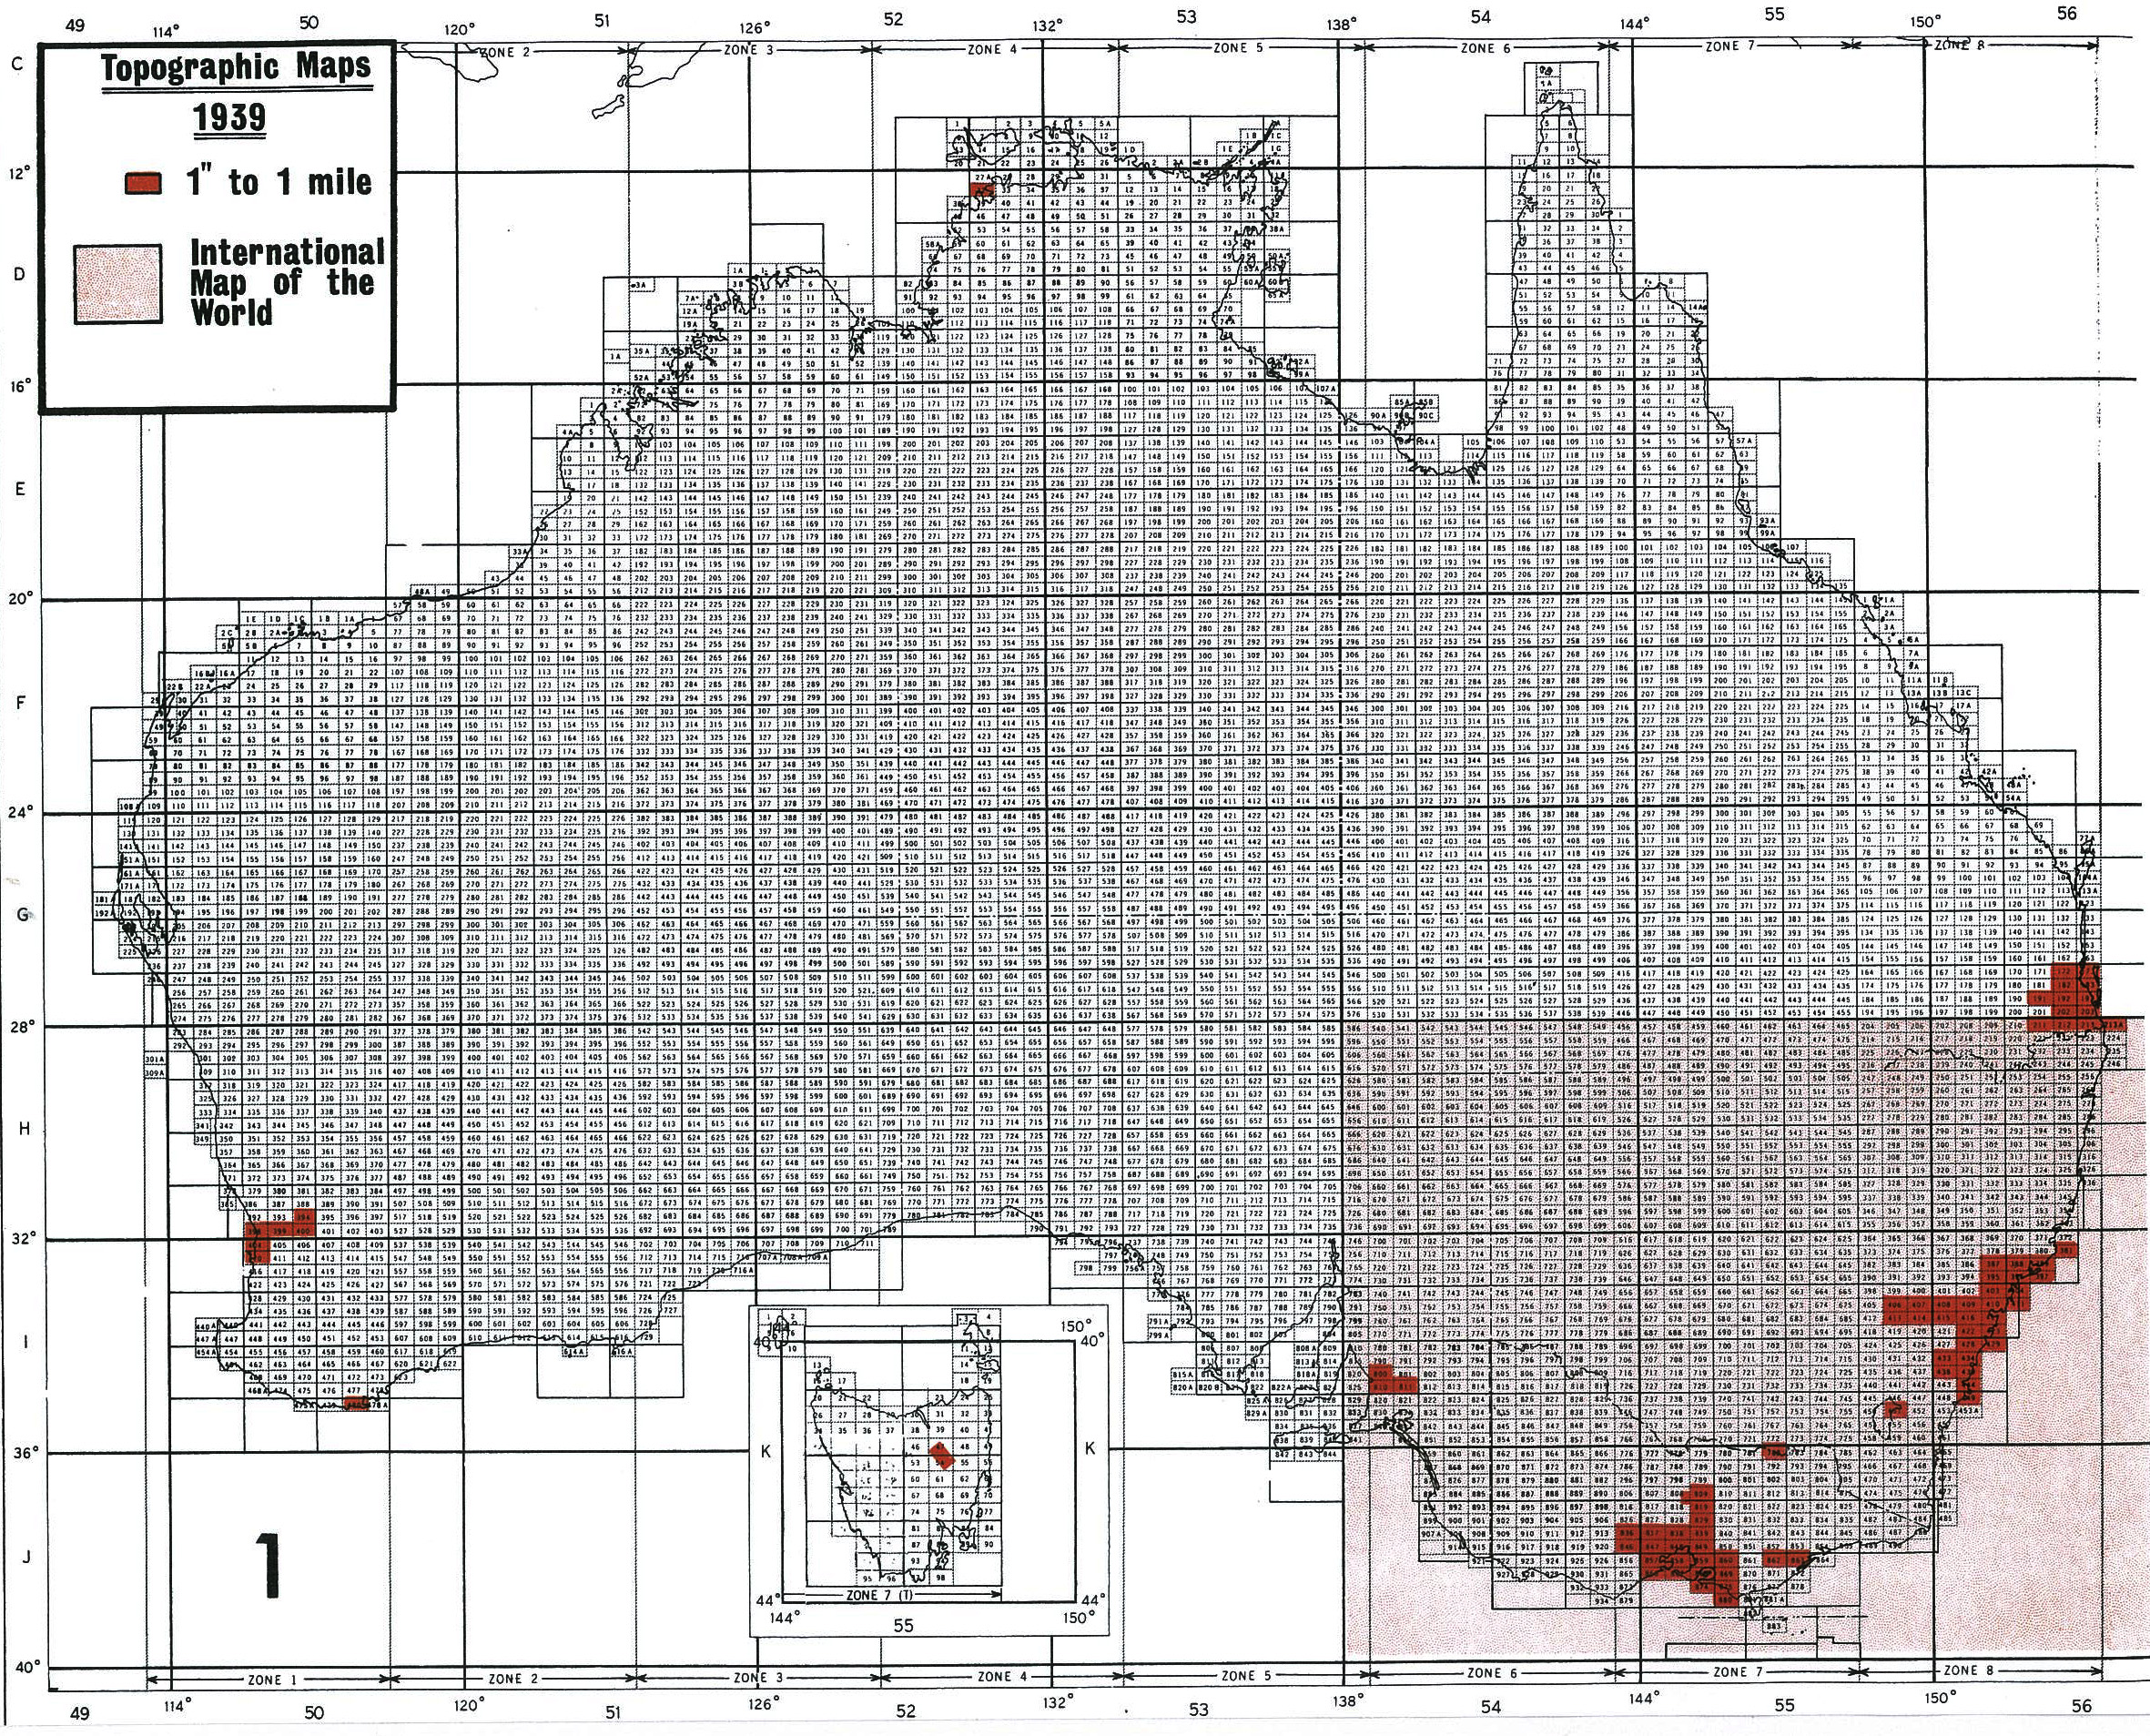
The outbreak of hostilities in 1939 thus found Australia without adequate map coverage even of operational areas, and with no co-ordinated survey and mapping programme. Figure 1 shows the topographical map coverage of the continent in 1939.
MAPPING DURING WORLD WAR II
World War II brought a sudden increase in the demand for maps, and consequently intensified activity in the field of geodetic and topographic survey. Immediate results were a considerable increase in the strength of the Australian Survey Corps, and the institution of the Emergency Mapping Scheme in November 1940. This latter was a result of the threat of Japanese invasion, and the maps produced under the scheme were of strategically important areas, particularly in the north.
Mapping at 1 inch to 1 mile scale was continued; new series at 8 miles (1 : 506 880) and 4 miles (1 : 253 440) to the inch scales were commenced; and many photomaps were produced. All available material was utilised in the rapid compilation of the topographical maps, which were not necessarily the result of precise surveys.
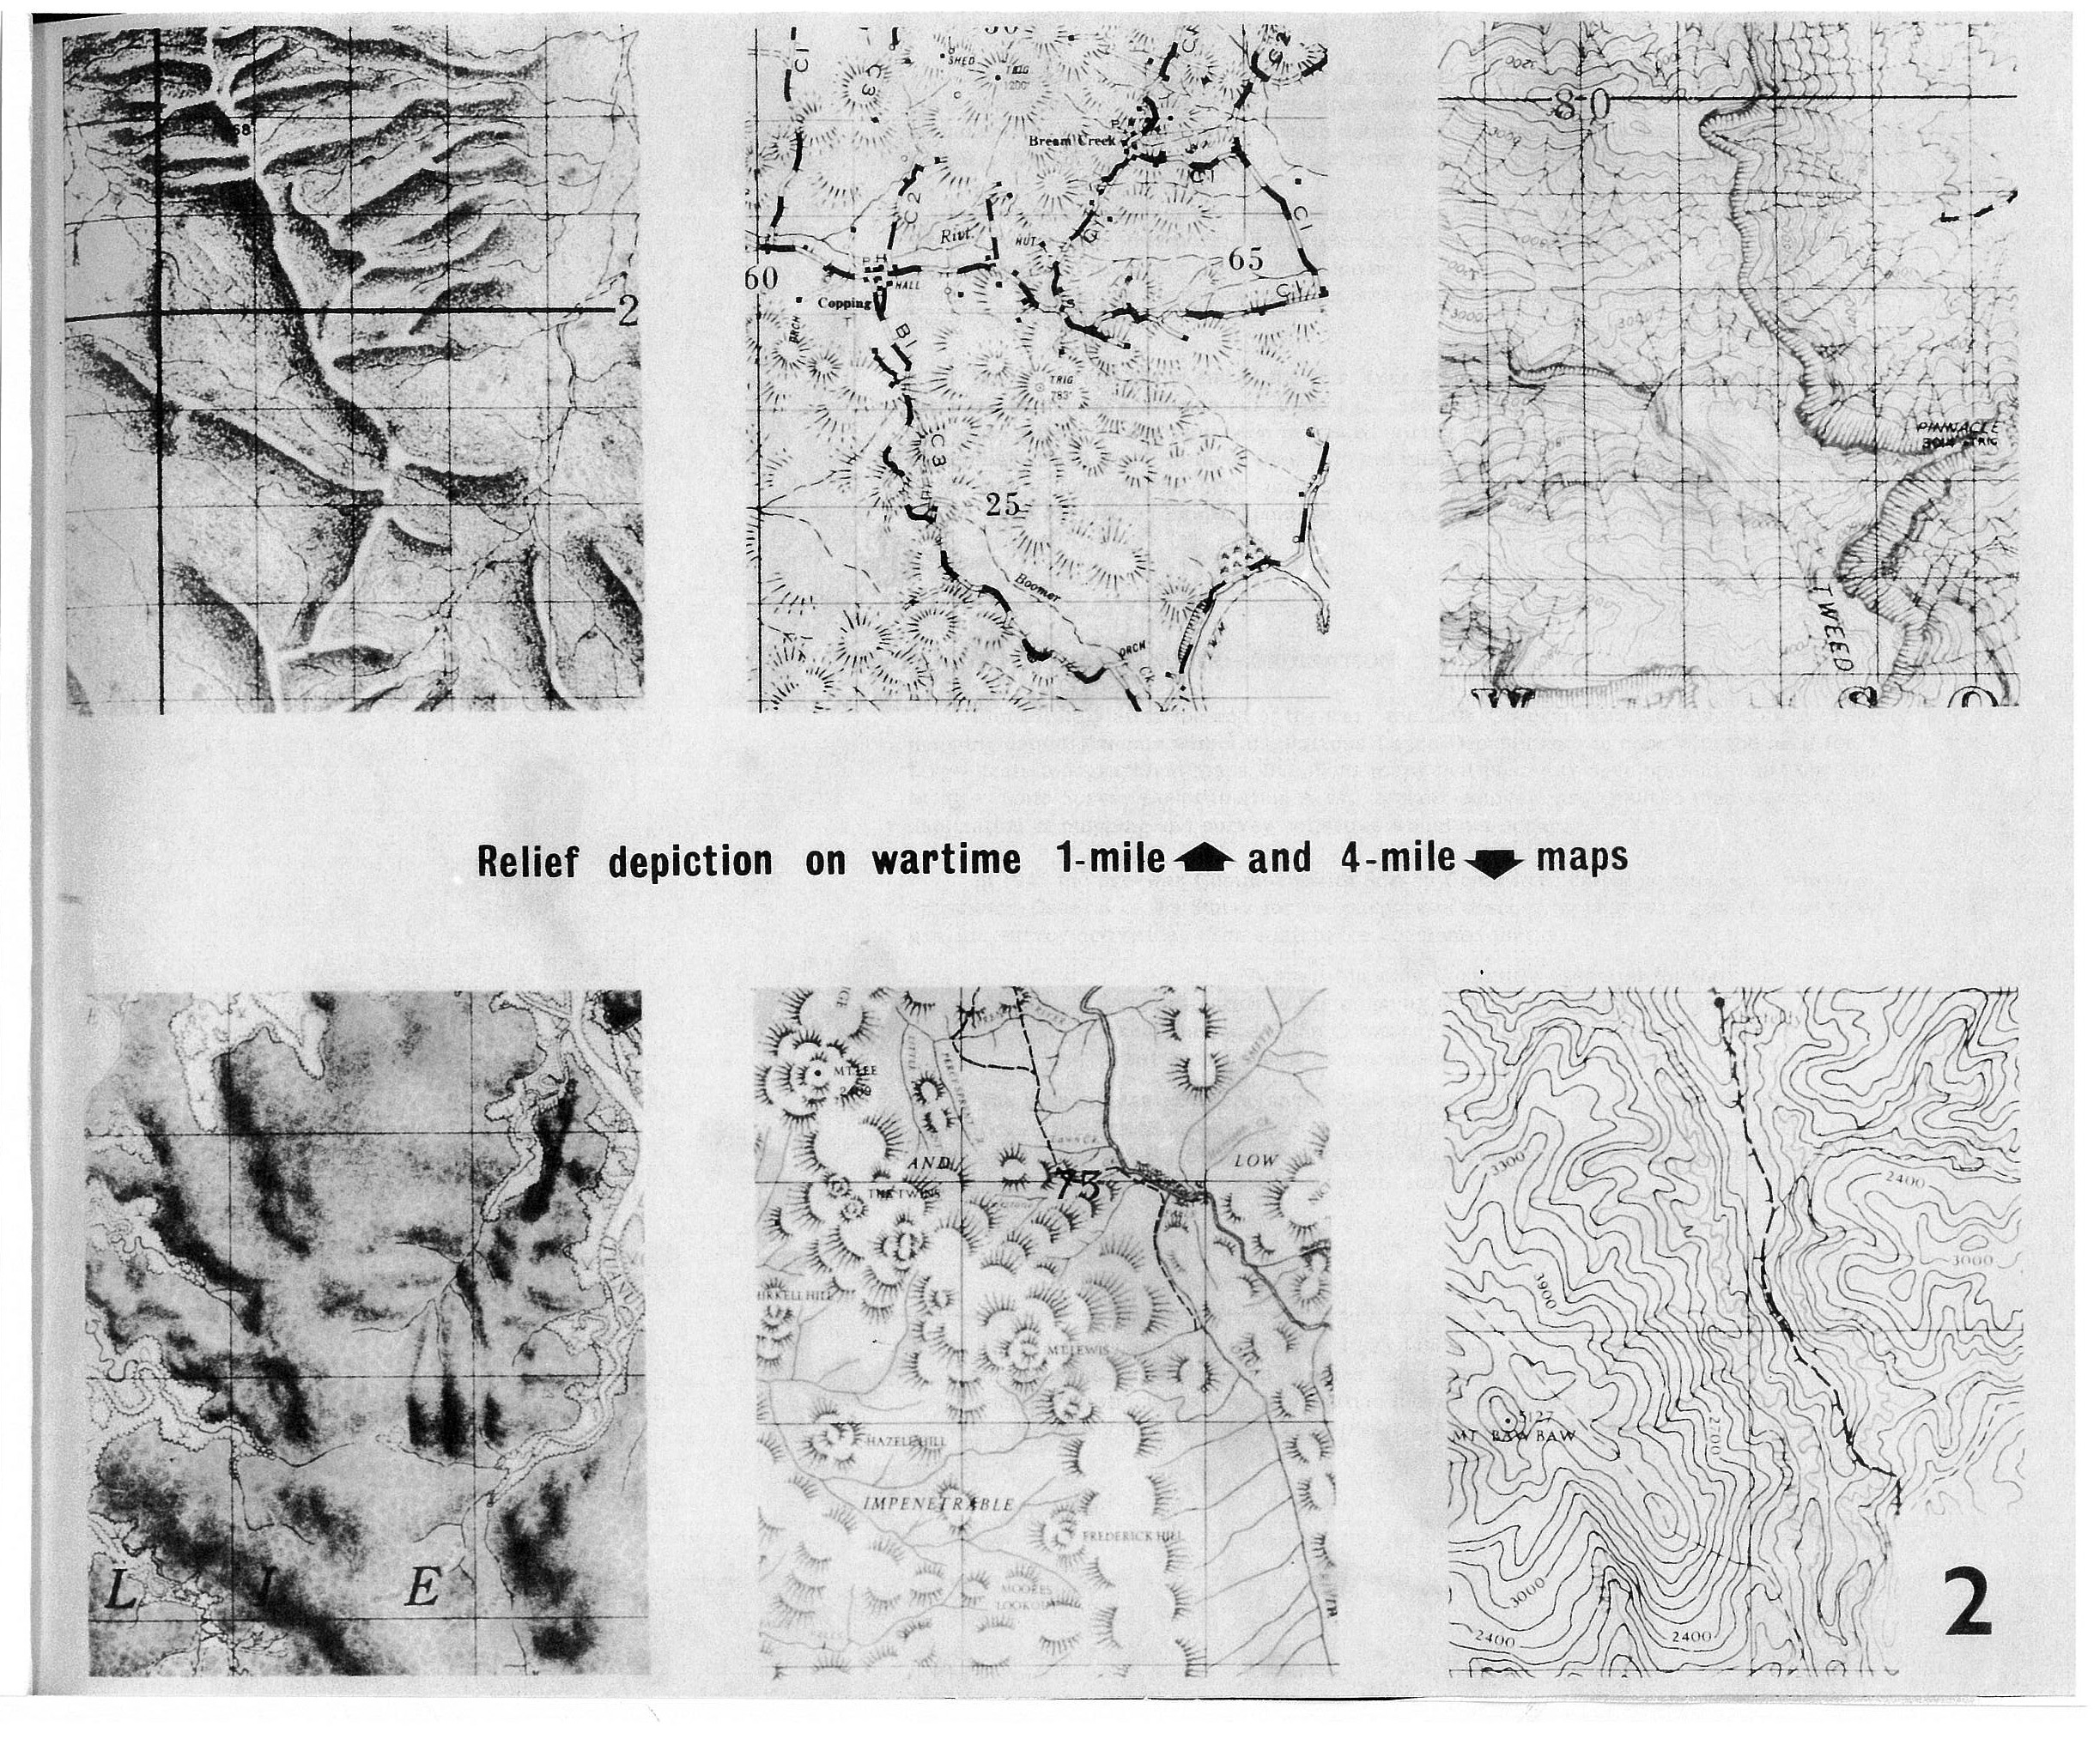
In the 1 inch to 1 mile scale series, half (170) were published as Emergency Editions. The majority of these depicted relief by hachures or hill shading, a few by contours. Of the remaining 172 Standard Editions, by far the greater amount were contoured, and the rest hachured or hill shaded. Figure 2 shows the various methods of relief depiction on these maps.
Of the 230 four miles to 1 inch scale sheets, many of them titled Strategic Series, only about one third was contoured, most of the remainder showing relief by means of somewhat crude hachures. In some cases, sheets were nothing better than scaled enlargements of the existing 1 : 1 000 000 scale International Map of the World map sheets, the 100 metre contours of the latter appearing as 300 feet form lines.
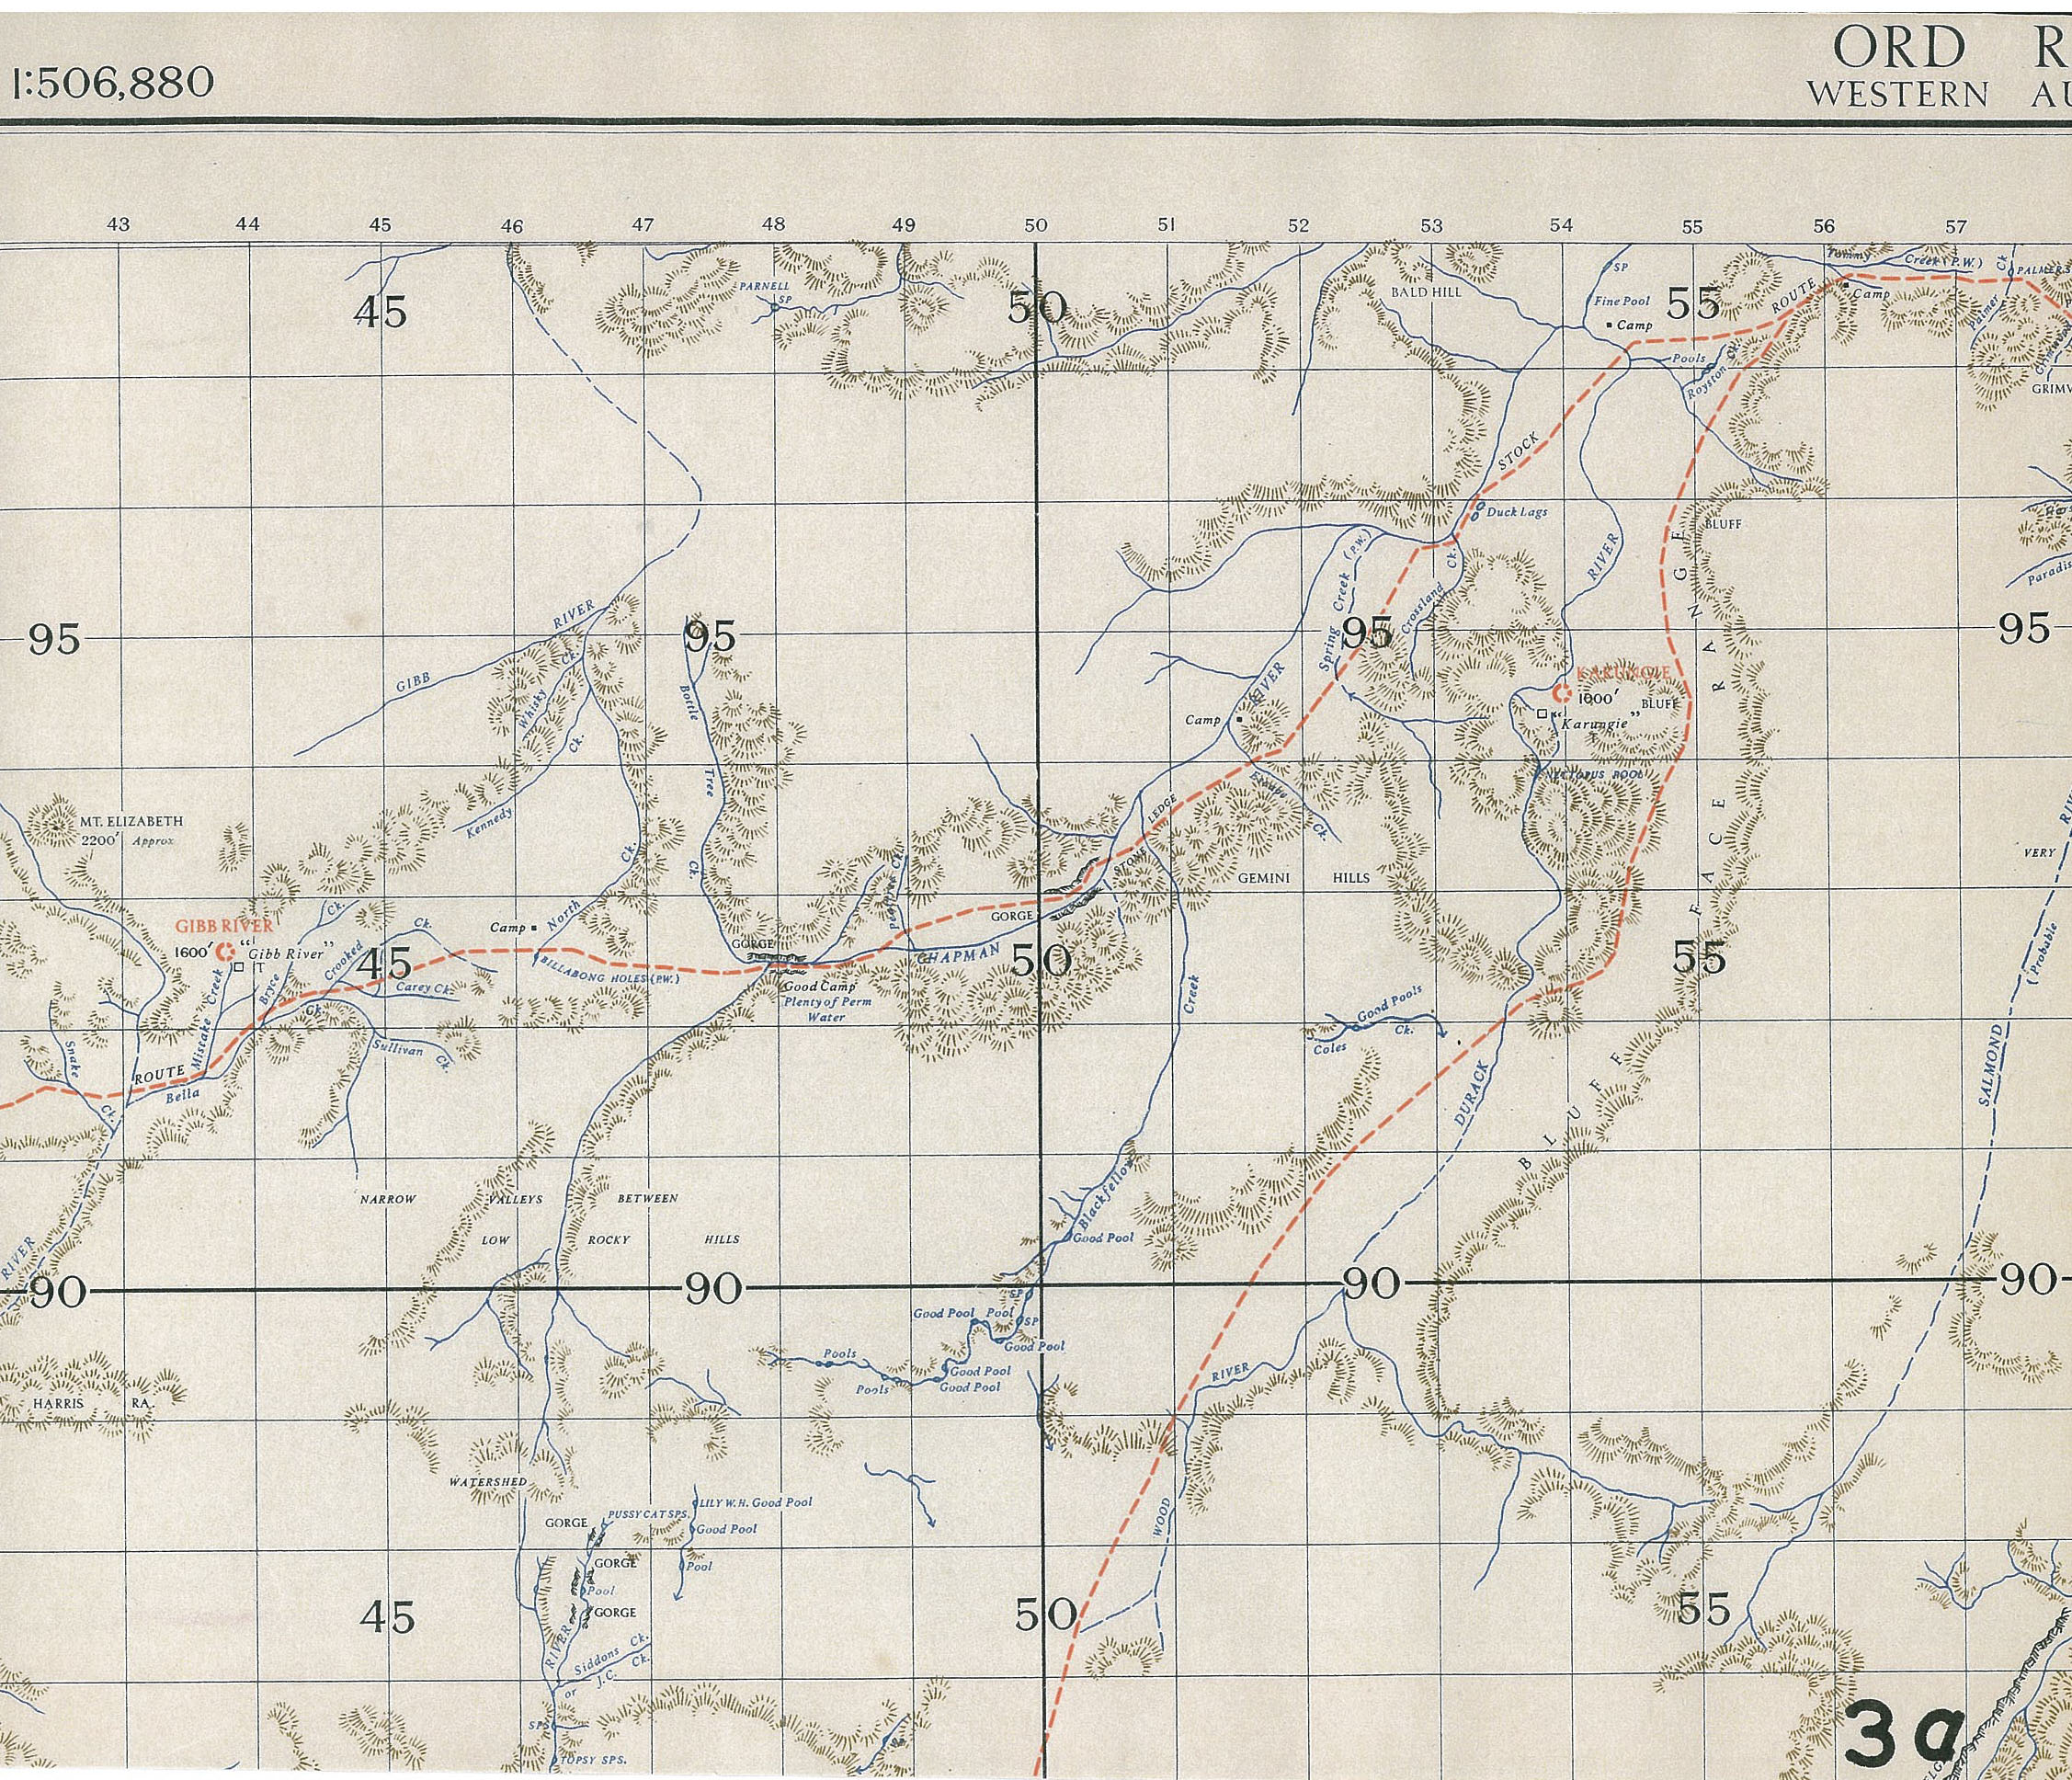
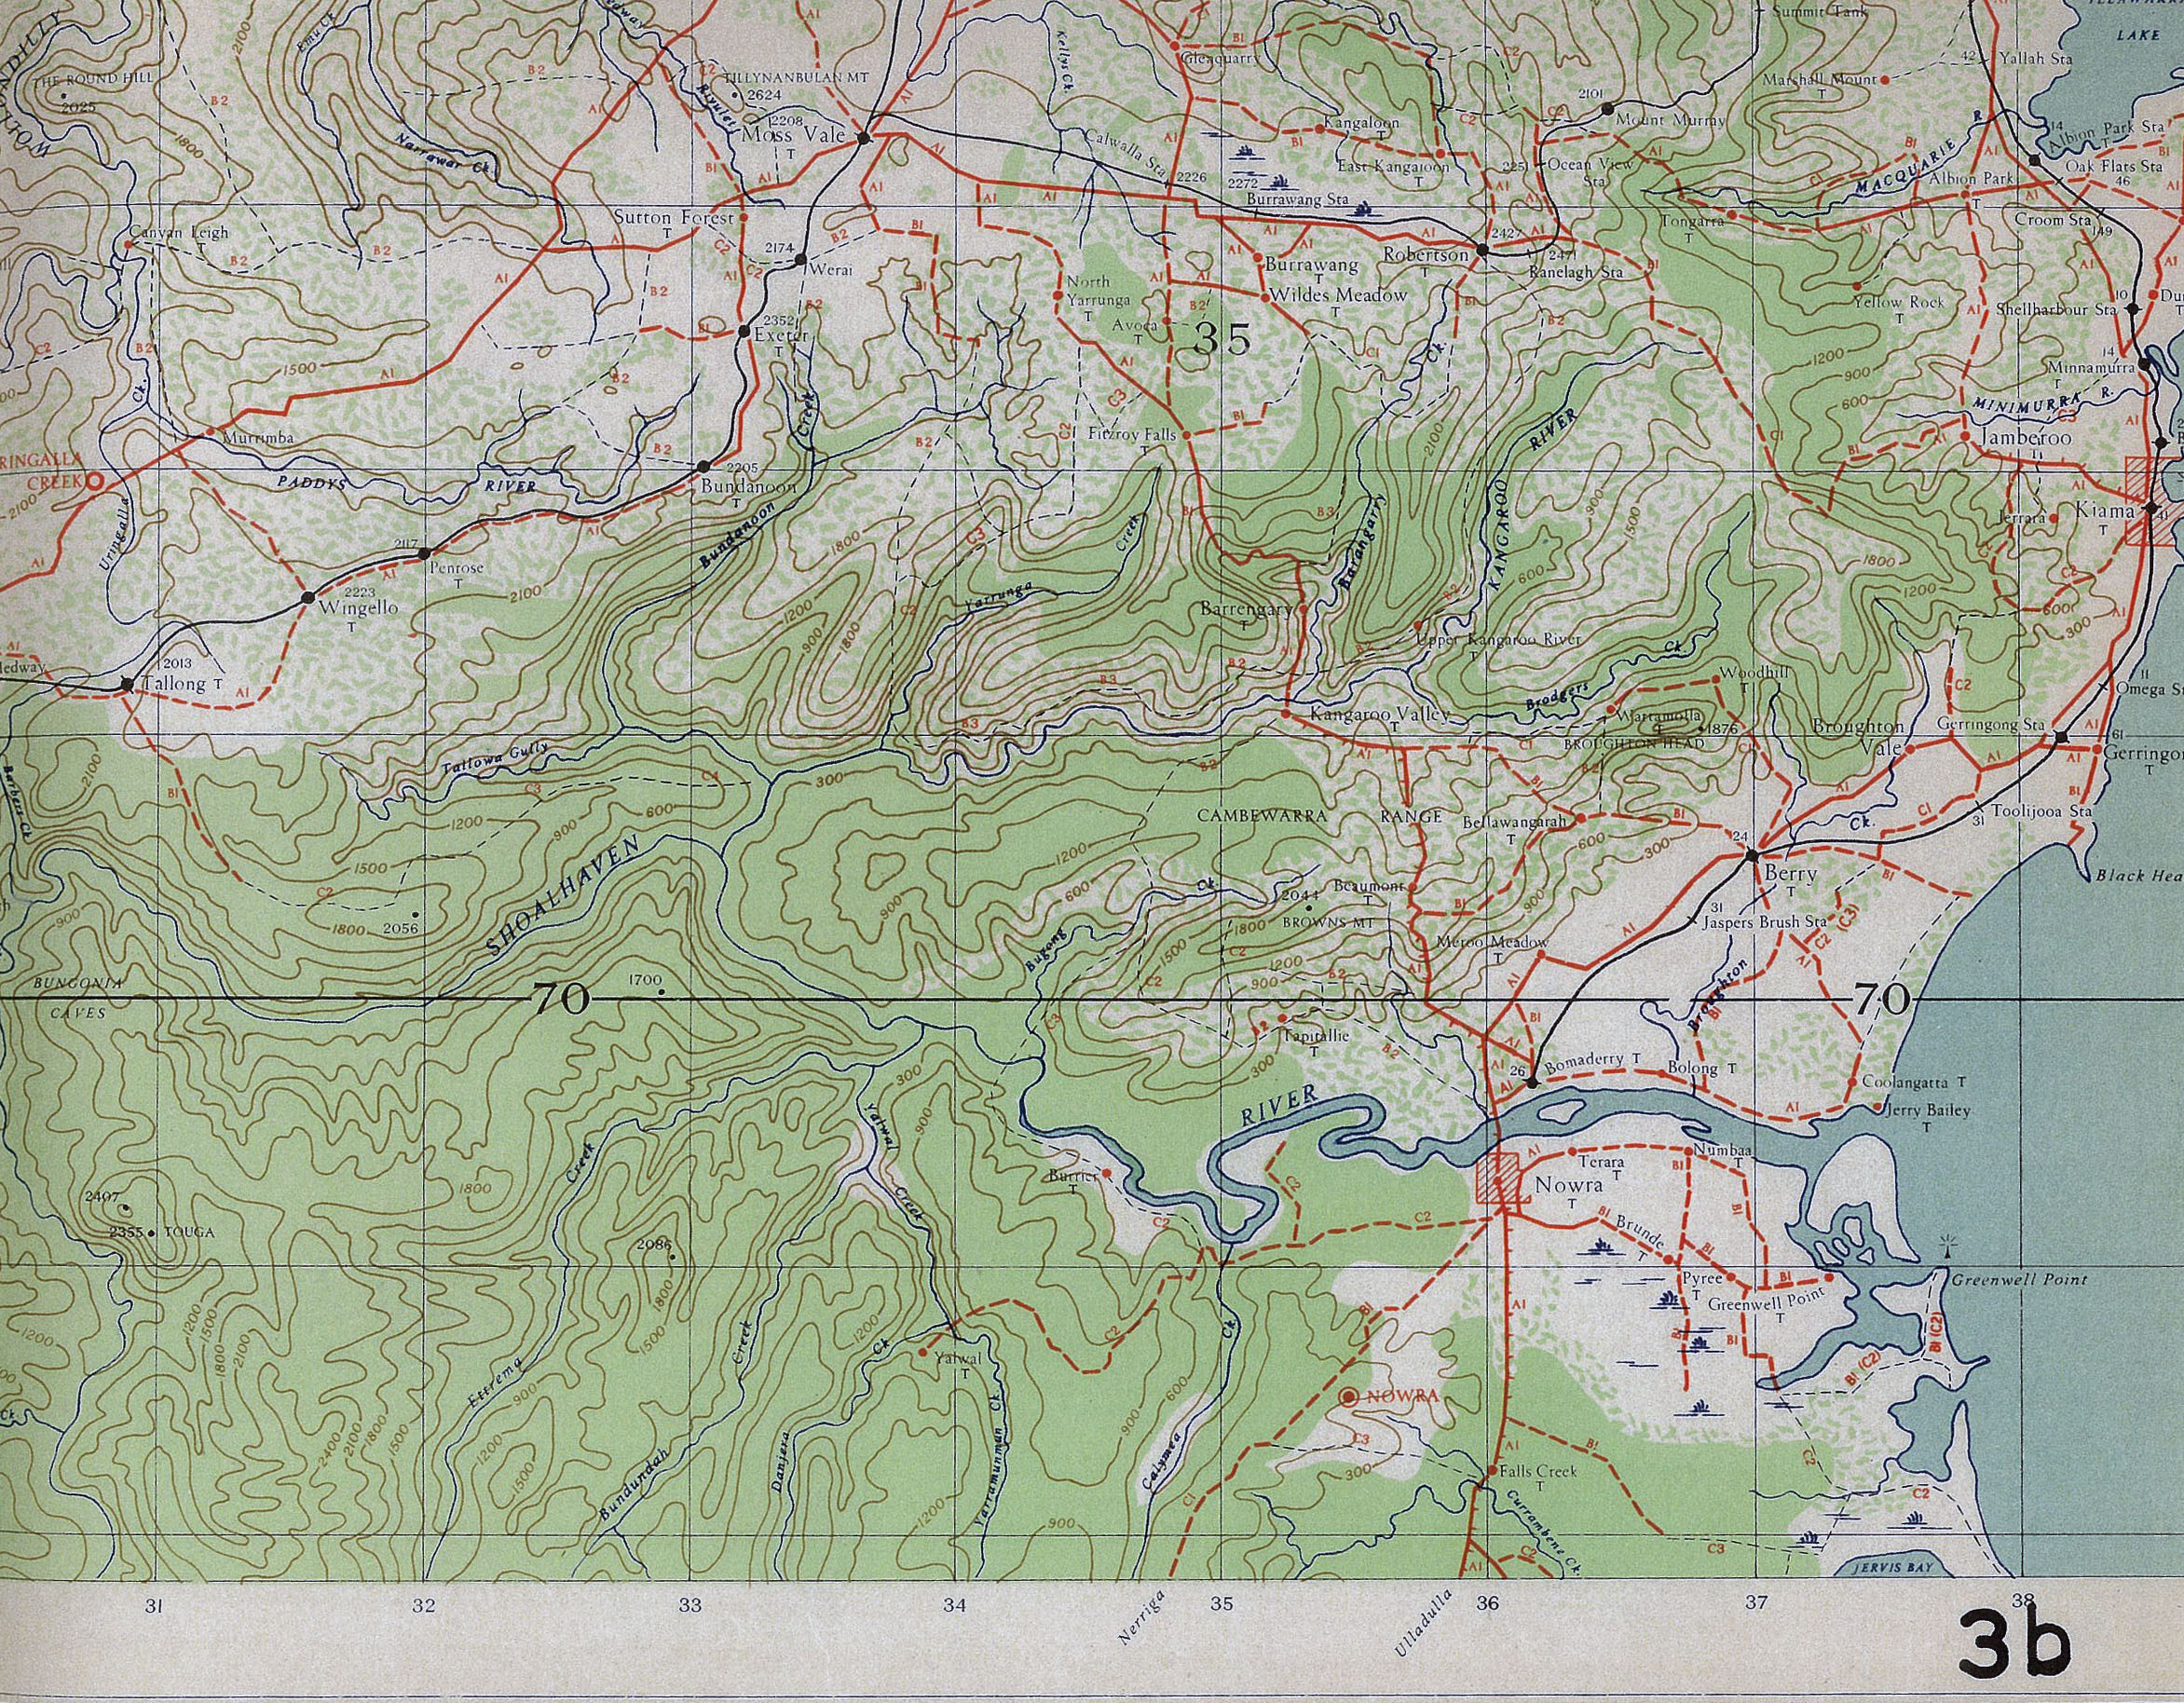
Much of the interior and remaining northern parts of the continent were mapped at 8 miles to the inch, this hurriedly produced series having on the whole a very sketch map appearance, and depicting relief by hachures.
Figure 3a and Figure 3b are extracts from an 8 mile sheet and a 4 mile sheet respectively.
Map coverage at the end of the war (Figure 4) shows an impressive increase on the 1939 position, some 60 eight mile, 230 four mile, and 340 one mile scale sheets having been produced during the war years (a military topographic series at 1 : 25 000 scale was also commenced in 1941; this was the artillery map series that is still current, but owing to security restrictions, no information may be published concerning these, except to say that 32 sheets were published between 1941 and 1946). However, it must be remembered that most of these sheets do not meet present day standards or requirements. At the end of the war, the eight mile scale series was discontinued, but the 4 miles and 1 mile scale series were carried on into the post war period of reorganisation and redevelopment.
POST WAR PLANNING AND CO-ORDINATION
Immediately after the end of the war, the State Governments faced the task of creating mapping establishments within the various Lands Departments to cope with the need for large scale topographical maps and photomaps that post war development would obviously bring. State Survey Co-ordination Acts, or their equivalents, ensured that uneconomical duplication of mapping and survey activities would not occur.
In 1945 the pre-war Commonwealth Survey Committee called a conference with the Surveyors General of the States for the purpose of discussing post war geodetic and topographic survey activities. The conference concluded that :
…a National Mapping Council is essential for the co-ordination of the mapping activities of Australia, and recommends to the Commonwealth and State Governments that such Council be established as a permanent body…
The Council was to comprise the Commonwealth Surveyor General (Chairman), a member of the Commonwealth Survey Committee, and the Surveyors General of the States. The approval of the State Premiers was quickly given, and the Council held its first meeting at the end of 1945, and was constituted in 1946.
There followed now some years of what can at best be only loosely called co-ordination - to cope with Commonwealth mapping, a National Mapping Section had been created in 1947 within the Department of the Interior; the Royal Australian Survey Corps continued to cater for defence needs; and the State authorities divided their attention between cadastral mapping, and the implementation of programmes of topographic and special project mapping.
In 1950, the Minister for Army arranged for the Director of the UK Ordnance Survey, Major General Reginald Llewellyn Brown, to visit Australia and report on the work of the Survey Corps and its integration with civilian mapping. This visit culminated in what is often called The Brown Report; it was not until 1954 however that its recommendations were acted upon.
In 1951, the responsibility for national mapping was transferred from the Commonwealth Surveyor General to a new position of Director of National Mapping, and the Prime Minister and State Premiers agreed to this officer becoming Chairman of the National Mapping Council with the Commonwealth Surveyor General remaining as a member.
In 1954, after long consideration of the Brown Report, it was decided that there should be one Authority responsible for all Commonwealth surveys and mapping, and that the Department of the Interior should be that Authority. It was also decided that the Army would carry out some work for the Authority on an agency basis. At about the same time, an Advisory Committee was set up (replacing the Commonwealth Survey Committee) to advise the Minister generally on the proper planning, co-ordination and development of surveying, mapping and air-photography. This Committee now comprises the Secretary of National Development, the Secretaries of the Departments of Navy, Army and Interior, and a member of the Australian Institute of Surveyors.
In 1956, the National Mapping Section was transferred to the Department of National Development, at the same time being given the status of a Division. The Department of National Development thus replaced the Department of the Interior as the organising body for Commonwealth surveys, mapping and aerial photography, with the Division of National Mapping as the branch of the Department actively concerned with carrying out those functions.
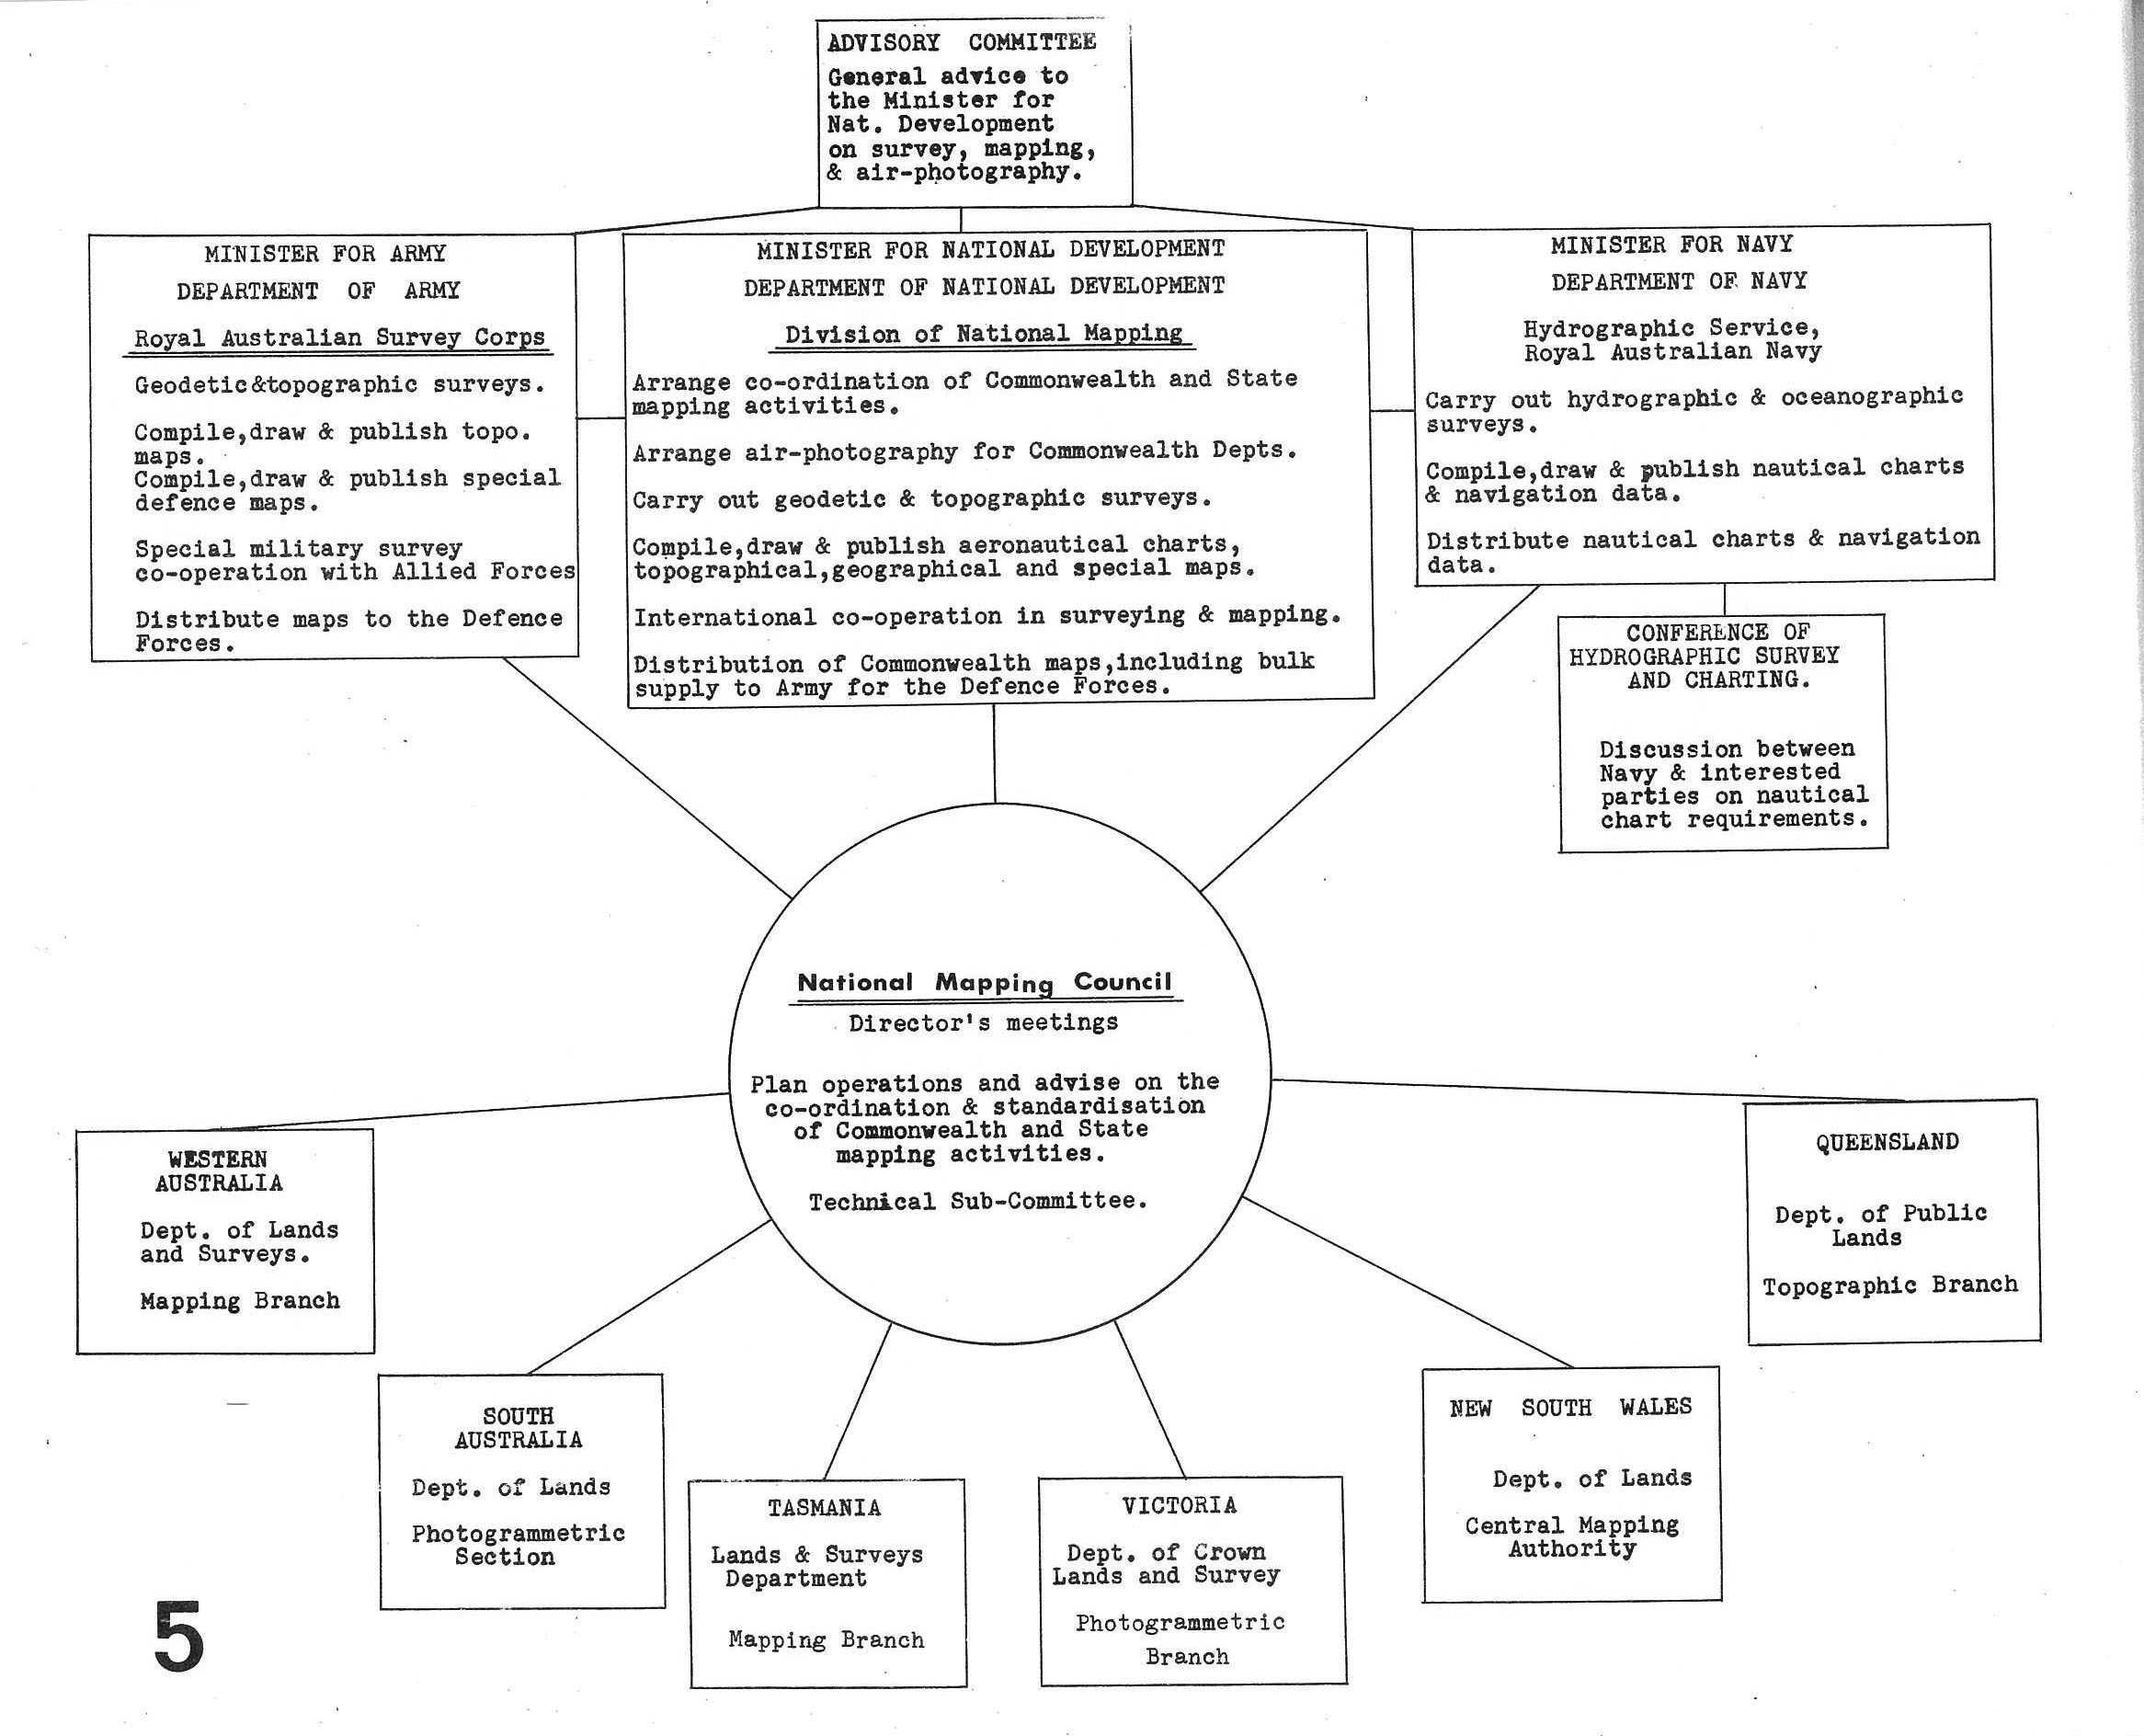
THE PRESENT MAPPING ORGANISATIONS
1. The National Mapping Council
The Council meets once a year, and its Technical Sub-Committee meets once a year at the intermediate six-monthly period. The Council consists of the following officers :
Chairman : The Director of National Mapping, Department of National Development;
Members : The Director of Military Survey, Department of Army;
Commonwealth Surveyor General, Department of the Interior;
The Hydrographer, Royal Australian Navy;
The Surveyors General - New South Wales, Victoria, Queensland, South Australia, Western Australia and Tasmania
During the course of its activities, the Council has adopted national standard specifications for aerial surveys, geodetic surveys, map presentation, and map accuracies; it has planned and implemented the national programme of geodetic survey, aerial photography and topographic mapping to the stage where, by 1965/66, the basic minimum requirements in these fields will be attained; and it has drawn up resolutions for the acceleration of the national mapping programme and for the provision of a greater degree of co-ordination between survey authorities both in planning various phases of their work, and in the systematic recording of valuable survey data.
Figure 5 shows the present mapping agencies in diagrammatic form - their responsibilities and activities, and their co-ordination through the National Mapping Council. The Standards of Map Accuracy laid down by the Council may be read via this link.
2. The Department of National Development, Division of National Mapping
Apart from arranging co-ordination of Commonwealth and State mapping activities, the Division arranges aerial photography for Commonwealth Departments, and compiles, draws and publishes topographical maps, aeronautical and geographical maps and special maps. It has become increasingly involved in activities concerned with Antarctic mapping, satellite surveys and general international co-operation in surveying and mapping. It is also responsible for mapping the Northern Territory, New Guinea, and the Australian dependent territories. Field and photogrammetric surveys are the responsibility of the Geodetic and Topographic Survey Branches in Melbourne. Editing, fair-drawing, and platemaking are carried out at the Map Production Branch in Canberra, where the Government Printer prints the Division's maps.
The Division has increased from 54 positions in 1947 to 204 (permanent and temporary) positions at present. Topographical mapping activities in Australia at the present time are the 1 : 1 000 000 scale Australian Geographical Series and the 1 : 250 000 scale Planimetric Series.
3. The Department of Army, Royal Australian Survey Corps
The Corps has been associated with topographical mapping in Australia since its inception in 1907, and has held the fort in this field until civil mapping commenced after the second World War. From a strength in 1912 of 16 topographers and 4 draughtsmen, it grew to its peak of 1 800 personnel in 1944, and at present maintains a strength of about 400.
Its main responsibility is the production of military maps for defence purposes, thereby making an important contribution to national mapping by producing topographic maps in the 1 : 250 000, 1 : 100 000 and 1 : 50 000 scale series.
The Corps comprises a Survey Directorate in Canberra; the Army Headquarters Survey Regiment at Bendigo (responsible for map compilation , drawing and printing); a Field Survey Depot (map stocks and air photography library); four Field Survey Sections; and a School of Survey.
4. The State Lands Departments
VICTORIA : In 1944 Cabinet approved of a State Aerial Survey. The responsibility for aerial photography and mapping in the State was given to the Department of Crown Lands and Survey. A contact was let for the aerial photography of the western half of the State and orders placed in Switzerland for five A6 stereoplotters and in Great Britain for a stereocomparator. There was no separate organisation set up; the work was commenced by existing staff of the Department supplemented by the appointment of a Chief Photogrammetric and Survey Research Officer, 14 junior draughtsmen and a number of cartographic assistants with army experience in the drawing and reproduction of topographic maps. The programme at that time was for the production of photomaps at a scale of 1 : 15 840 and topographic maps at a scale of 1 : 31 680. The demand for maps has increased rapidly, and during the last 10 years emphasis has been given to project mapping and large scale base mapping. At present there are approximately 80 personnel engaged on map production.
TASMANIA : The Mapping Branch of the Lands and Survey Department was formed in 1944 to carry on the mapping of the State started by the Army during 1941-43 under the Emergency Mapping Scheme. The main activities now are topographic, project, and administrative mapping; aerial photography is carried out with the Department's own Wild RC-8 camera.
NEW SOUTH WALES : A mapping section was authorised in 1945, but there followed a period of research and investigation into modern techniques and equipment before the Central Mapping Authority (CMA) was established. The CMA is part of the Department of Lands, and carries out topographic and cadastral mapping and the production of photomaps.
WESTERN AUSTRALIA : The first serious approach to topographic mapping was made in conjunction with the Army during the last war, and was directed to the production of a 10 mile scale Topographical Series for defence purposes. After the war, the increased demand for maps led to the introduction of aerial photos into the Chief Draftsman's Branch in 1949. The expansion of the work of the Branch to include topographic mapping by photogrammetric methods was officially recognised in 1954, when it was reconstituted as the Mapping Branch.
SOUTH AUSTRALIA : A Photogrammetric Section was established in the Department of Lands in 1949; until 1951 mapping consisted mainly of the preparation of planimetric maps and mosaics. In 1952 the Department commenced its own aerial surveys, with its own aerial cameras and a chartered aircraft.
QUEENSLAND : In 1947 the Surveyor General recommended the purchase of one Wild A5 and one A6 stereoplotter; this equipment, together with an SP3 Multiplex was received in 1950. By 1959 a Wild A8 stereoplotter and two Multiplex APUs had been added, and Cabinet approved the expansion of the Topographic Branch, which now comprises thirty office staff and five field staff, while equipment includes ten stereoplotting machines. There is an extensive standard mapping programme, but this has been severely curtailed because of pressing special project requirements.
5. Miscellaneous mapping establishments.
The Department of Navy, Hydrographic Service, RAN
Being responsible for hydrographic surveys, this organisation does not produce any topographical maps.
The Department of Interior, Survey Branch
This branch is not concerned with the production of topographical maps, and is responsible mainly for large scale cadastral and engineering mapping in the Australian Capital Territory.
Other Departments
Maps of many types, including some topographical maps, are produced throughout Australia by Departments of Forestry, Agriculture, Mines, etc., as well as by various public works authorities. As these do not contribute directly to the national topographic map series, they are not considered here; in passing, mention should be made of the important series of topographic maps produced by the Photogrammetric Section of the Snowy Mountains Authority. These maps, at 1 inch and 4 inches to the mile scales, cover more than 5 000 square miles of rugged country in the Snowy Mountains, and are basically produced for the hydro-electric scheme requirements.
THE DEVELOPMENT OF THE POST WAR SERIES
The First Stage 1945 - 1956
During the period of post war reorganisation there was an increasing awareness of the value of, and the need for, a national geodetic survey and mapping programme. The rapid development of Australia at this time in terms of resources investigation and special projects brought about the planning and implementation of such a programme, and with it the current family of topographic map scales developed.
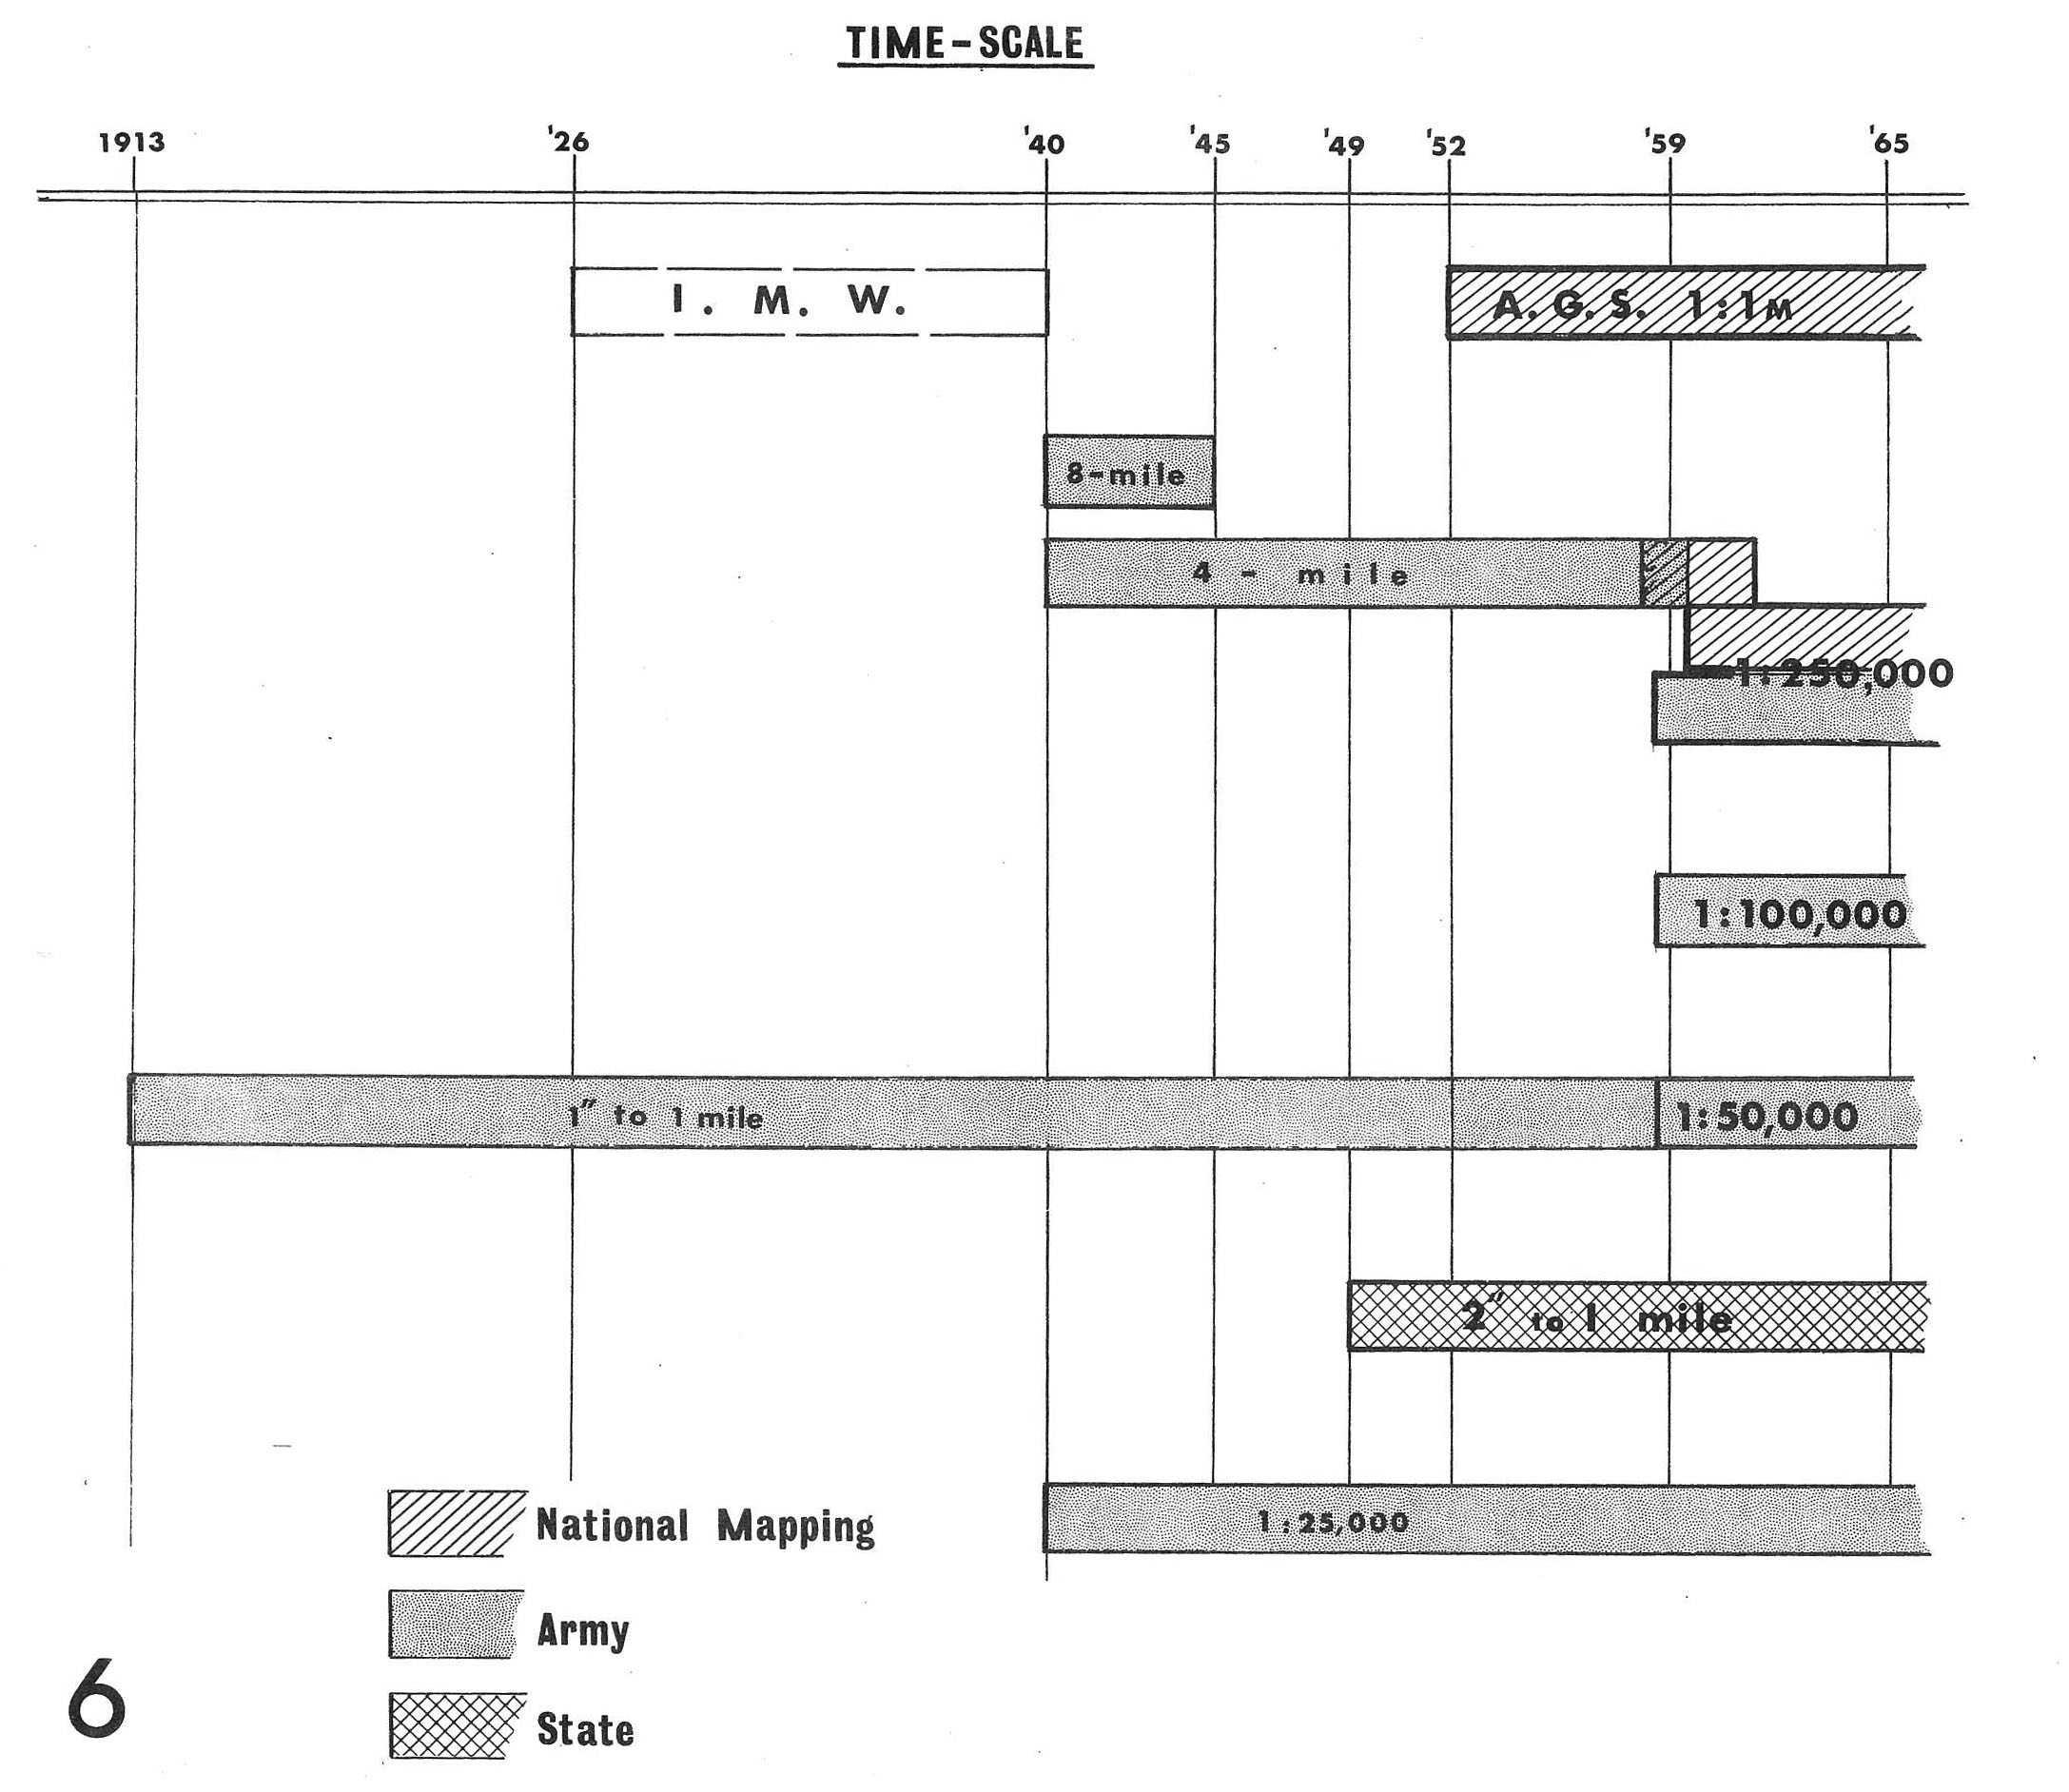
The post war development of these maps is outlined below by way of introduction to Part II of this book, which is a detailed description of the current series. Figure 6 shows this development in diagrammatic form.
Following the formation of the International Civil Aviation Organisation (ICAO) in 1947, the National Mapping Office, Department of the Interior, became responsible for the preparation of the World Aeronautical Chart (WAC or sometimes ICAO Chart) at 1 : 1 Million scale to the ICAO specifications. In 1952 it was decided to publish separately a topographical version using the WAC/ICAO material as a basis, and simply leaving off the aeronautical data. This new series was named the Australian Geographical Series 1 : 1 Million scale.
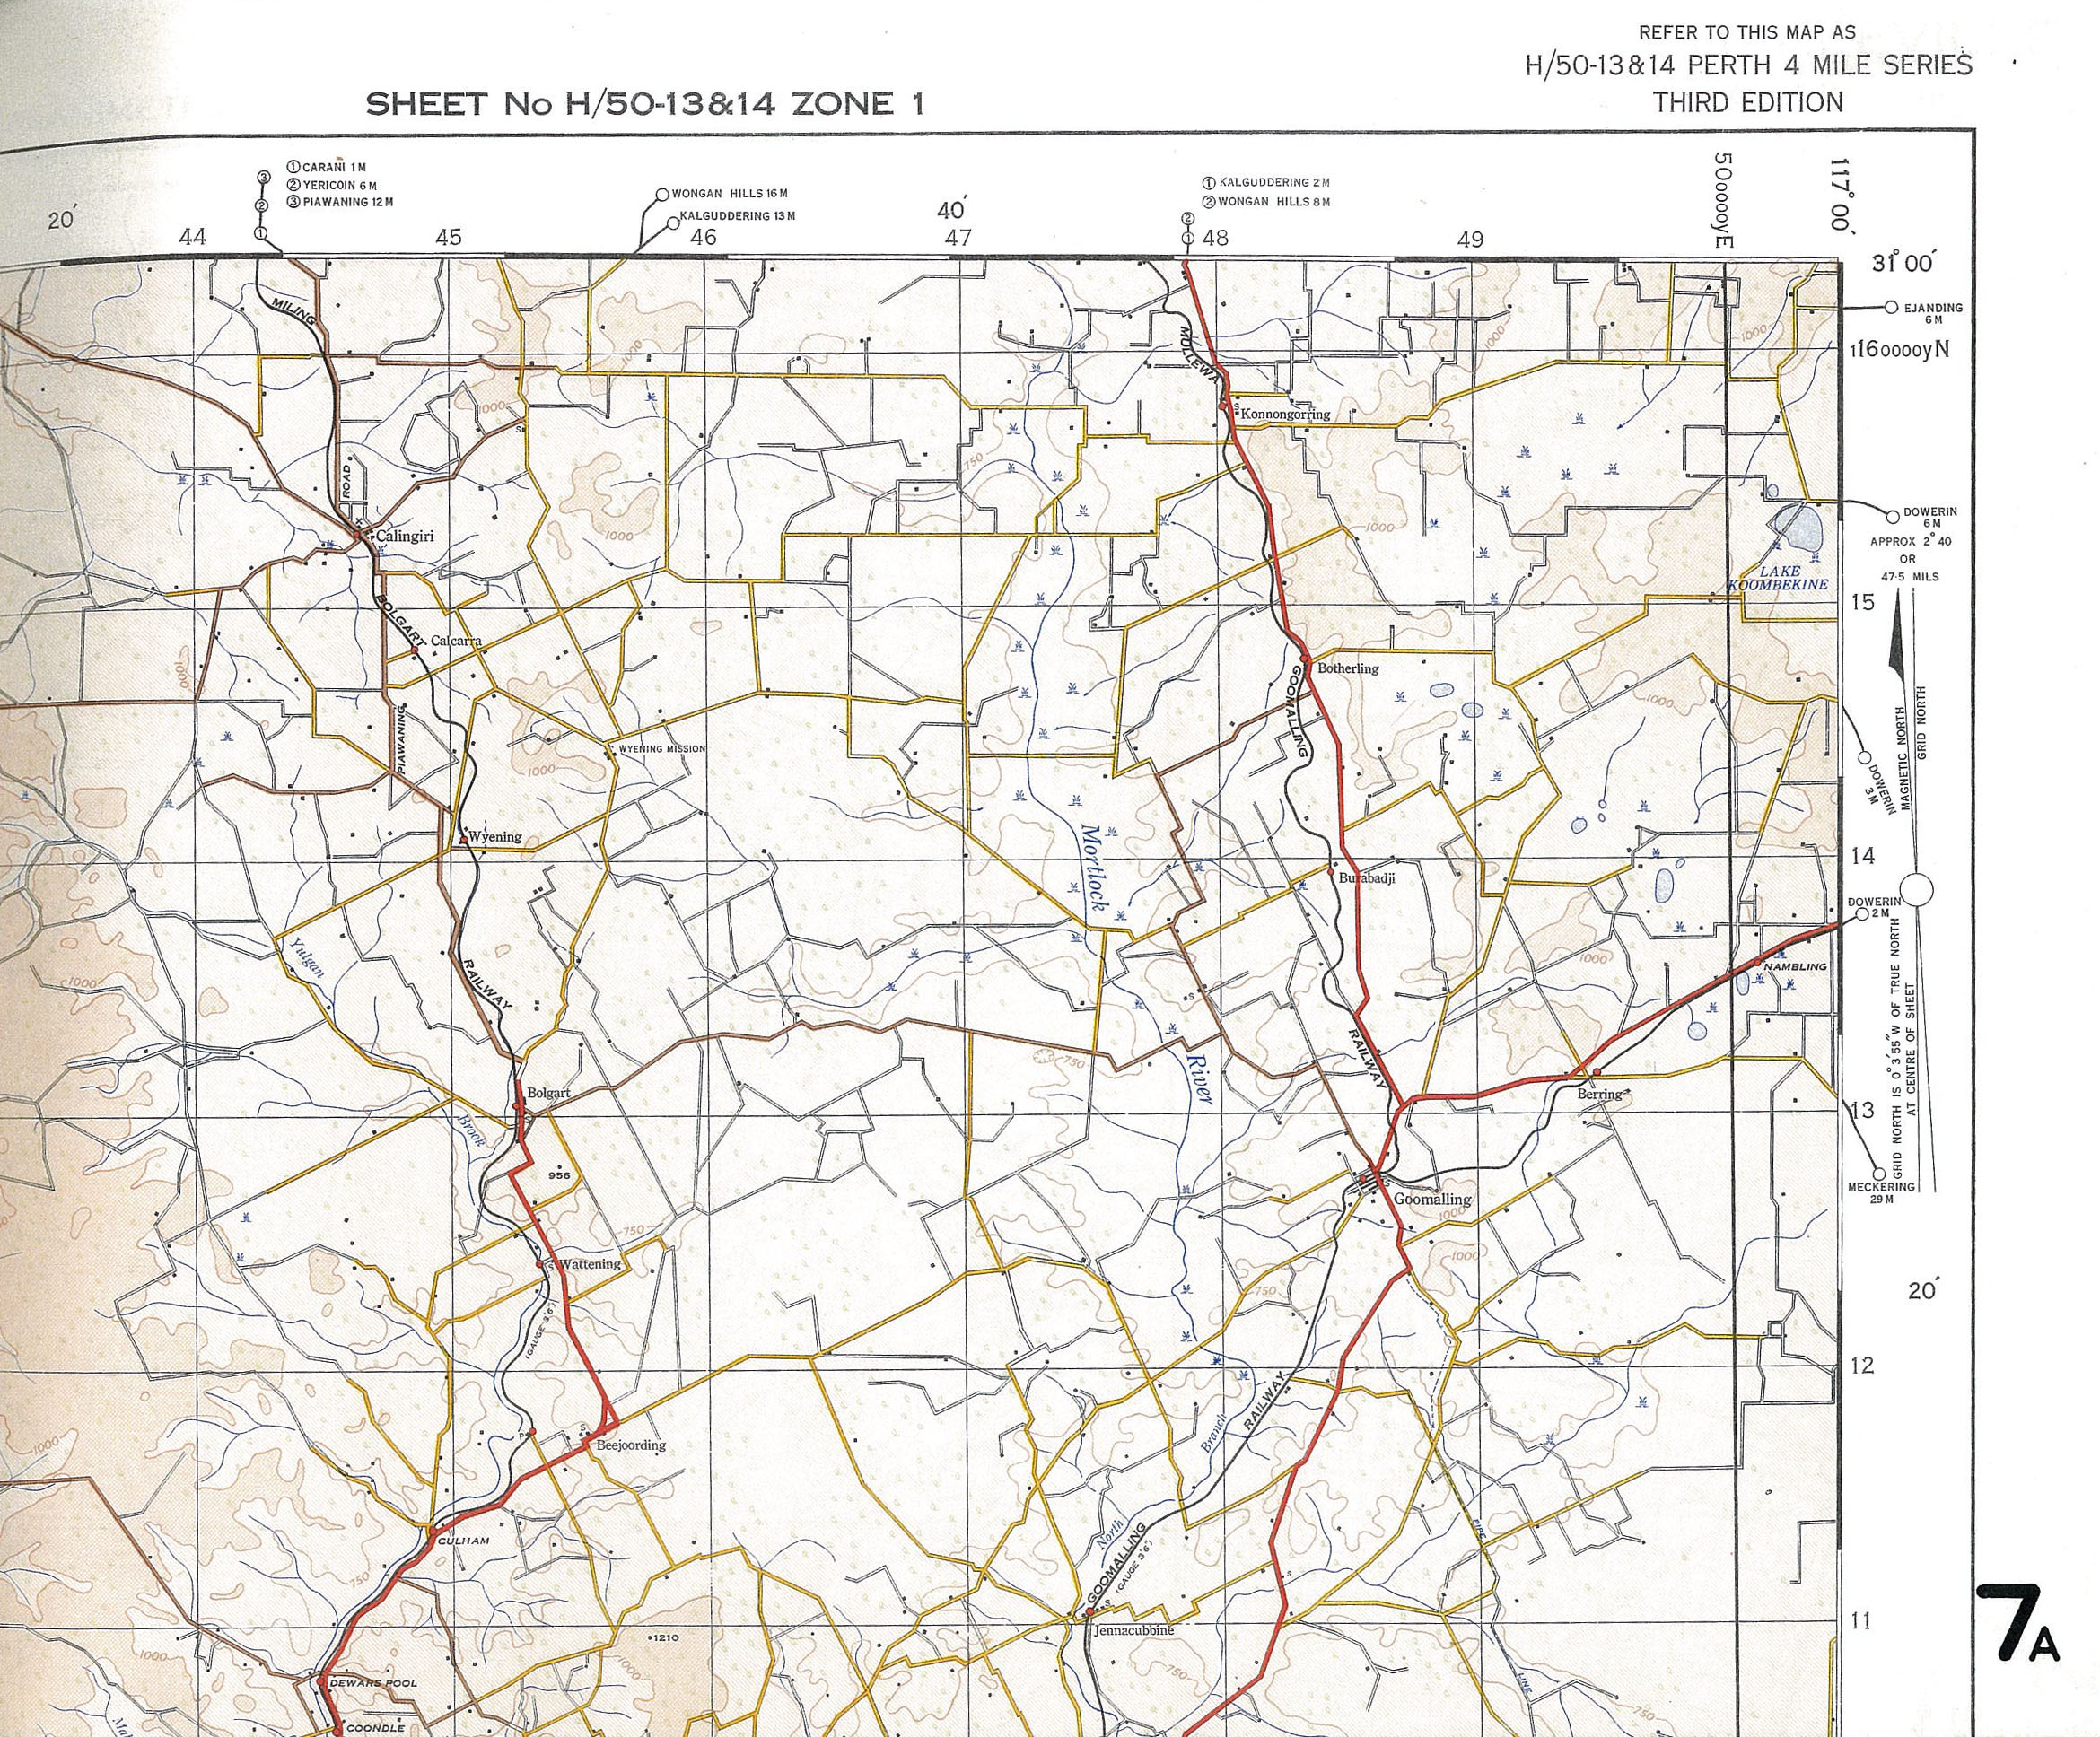
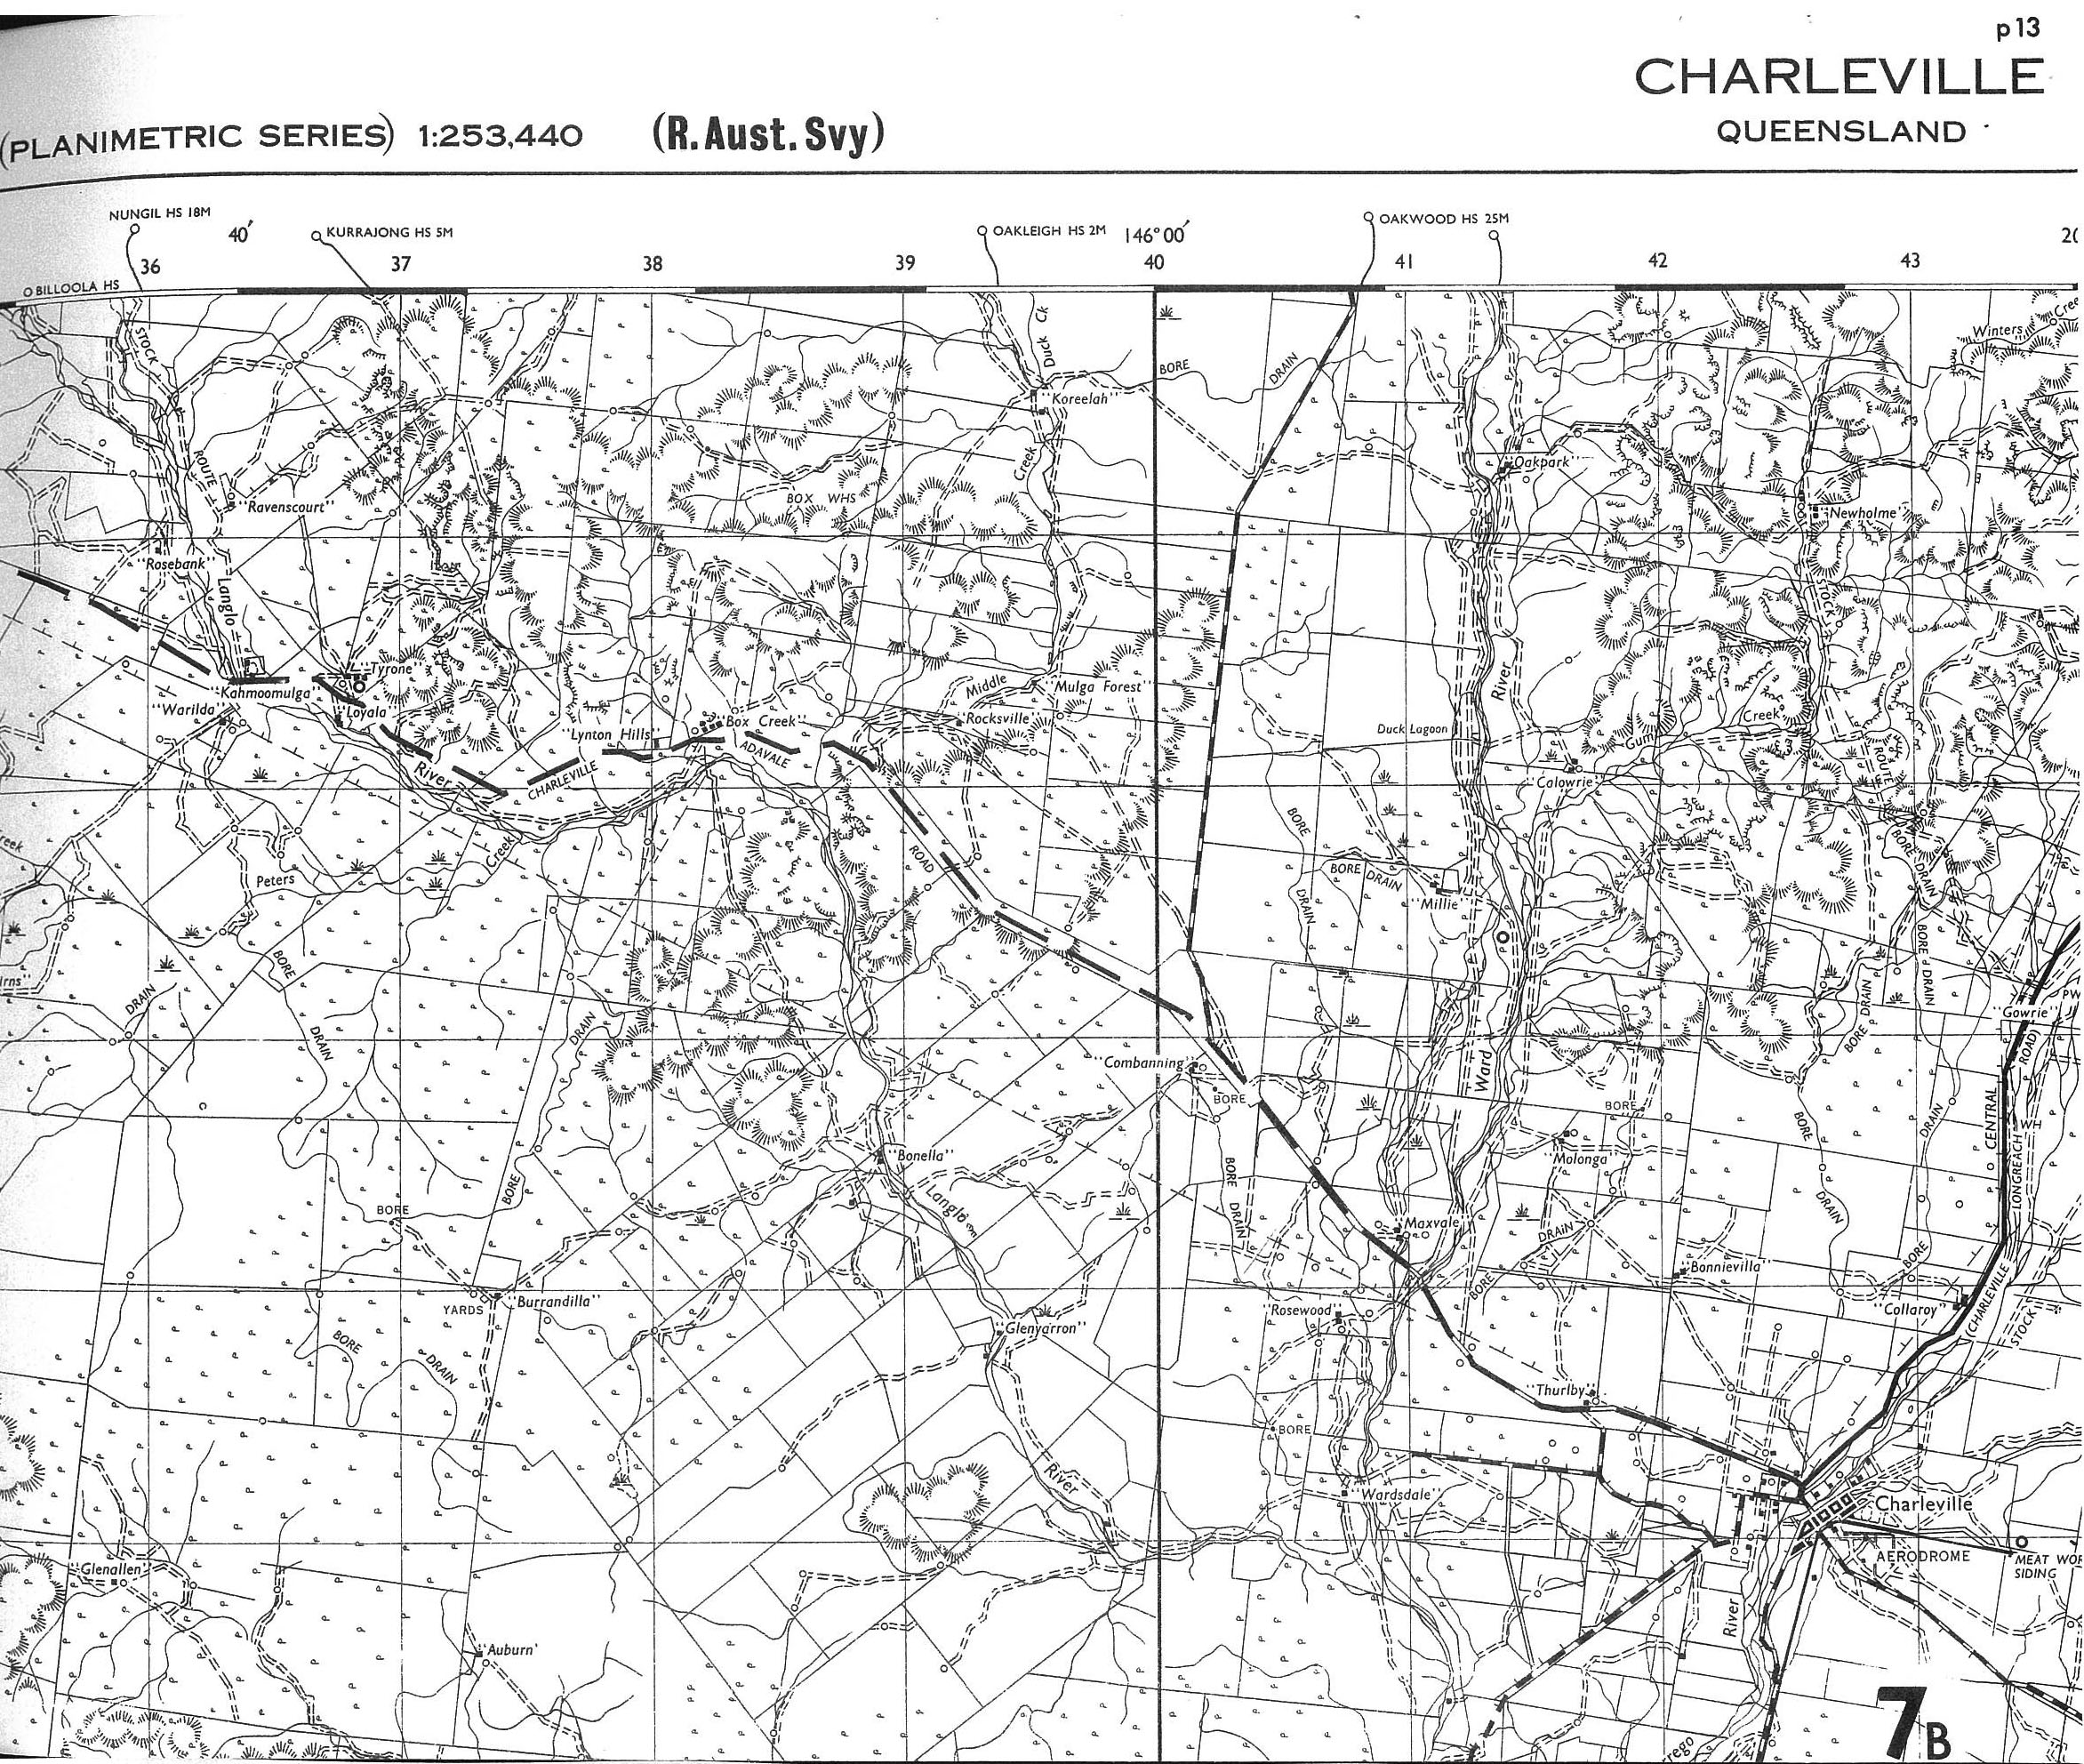
The Army continued mapping after the war at 1 : 253 440 (4 miles to 1 inch scale); some sheets were reprints of the war time editions, but later the presentation was considerably improved. Between 1948-1958 ten contoured, full colour sheets were produced under the title AUSTRALIA 1 : 253 440. Figure 7a is an extract from one of these maps. Twelve black and white hachured sheets were also published between 1957 and 1961, under the title AUSTRALIA (PLANIMETRIC SERIES) 1 : 253 440. Figure 7b is an extract from one of these 12 maps.
78 First, Second or Third Editions of the 1 mile scale series were published by the Army between 1946 and 1959, when the series was finally superseded by the 1 : 50 000 scale series. The maps are of a high standard, and cover the coastal areas where settlement and development are concentrated, and a typical example is seen in Figure 7c.
In 1944 a scale of 40 chains to the inch was adopted for a large scale topographic series to meet the specific needs of various State departments in developmental projects. This series, now designated the 2 inch Standard Topographic Series, is a task common to all the State Lands Departments. Victoria published the first sheet in 1949, and to date the States have published between them some 300 sheets, including provisional editions (provisional editions have appeared in different States at various scales; 1 inch to 1 mile, 1 : 25 000 etc. Only in the last few years were all editions standardised at 2 inches to the mile scale, and even now consideration is being given to the complete change over to the appropriate metric scale for this series.
The Military Survey 1 : 25 000 scale - (the topographic series for artillery purposes commenced in 1941) - was also continued, and still exists. It is still subject to security restrictions, and no information concerning it may be included here.
The Second Stage 1956 - 1961.
1956 was a significant date in the story of Australian mapping, following increased attention to the general world swing towards metric scales. International agreements on map standardisation among the Allied Forces led directly to the Australian Army Survey decision to adopt in principle the 1 : 250 000; 1 : 100 000 and 1 : 50 000 family of scales as being most suited to modern user requirements. There were other equally strong factors favouring such a change :
|
i |
the need to standardise sheet sizes so that they would all be within the capacity of the mobile printing presses available to military field units;
|
|
ii |
the desire to standardise map symbols, format and numbering systems to resemble more closely the established series of other Allied Forces, notably the United States Army Map Service;
|
|
iii |
the fact that the metric scale, and eventually the metric grid, would better suit modern artillery equipment;
|
|
iv |
the fact, no less important than the others, that such a change was clearly inevitable and that therefore it would best be made while map coverage over Australia was still relatively small. |
A pilot sheet (Mildura West 1 : 50 000 scale) was compiled in 1956, and proved a successful experiment for publications at the metric scale. As this sheet was a provisional production, subject to any modifications required to ensure its suitability for civil as well as military use, several years elapsed before the new scales were exclusively adopted. This period also saw the introduction by the Director of Military Survey of the scribing technique in map drawing; the Mildura West sheet was probably the first Australian map to be drawn in this way.
In 1958, the need for maps resulting from the increasing activities in resources surveys and developmental schemes was so urgent that the first truly national mapping programme was initiated by the National Mapping Council. This called in the first place for an increased output in 4 mile mapping (the metric scales had not then been finally adopted), which introduced the Division of National Mapping's COMMONWEALTH TOPOGRAPHIC SERIES 1 : 253 440. The first sheet - Tennant Creek - was published in September 1958 in four colours, and depicted relief by 250 feet contours supplemented by hill shading and spot heights. This was followed not by similar editions, but by black and white Provisional Editions, showing relief by spot heights alone – Figure 8 shows part of the Atherton Sheet. 48 such sheets were published up to July 1961, when the series was superseded.
In 1959, the National Mapping Council decided that the complete change to metric scales should take place, and the Division embarked on the current Planimetric Series at 1 : 250 000 scale. At about the same time, the Army replaced the 4 mile series by the 1 : 250 000 scale Topographic Series, and the 1 mile series by the 1 : 50 000 scale series. By 1961 a number of 1 : 100 000 scale maps had also been produced.
The Third Stage 1961-1965
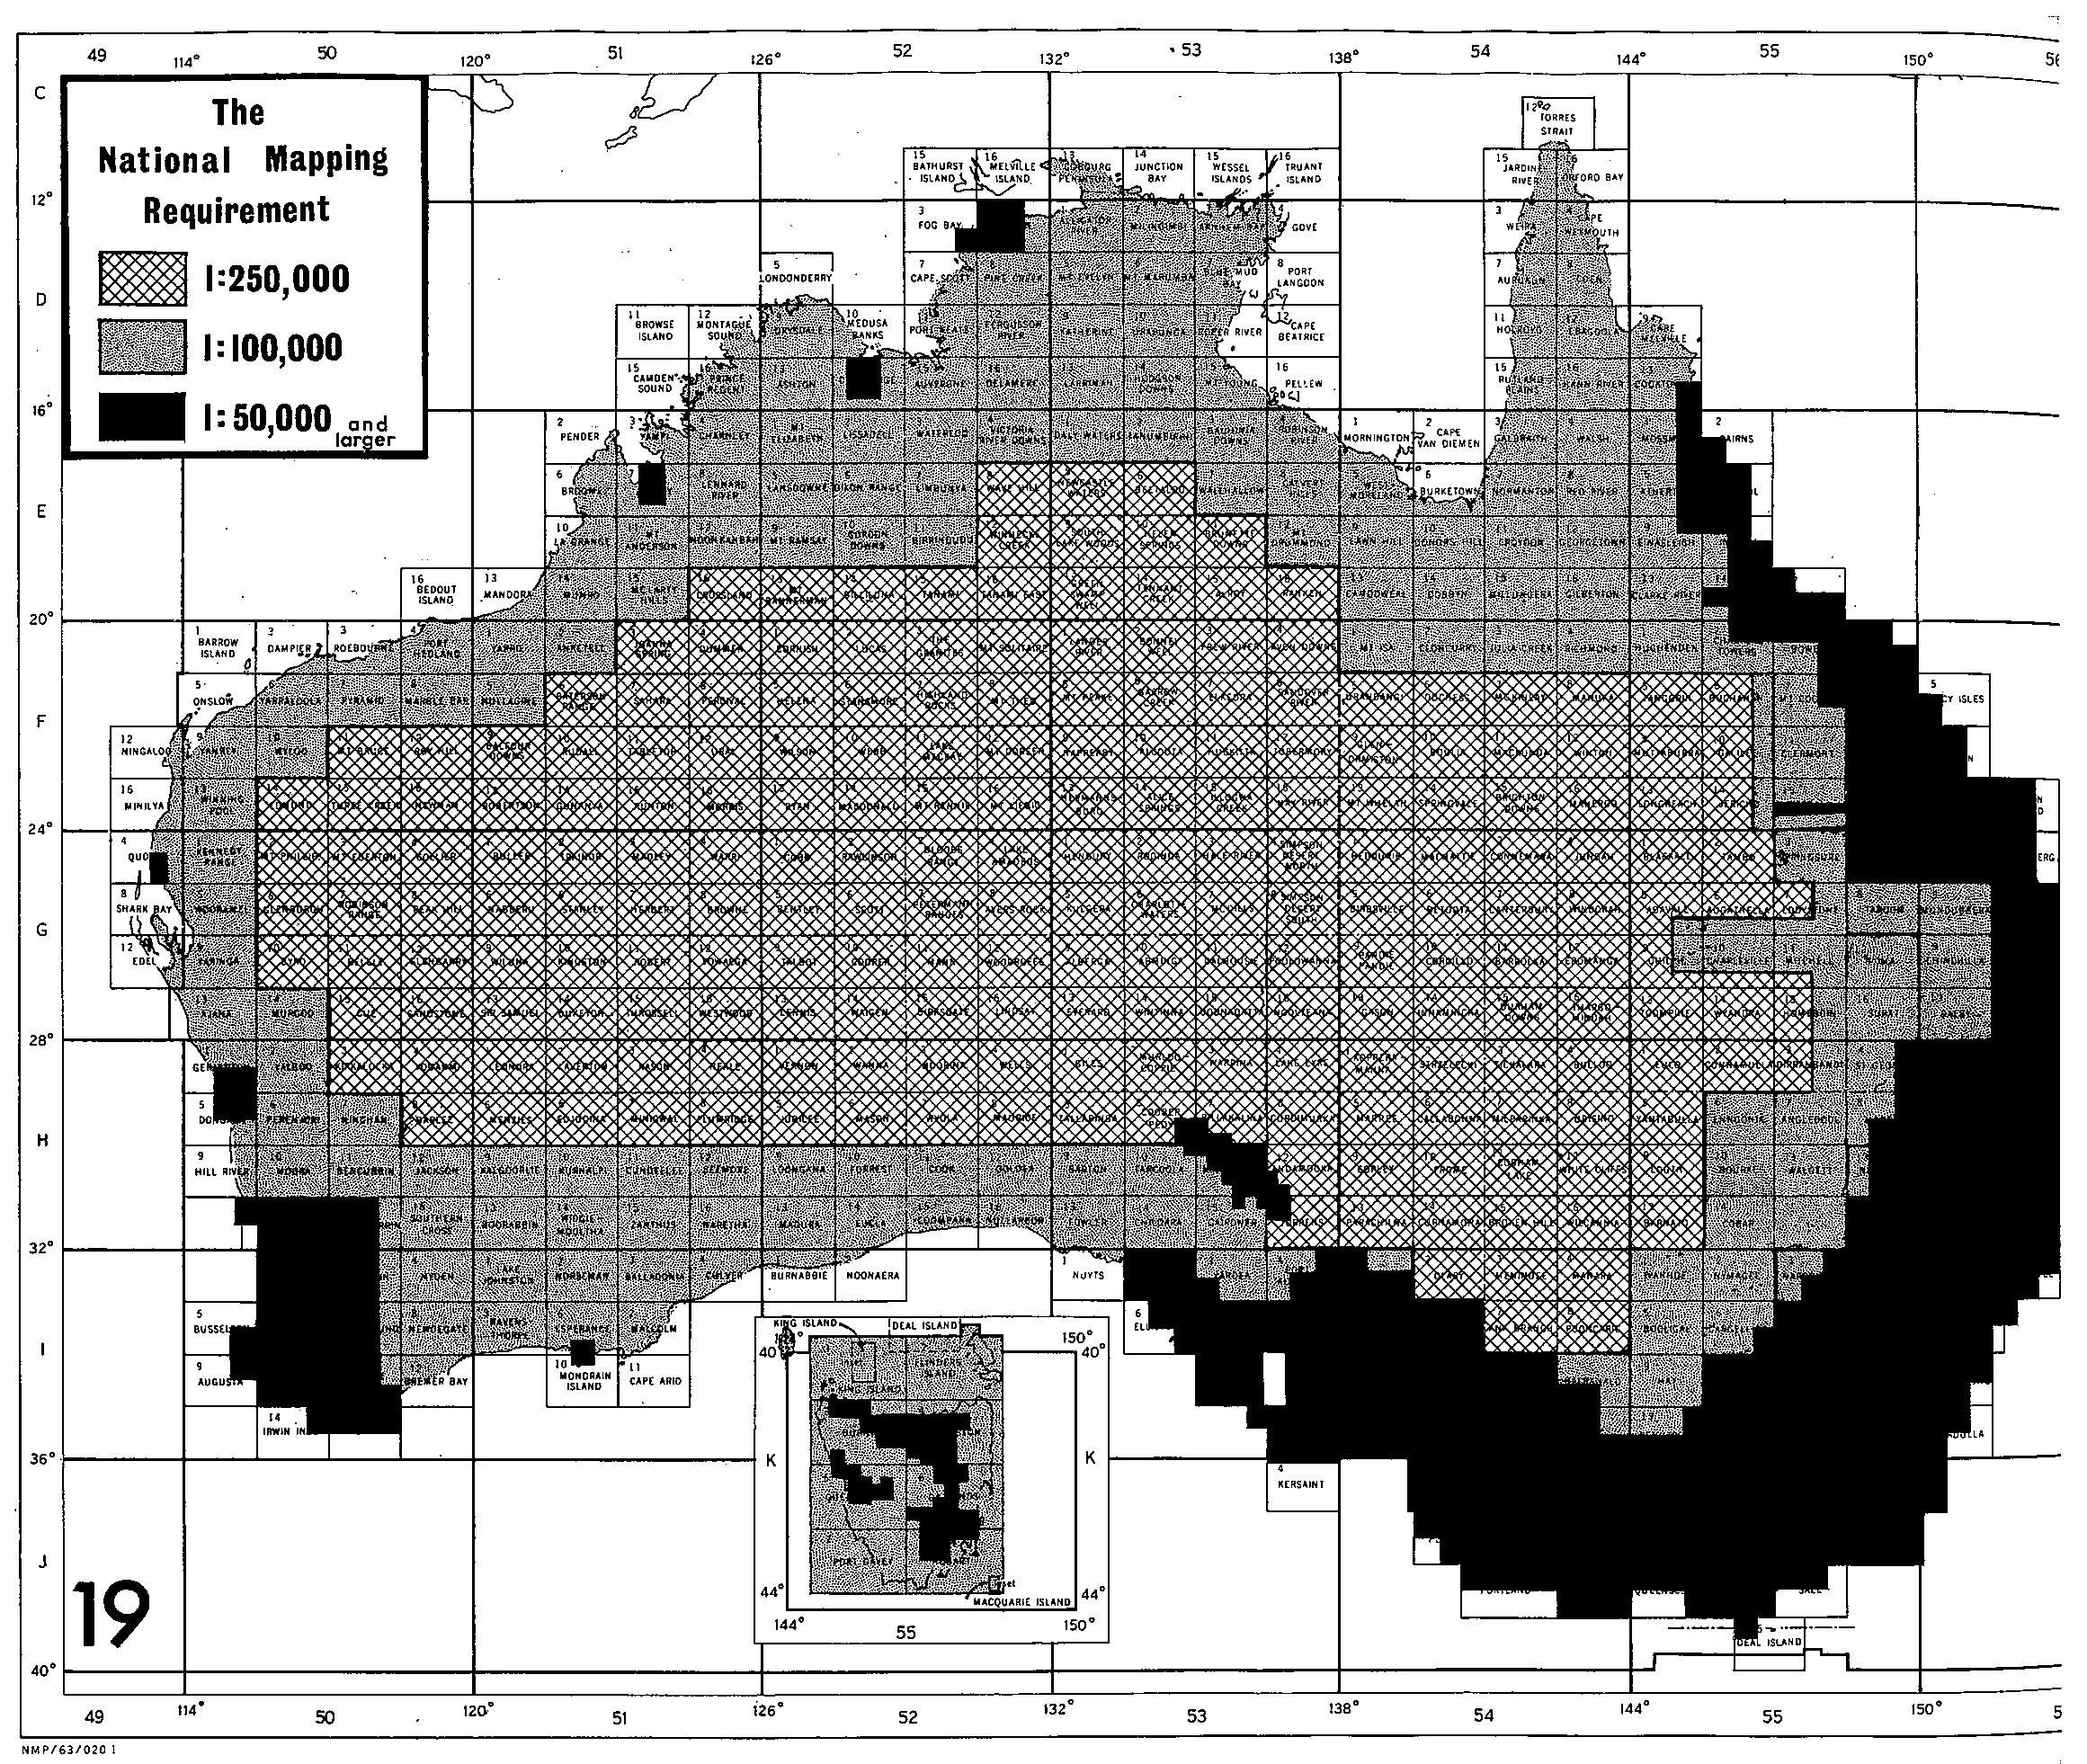
Recently, the urgent need for maps - for many years a pressing one - has sharply increased with the tension in international affairs in South East Asia, with the intensive search for minerals and oil, and with ambitious agricultural and irrigation schemes. The race to provide adequate maps is well under way, the new group of metric scales has been established, and the national mapping requirement formally laid down.
Early in 1963, new specifications were adopted for the 1 : 1 Million AGS with the object of bringing it in line as far as possible with the International Map of the World. In the 1 : 250 000 scale field, the Army and National Mapping are each committed to produce about 40 sheets a year, and are meeting this commitment in spite of the difficulty of the terrain and climate in the areas involved. In areas of special military or scientific significance, the Army is also producing priority maps at 1 : 100 000 and 1: 50 000 scales. The State organisations are continuing to produce priority sheets at 2 inches to 1 mile scale with the exception of Victoria which has adopted the 1 : 50 000 scale for this series. This decision follows a recent resolution by the National Mapping Council permitting, but not insisting upon, such a change.
This third stage, embracing the last few years up to the present time [1965], is represented by the next part of this book, being a description of the maps in the current national topographic series, which may now be tabulated as :
|
1 : 1 Million |
Australian Geographical Series |
|
Australia 1 : 250 000 scale |
Topographic (Contoured, R502) (#) Planimetric (Hill shaded, R501) |
|
Australia 1 : 100 000 scale |
Topographic |
|
Australia 1 : 50 000 scale |
Topographic |
|
State Standard Series 2 inches to 1 mile scale |
Topographic |
|
(#) The R502, 1 : 250 000 map scale series initially commenced around 1950 as the R501, 1 : 253 440 (4 miles to 1 inch) series. However, after some 23 map sheets were published metric map scales were introduced and these maps were subsequently converted to the R502 series at the 1 : 250 000 metric scale, the first sheets under the new system appearing in 1958-59. Production of the R502 map series commenced around 1956. For the most part the map sheets of this first national series are uncontoured. The Royal Australian Survey Corps and National Mapping were responsible for printing all of the map sheets with the first printing being done by RA Survey in 1956 and by Nat Map later in 1960. All sheet compilations were finalised by 1966 and printing of all the maps of the series was completed in 1968. |
|
Almost in parallel of the publication of this original text was the determination of the National Topographic Map Series (NTMS). Thus as the table above and descriptions presented below contain no mention of this series the following section has been added.
National Topographic Map Series (NTMS) [added 2021]
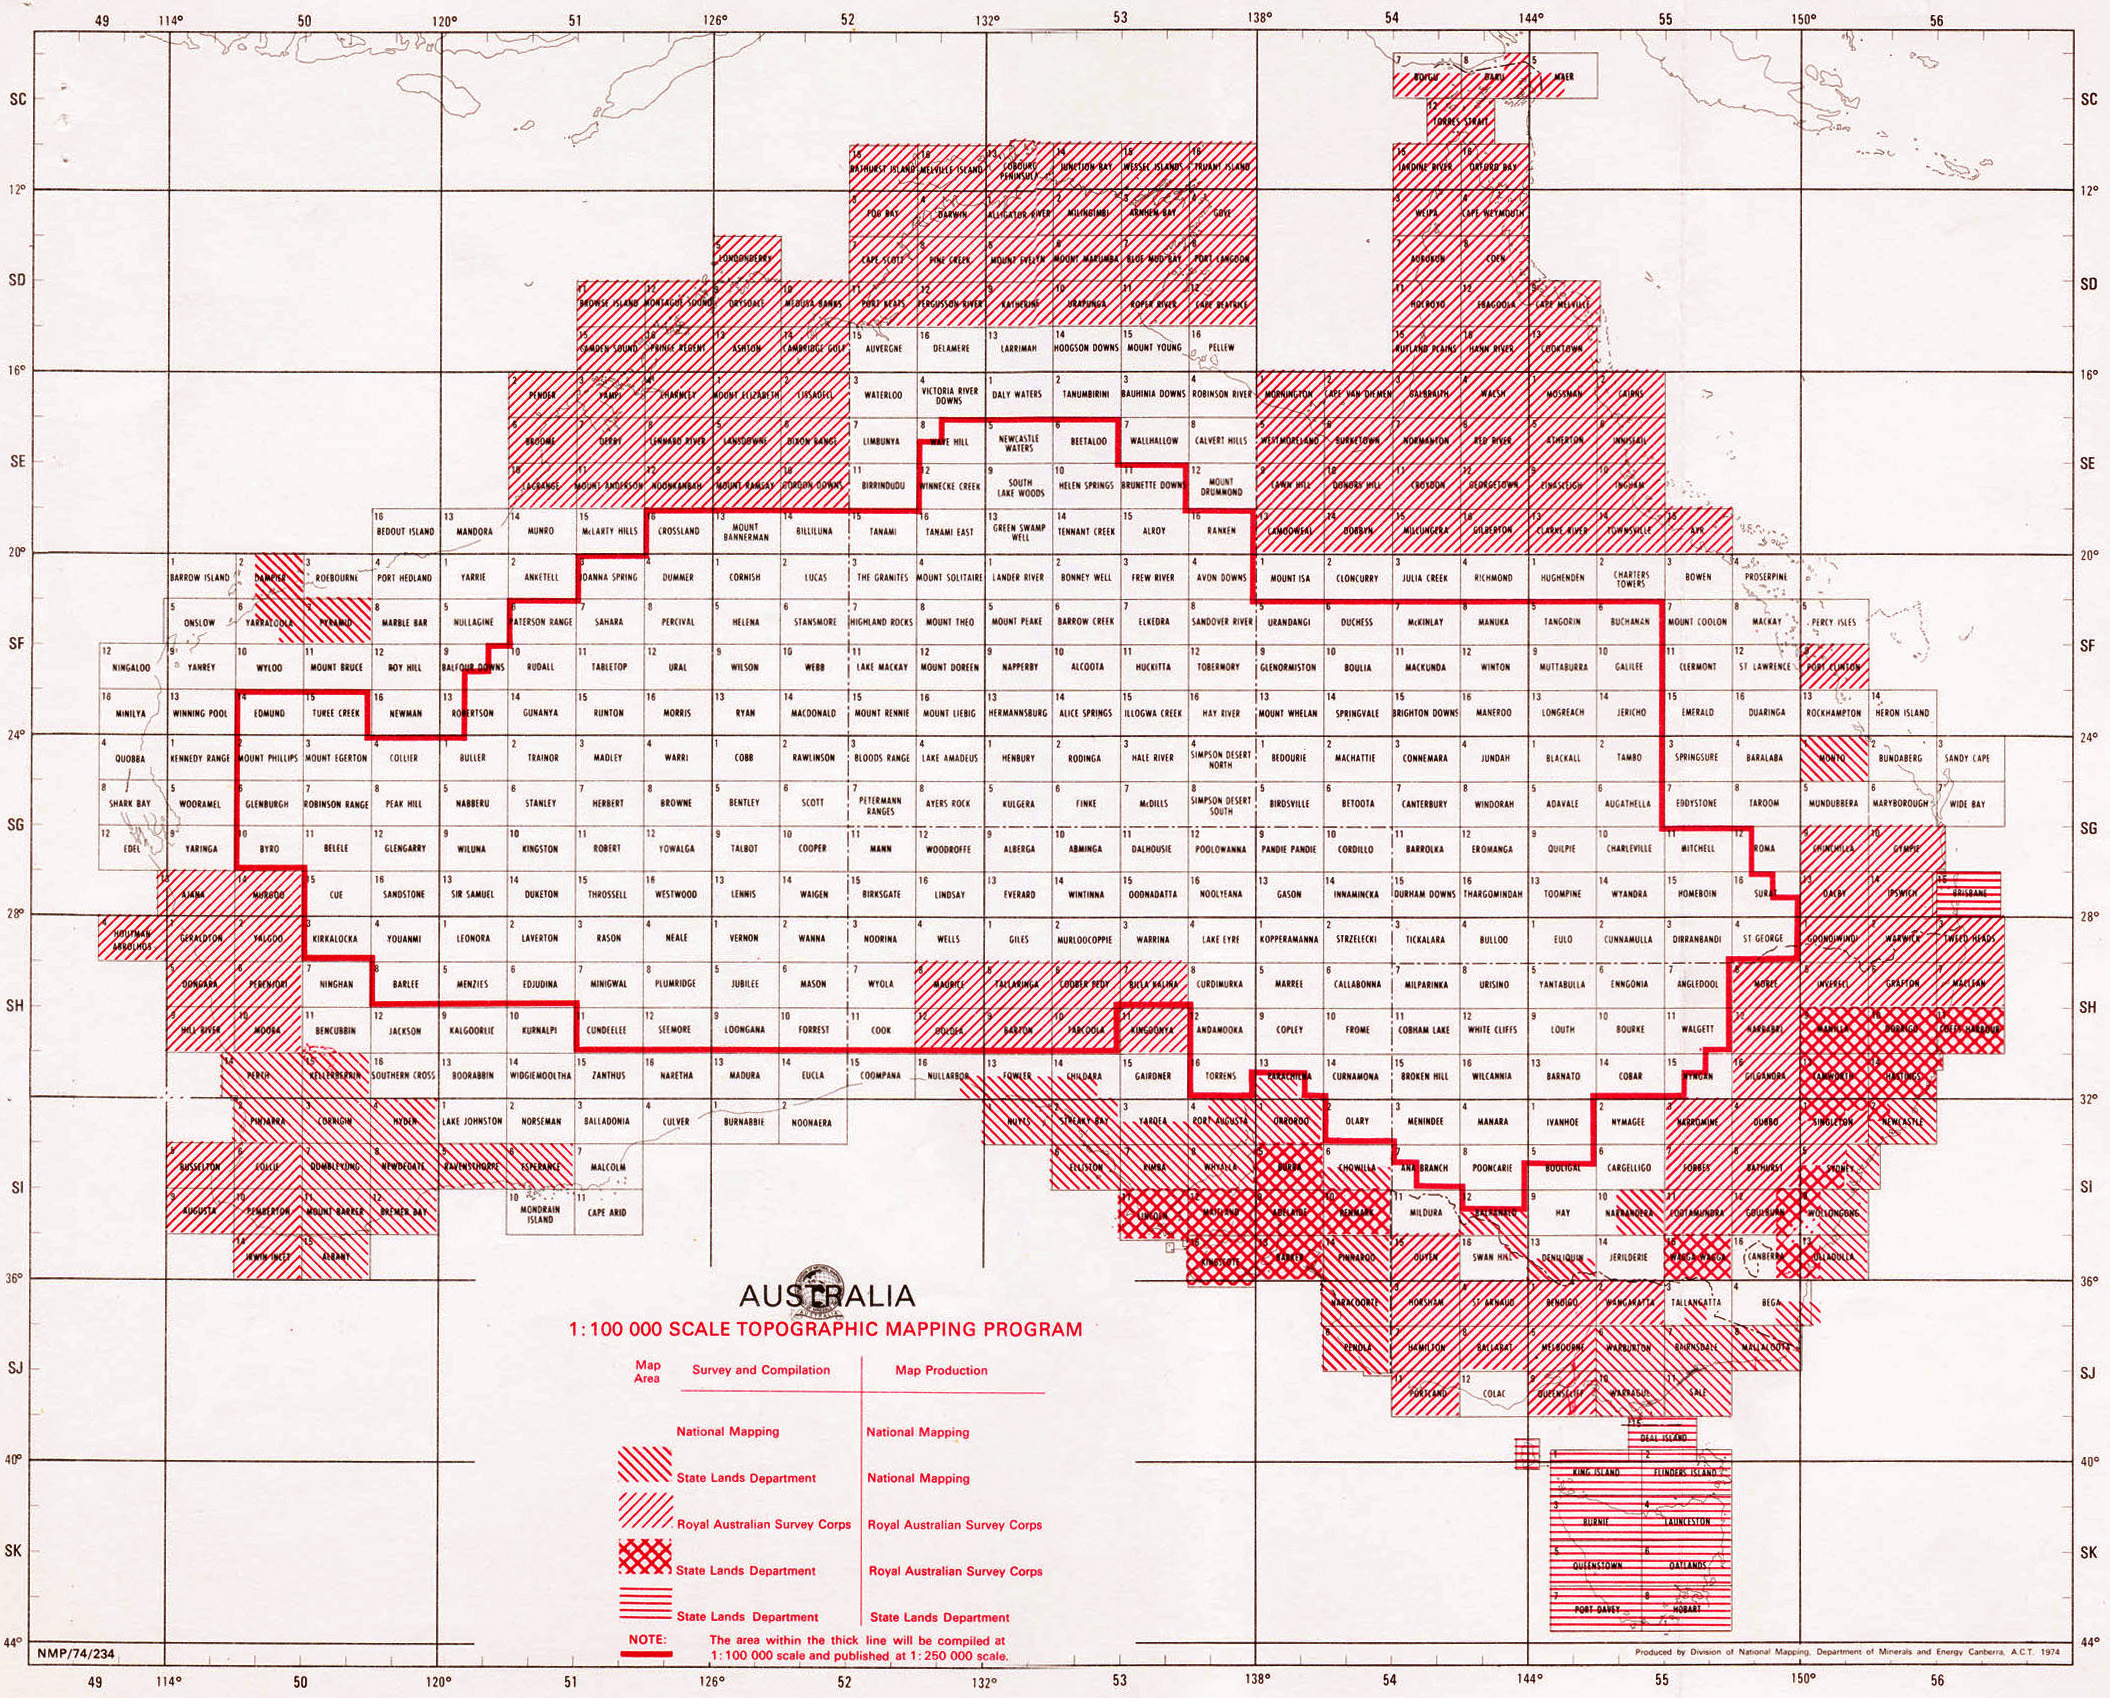
Even as the R502 series was being completed work on a new national series, the National Topographic Mapping Series (NTMS), commenced. This series of 1 : 100 000 and 1 : 250 000 scale maps would be fully contoured with the 1 : 250 000 maps being generalised from the six component 1 : 000 00 scale compilation material. In essence, for every six maps compiled seven maps could be published. The National Topographic Mapping Series was initiated in 1965. The initial program was for the publication of 3 062 1 : 100 000 scale map sheets. In 1974 the program was revised to having only 1 602 of these sheets (generally covering the more populated areas) printed as 1 : 100 000 scale topographic maps but now publish a new 1 : 250 000 scale series of 544 map sheets; this new map series would have contours shown at 50 metre vertical intervals, cover the whole of Australia and thus replace the R502 series. As the 1 : 250 000 scale mapping progressed, some predominately coastal map sheet coverage was expanded to include what would otherwise be small segments of terrain on a large blue map sheet. Such sheets were titled specials and reduced the original 544 to 516 map sheets. The NTMS publication program was completed in 1988. The NTMS was based on the Universal Transverse Mercator projection in metres and the latest specifications may be viewed via this link. The 1974 revision of the NTMS program also resulted in the National Mapping Council (NMC) members confirming their contributions to the program. The revised NTMS program and contributions was all summarised in what became known as the Red Line diagram. The area within the red line would be compiled at 1 : 100 000 scale but only published as line maps at 1 : 250 000 scale. The NTMS publication program was completed in 1988.
The Red Line diagram appears to be the only document which detailed the areas of survey and mapping responsibility of the Australian mapping agencies. The NMC had no role in coordinating the programs of the Commonwealth Government's Defence and Civilian mapping agencies. In broad terms the NMC's primary coordination role (at inception in 1945) was for the Director of National Mapping to be responsible for the co-ordination of the activities of Commonwealth and State authorities. The NMC was thus being guided by resolutions of the January 1945 meeting of the Commonwealth Survey Committee and State Surveyors General, that recommended the creation of the NMC and the position of Director of National Mapping, specifically : The expression 'coordination of the mapping activities of Australia' shall be subject to the recognised policy of the Services to control their respective mapping activities provided that where practicable the standard of all work shall be not less than the minimum requirements of the National Mapping Council. On page 283 of his 1992 book Australia on Paper, Joe Lines, former Assistant Director of the National Mapping Topographic Office, discussing the 1 : 250 000 scale, R502 series mapping program (mid 1950s-1968) stated : Army, consistent with its defence obligations, took responsibility for mapping the northern portions of the country, which of course included the then relatively unknown areas of much of Cape York Peninsula, Arnhem Land and the Kimberley region in Western Australia.it was appropriate for the Survey Corps to tackle the mapping of these areas as they had the logistic support of the Navy and RAAF on call, without having to experience the inevitable delays in coping with the unforeseen which a civilian department would have been obliged to bear. Although not mentioned by Lines, also apparently under the umbrella of defence obligations came the Woomera area and the balance of the areas around the State capitals.
This index shows the combined NTMS 1 : 100 000 and 1 : 250 000 scale printed Map Coverage, circa 2000.
PART II : A DESCRIPTION OF THE CURRENT SERIES
THE 1 : 1 Million scale AUSTRALIAN GEOGRAPHICAL SERIES
Background
In 1947 the International Civil Aviation Organisation came into being, and adopted the millionth scale for the World Aeronautical Chart (WAC). Standards and recommended practices for the ICAO Chart, more commonly WAC Chart, were adopted by Australia as a Contracting State in the Organisation, and preparation of the series was commenced at once by the Department of the Interior, for the Department of Civil Aviation.
In 1952 it was proposed to publish the topographic base as a separate series, to be known as the Australian Geographical Series. This was to be effected by using the ICAO/WAC Chart original drawings, with altered title and marginal data, for the AGS. in the form of stick-ups over the ICAO information. Many uses were found for the new series, which was immediately adopted for official use by the Department of Army.
In 1962 the Director of National Mapping ordered that a working specification be drawn up for the AGS to conform as far as practicable with both the International Map of the World and ICAO specifications, as well as to permit ready and economical printing of the AGS maps at the same time as the major revision of the ICAO/WAC series, i.e. every four years. In spite of the fact that this appeared to be an attempt to make one map satisfy two quite different needs, a minimum treatment specification for the conversion of the ICAO material for production of the AGS was drawn up, and put into effect early in 1963. Only minor alterations were made apart from the change of title and sheet number, and the addition of the note :
This series of maps is a temporary substitute for the corresponding sheets of the International Map of the World. (Most sheets in this series are republished, with minor alterations, by the US Army Map Service under the title World (South Pacific) 1 : 1 000 000 scale, material being made available to them through the Australian Army).
In 1962 the International Map of the World (IMW) series replaced the AGS. The IMW formed the topographic base which was overprinted with the aeronautical information from the then Department of Civil Aviation to produce the full specification ICAO/WAC. The Australian IMW series was completed in 1978 but was discontinued in 1987.
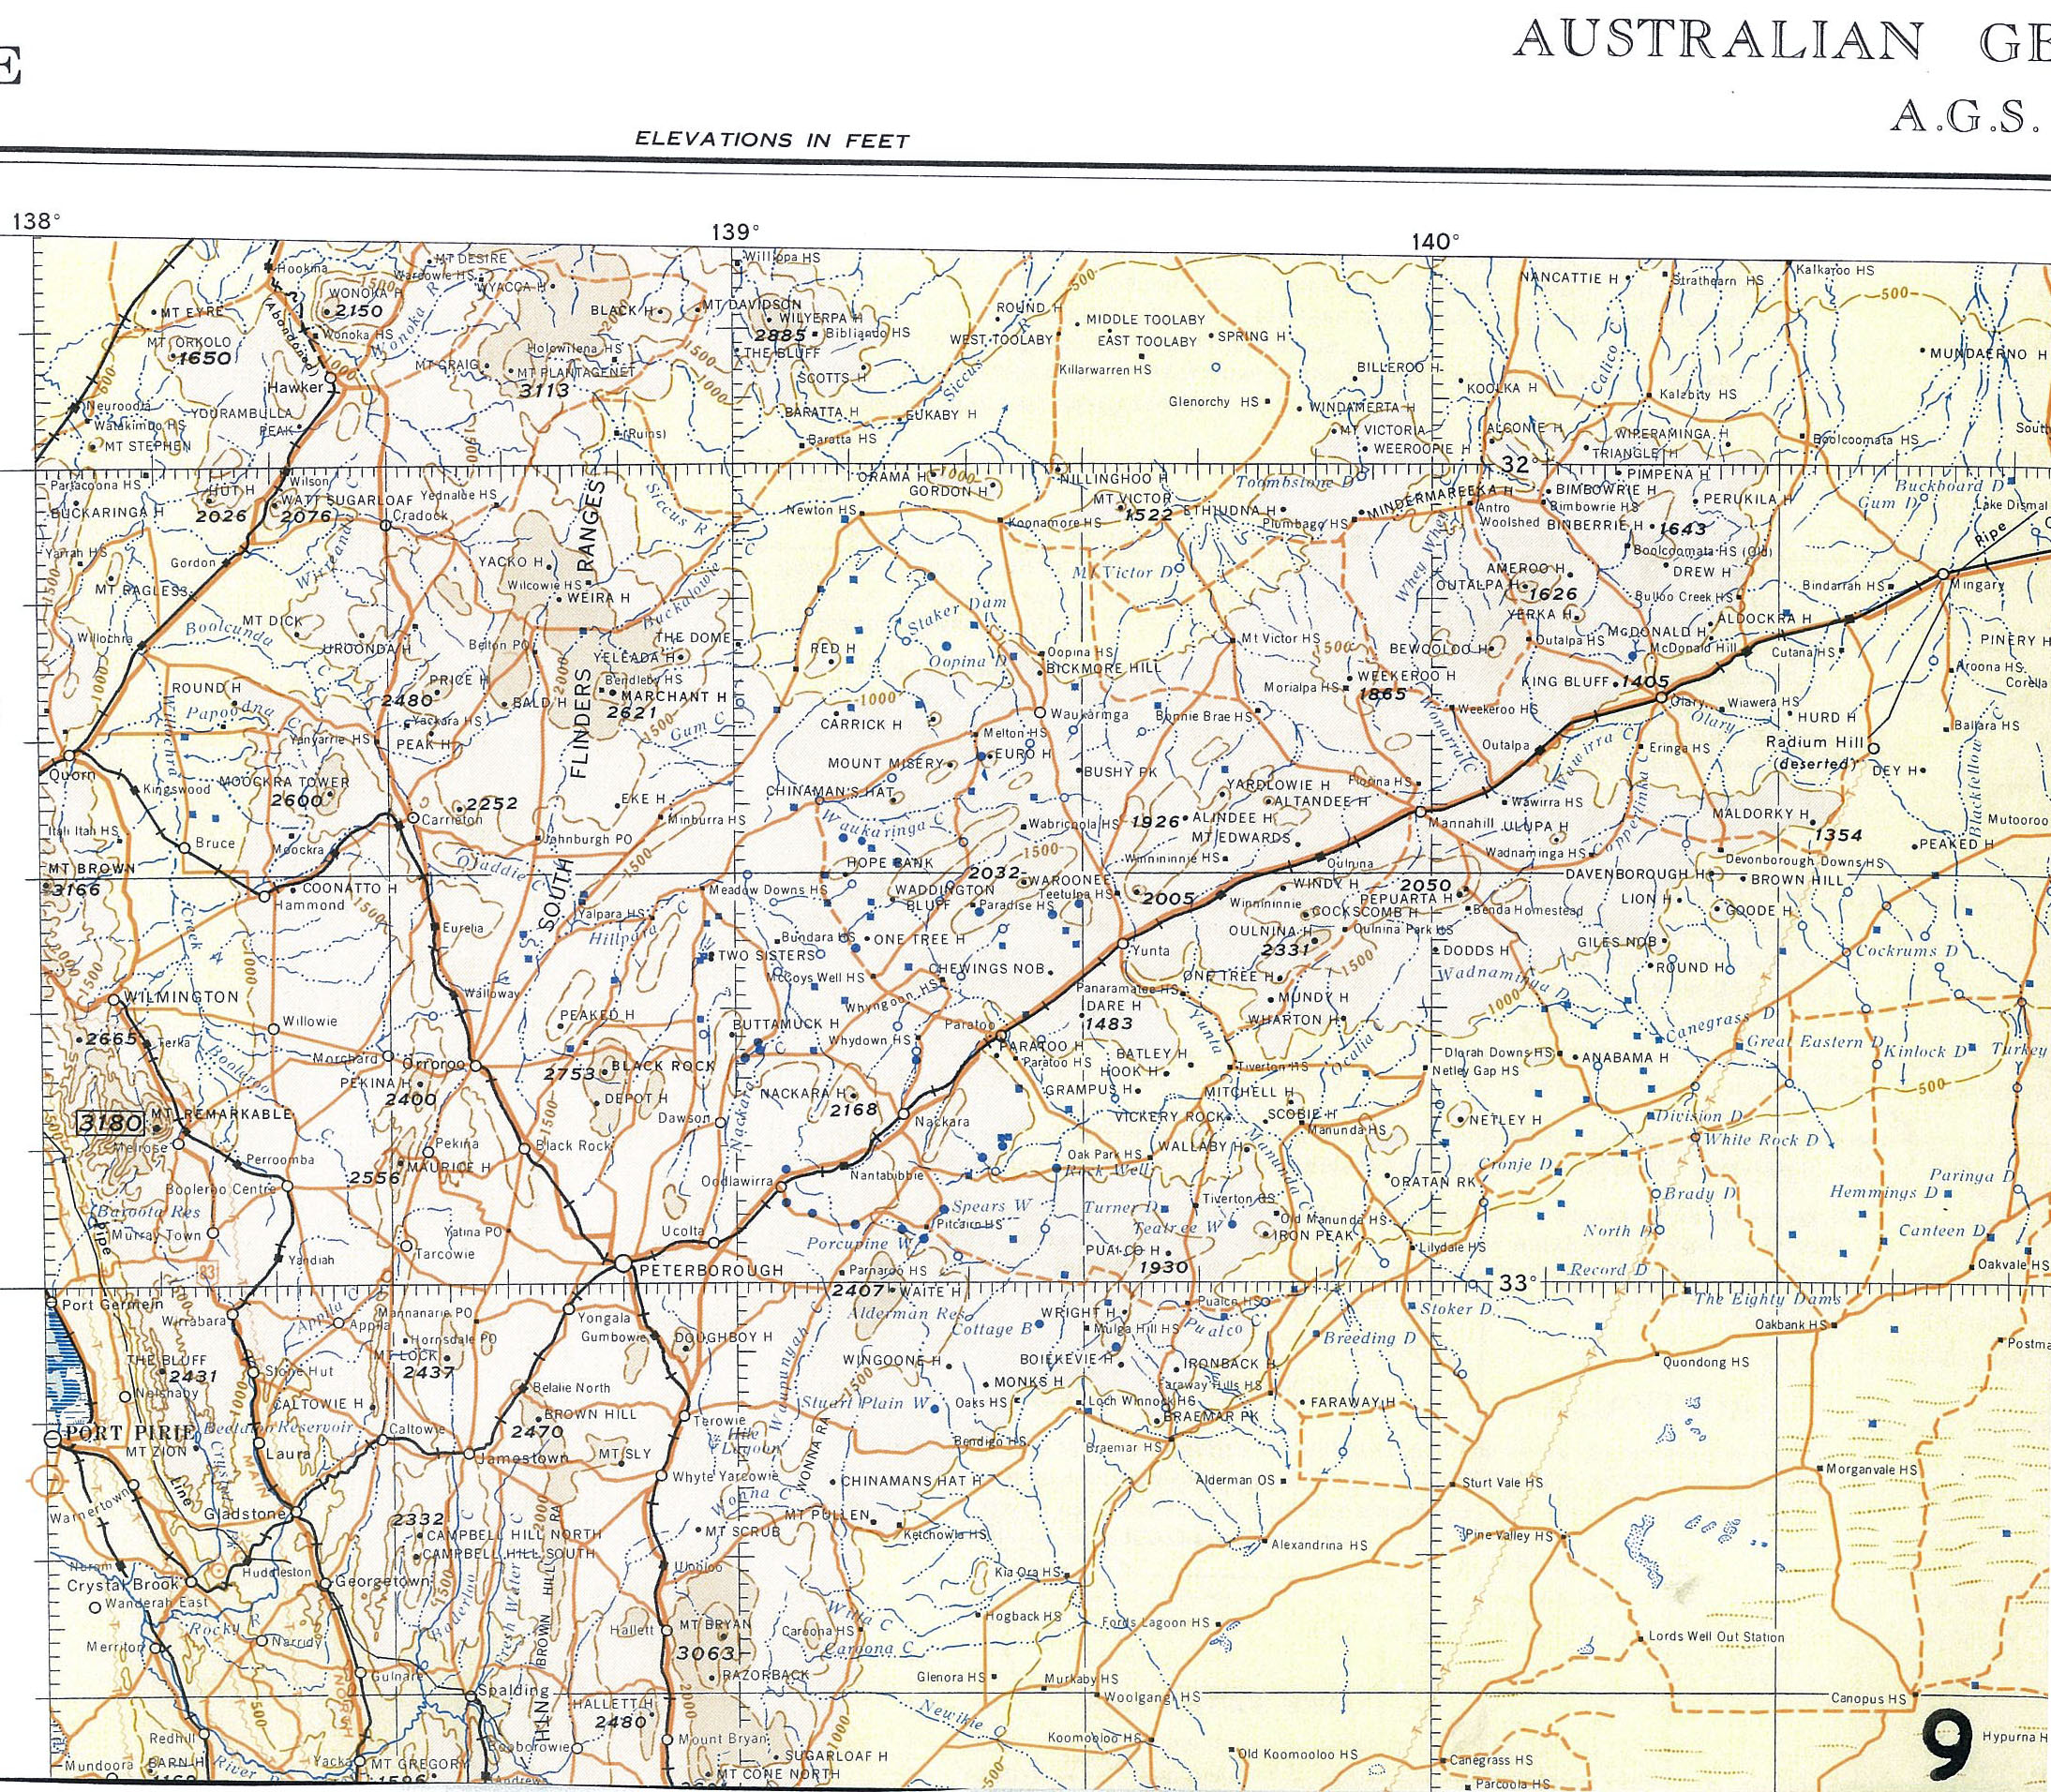
Figure 9 shows part of a recent Second Edition of an AGS sheet.
General description
Current editions of the AGS have a conventional appearance with a standard layout of marginal information, except for the legend, which is printed in light grey on the reverse of the sheet, together with an index to the series. The numbering system adopted is that of the International Map of the World, where the world is divided into areas of 4 degrees of Latitude by 6 degrees of Longitude, numbered westwards from 180 Longitude, and lettered north and south from the Equator; thus for instance, the Melbourne sheet becomes South J 55, usually shortened to SJ-55.
In accordance with the ICAO specifications for map sheets between the Equator and Latitudes 80 degrees the projection used is the Lambert Conformal Conic. The projection permits matching of sheets east and west, but there is a north south mission of 0.01 inches to 0.03 inches
The Standards and Recommended Practices adopted by the ICAO state :
The World Aeronautical Chart shall show the fullest information concerning both topography
and air navigation aids that can be portrayed without overloading.
Cultural detail compatible with the scale is shown conventionally, but it must be remembered that it is designed primarily as a base for a Chart, the principal function of which is to serve the requirements of visual air navigation. Hence, the amount of cultural as well as topographic detail is far less than would normally be expected in a general purpose geographical map at this scale. (Reference to the legend shows that most of the features are in the nature of landmarks useful to the air navigator).
Relief
Relief is depicted by contours, (generally at 500 foot intervals), approximate contours, or hill shading. Where control is insufficient for contours, or approximate contours, hachuring may be used. Layer (hypsometric) tinting is usually applied to contoured sheets.
Height values are of particular importance on the ICAO Chart, and it is standard practice to show the highest elevation on each sheet in a small framed panel cleared of tints and other detail. Ground heights are limited to the prominent topographical and cultural landmarks, and are therefore much less prolific than would normally be desirable on the topographical version, particularly along roads and rivers. Contours too should be regarded with caution, as their treatment tends, understandably, towards exaggeration of the values, and over simplification of local outline and minor irregularity.
It is an interesting exercise to compare an area hachured (on a First Edition) and contoured (on a Second Edition ) map sheet. Such a comparison frequently seems to illustrate the point that, as relief features are important landmarks to both air and ground users, it would be advantageous to retain hachures as supplementary to contouring, for they give a more immediate impression of terrain.
Other detail
All hydrographic detail compatible with the scale of the AGS is shown by conventional symbols, and includes lakes, non perennial rivers, waterholes, claypans, salt lakes, etc. It seems a pity that wooded areas are not shown; it would seem to be an advantage to both ground and air users to show at least those wooded areas which are permanent enough and isolated enough to rank as landmarks. Such areas could be depicted simply, by a black symbol, or by a light green symbol when that colour is already used for the lowest hypsometric tint.
Compilation and drawing
The AGS and ICAO is entirely a compiled map. The scale of compilation is 1 : 750 000, and as it is designed to be available as a base for other small scale mapping, as much detail is shown as is consistent with any mapping at that scale. Symbols and layout are in accordance with ICAO specifications.
Compilation starts with a thorough check of all the available control, and assembly and appreciation of the source material. The following material may be used :
Commonwealth & State topographic maps at all scales;
State County and Cadastral maps, various scales;
Other Government Departments' maps - notably Forestry and Mines;
Commonwealth Census Reports - a guide to size of town symbol;
Post Office Guides, Railway timetables, Commercial road maps;
Photomaps at various scales.
The State Lands Departments and the Department of the Interior are the authorities for nomenclature.
Reduction of the source material for compilation onto the graticule print is effected photographically or by precision pantograph.
Drawings are colour separated, still at 1 : 750 000 scale; the scribing technique is not employed, owing to the frequently large amount of alterations and revision. Each drawing, other than the black, is drawn as an overlay of the black - masks are fair drawn and photographed at the same time as the line drawings.
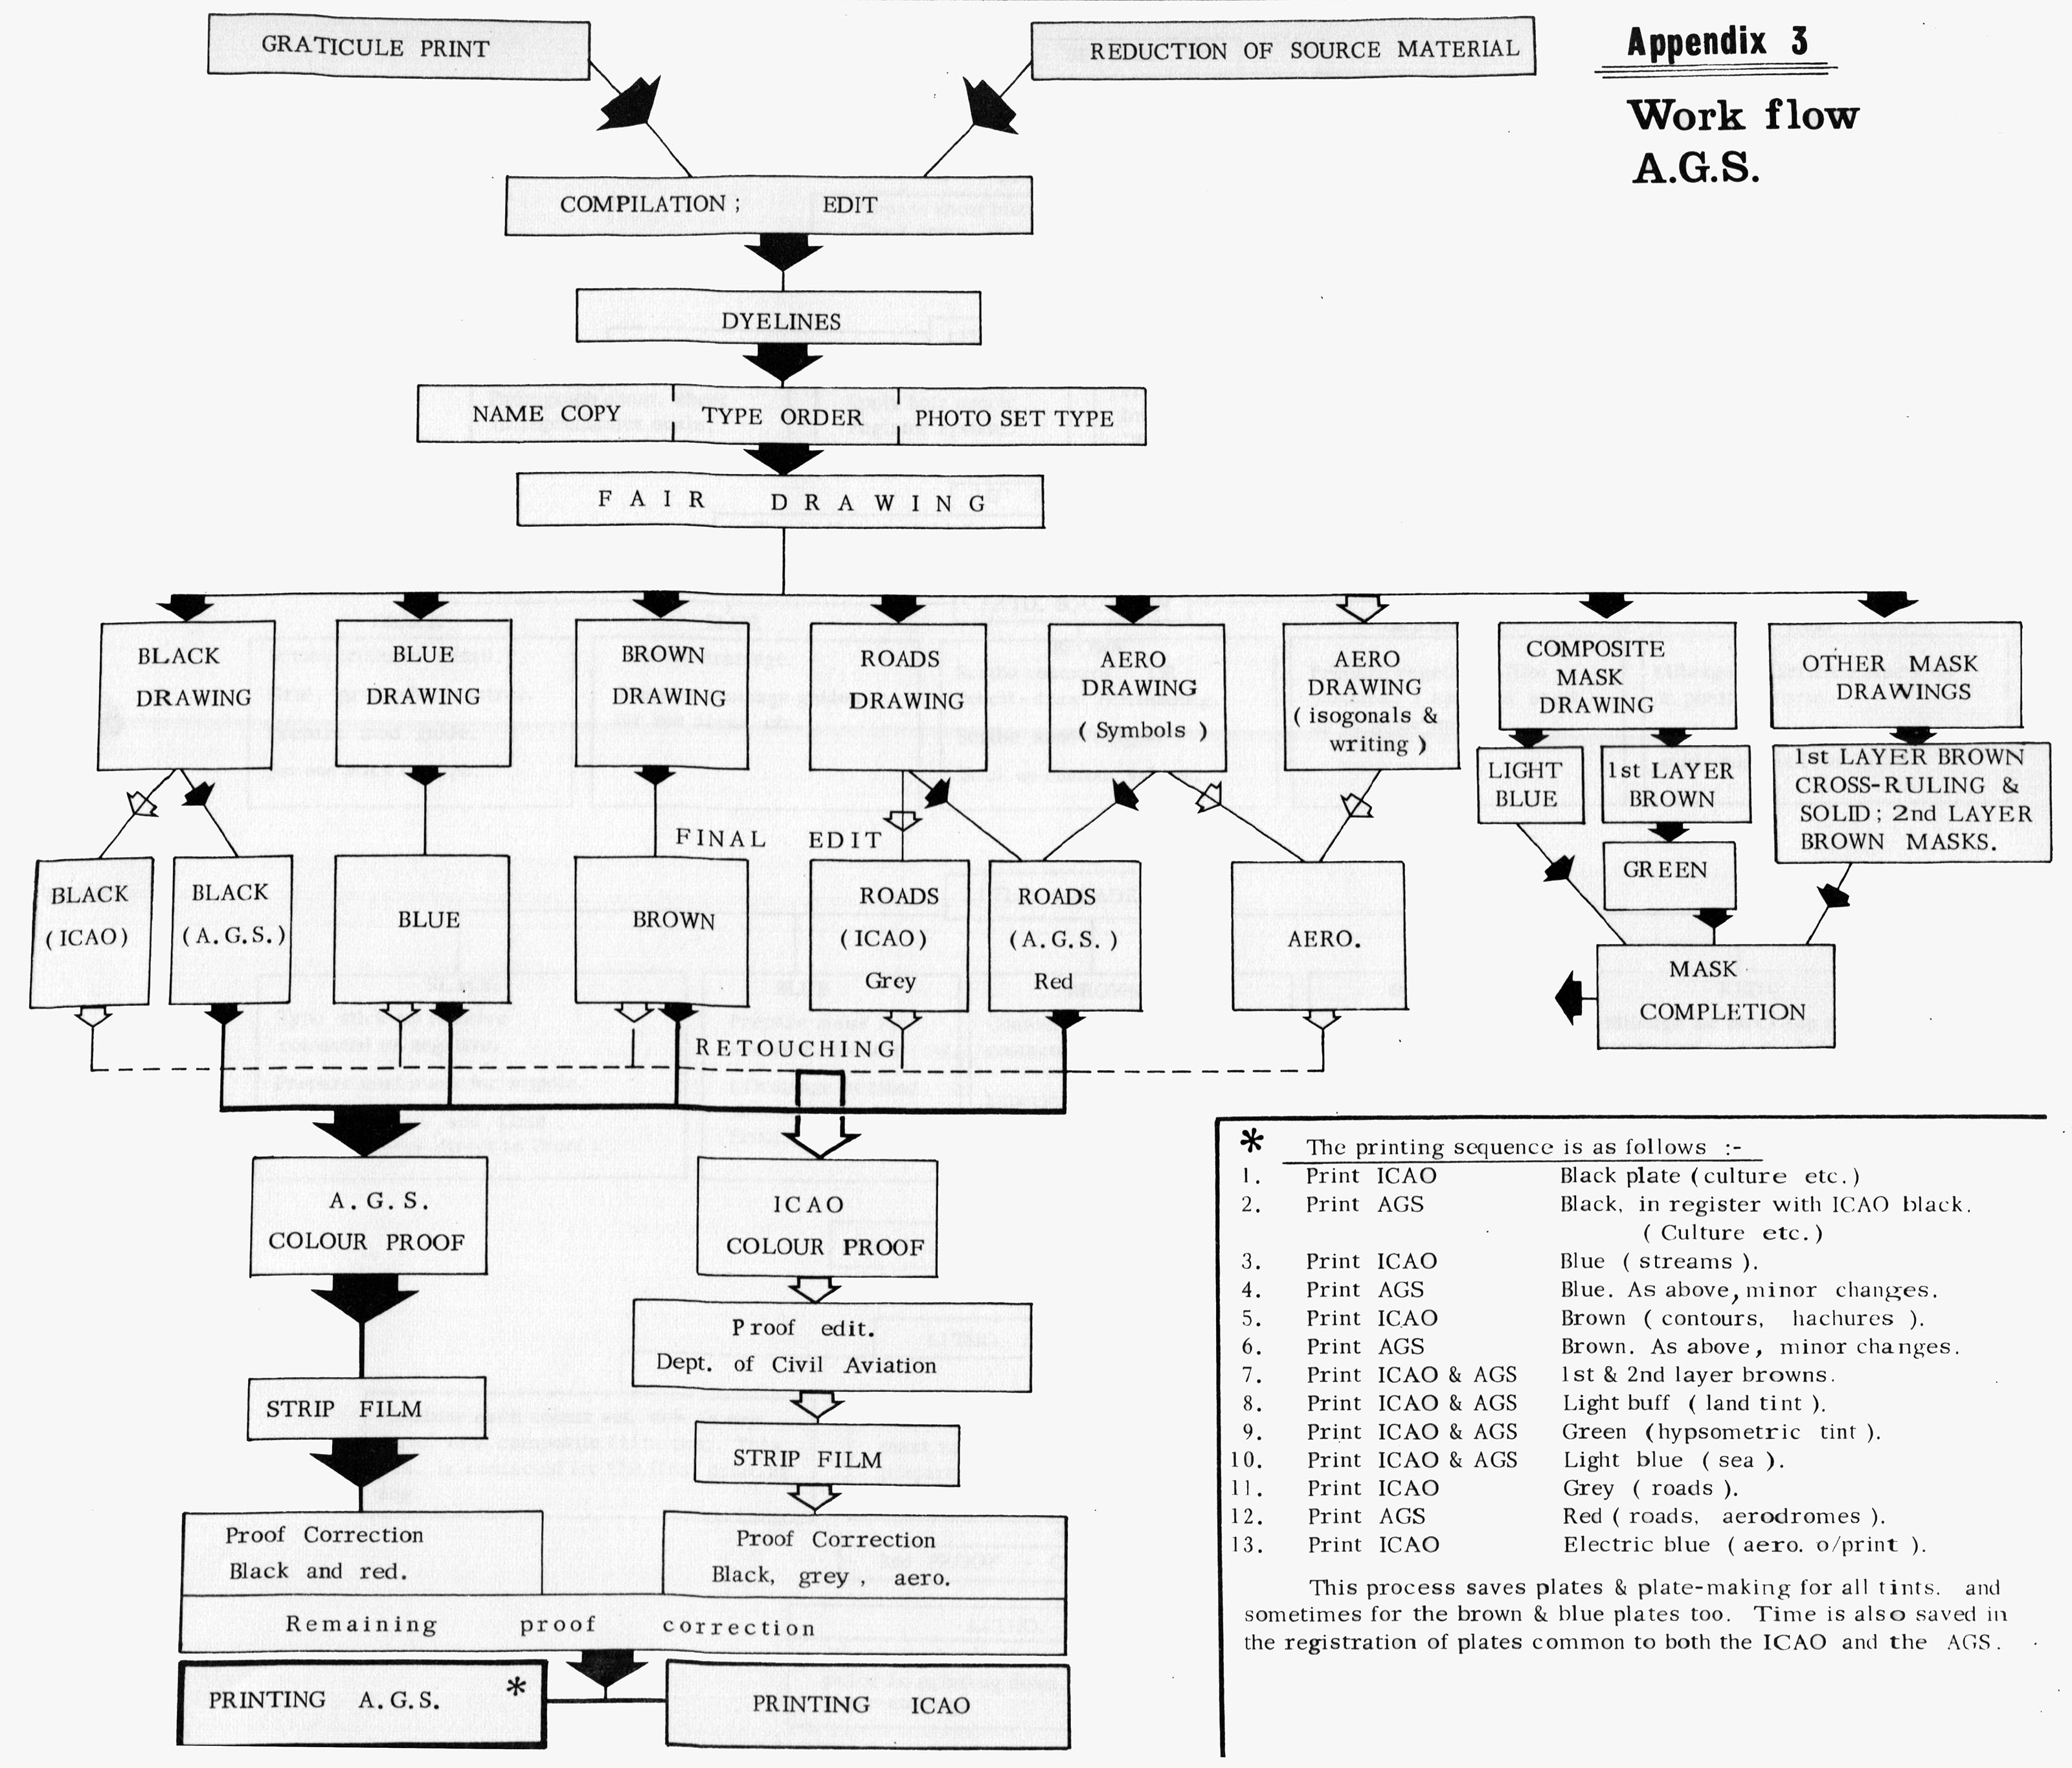
Printing down is onto presensitised aluminium plates, which are despatched - after final checking - to the Government Printer. Full details of the work-flow throughout these stages are given in the form of a chart in Appendix 3.
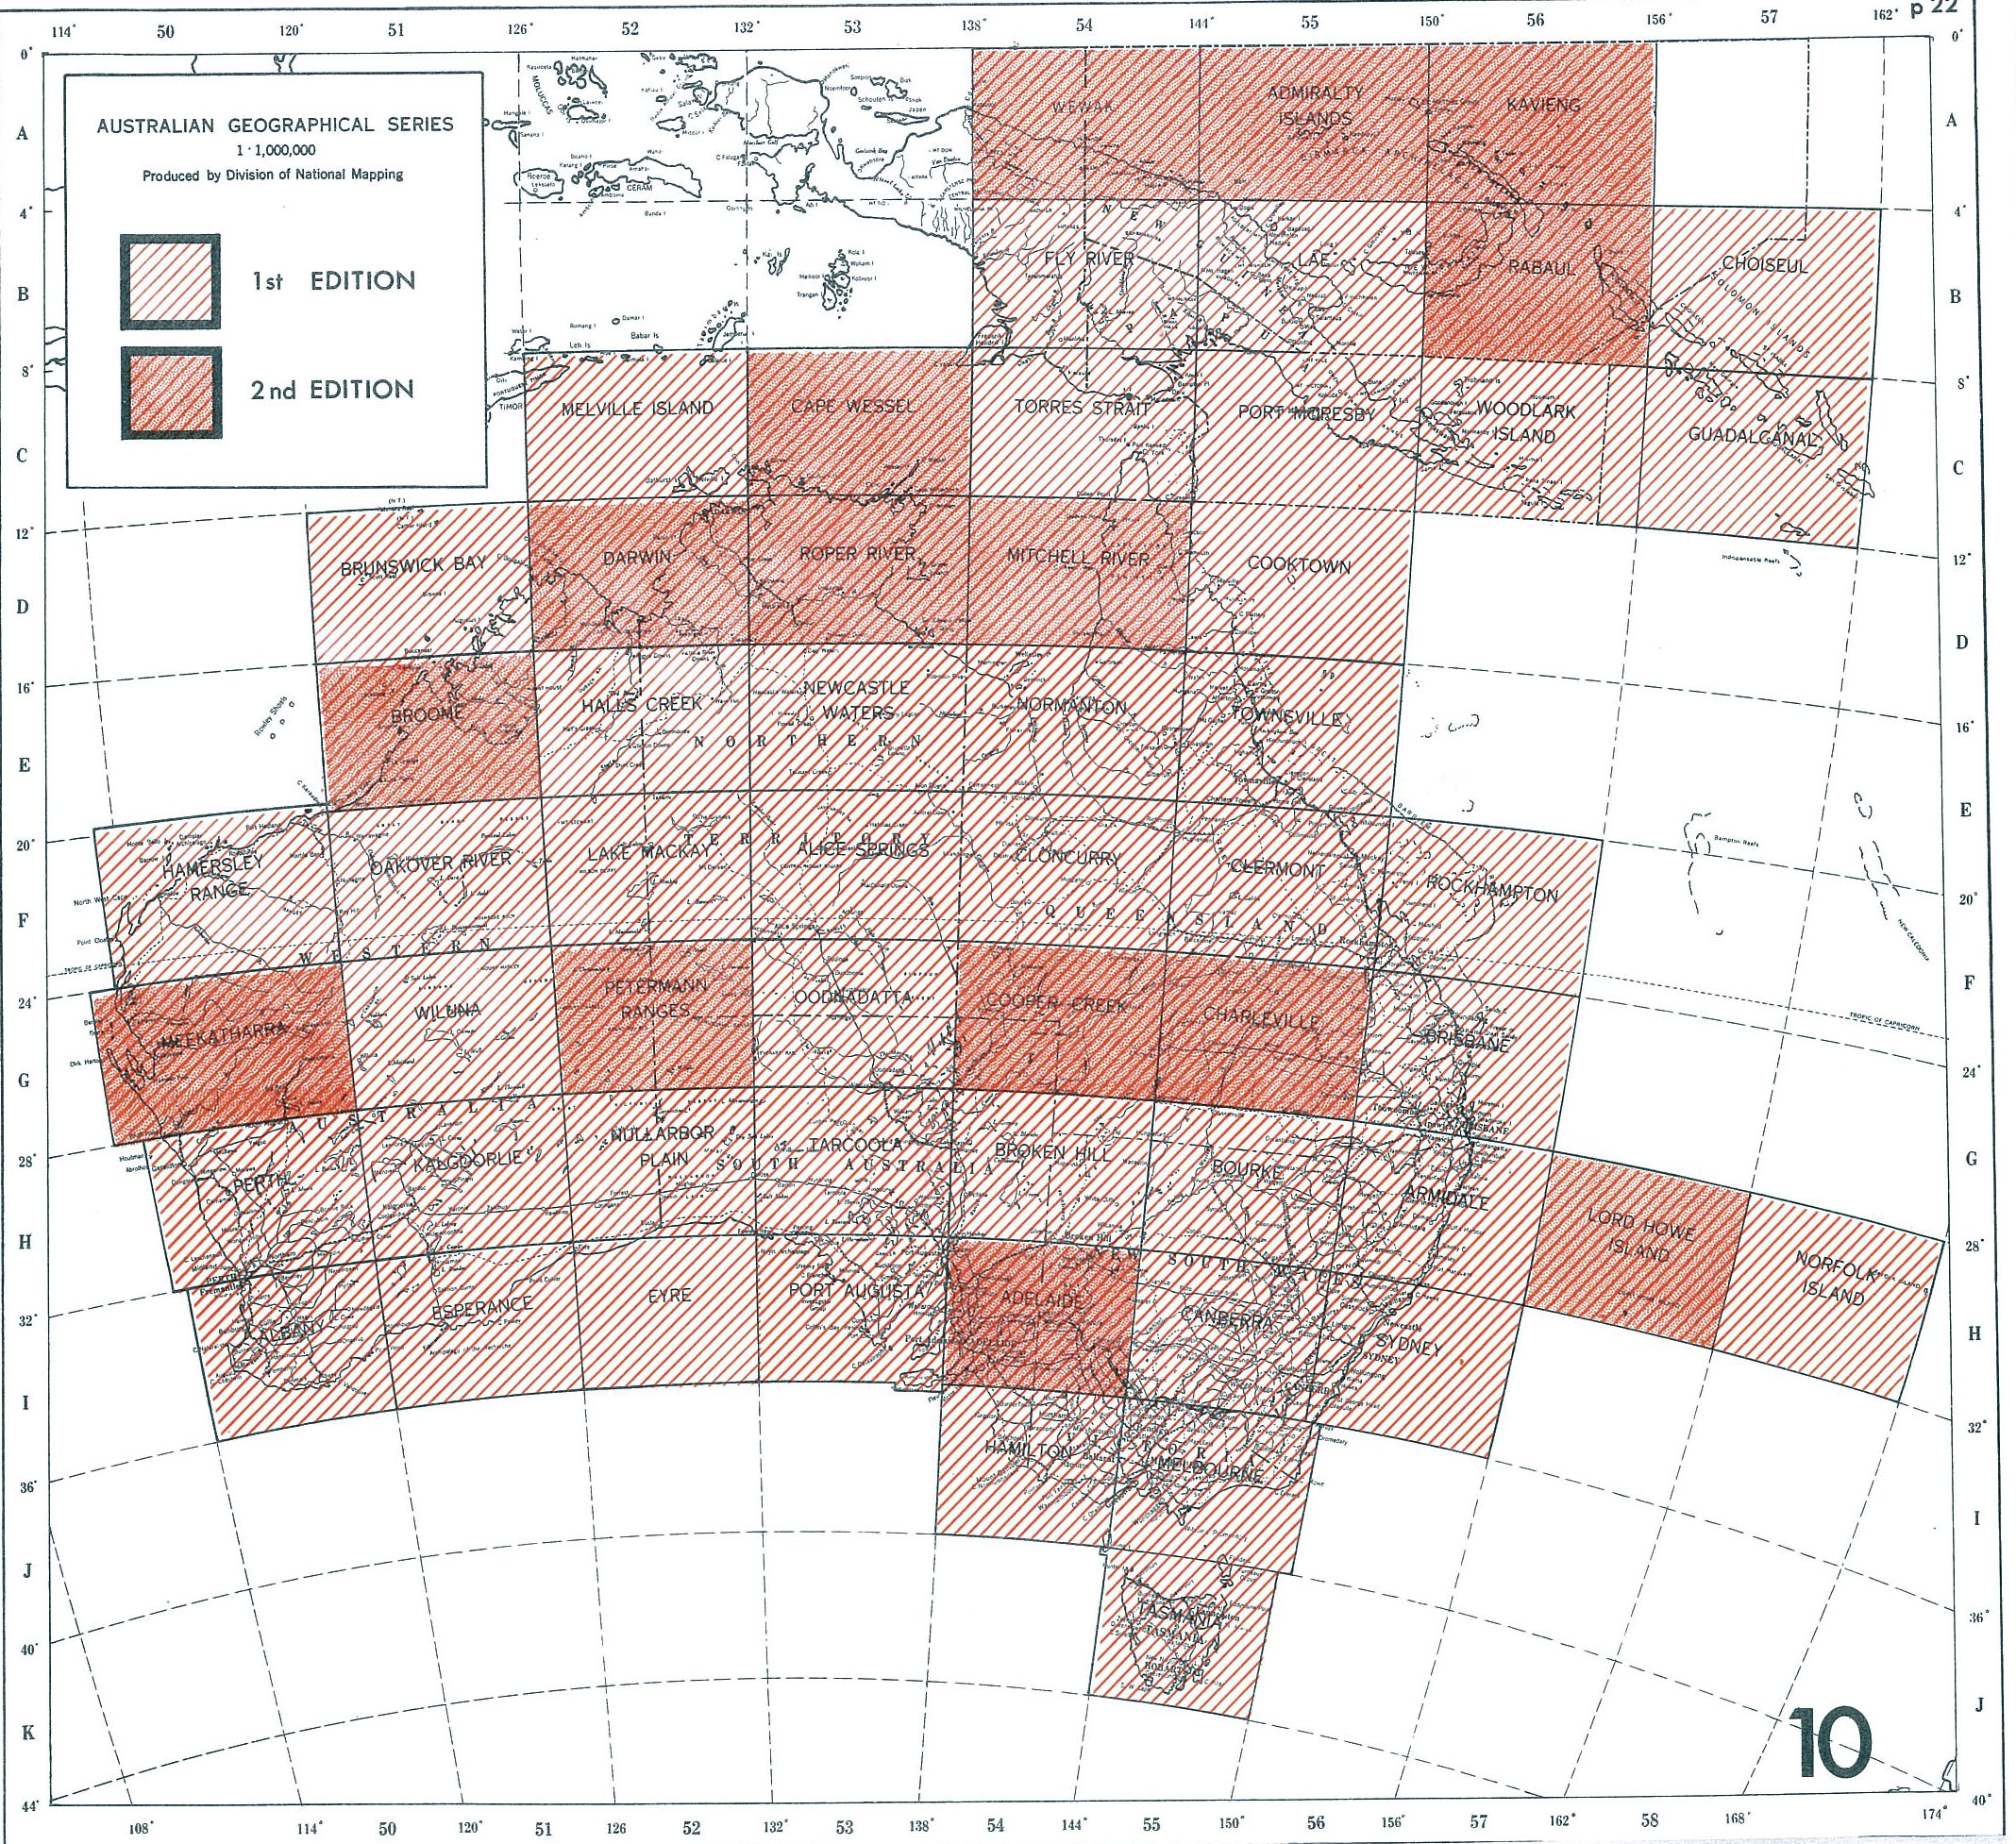
Coverage
Australia is covered by 46 sheets in this series, and a further 10 sheets cover New Guinea and the nearby islands. All these have been published, and the coverage (as at September 1965) is shown in Figure 10.
THE 1 : 250 000 scale TOPOGRAPHIC AND PLANIMETRIC SERIES
Background
Following the decision to adopt the new metric scales and International map sheet system, both the Army and the Division of National Mapping superseded their 4 mile scale series with the 1 : 250 000 scale, and the first sheets under the new system appeared in 1958-59.
The National Mapping Programme (which is examined in Part III) first called for coverage of inland Australia with 1 : 250 000 scale maps, firstly in the form of a Planimetric Series, on which relief is shown not in measurable form but by hill shading; and then by a fully contoured Topographic series. The Planimetric sheets will be withdrawn as and when the corresponding Topographic contoured sheet is published.
General description
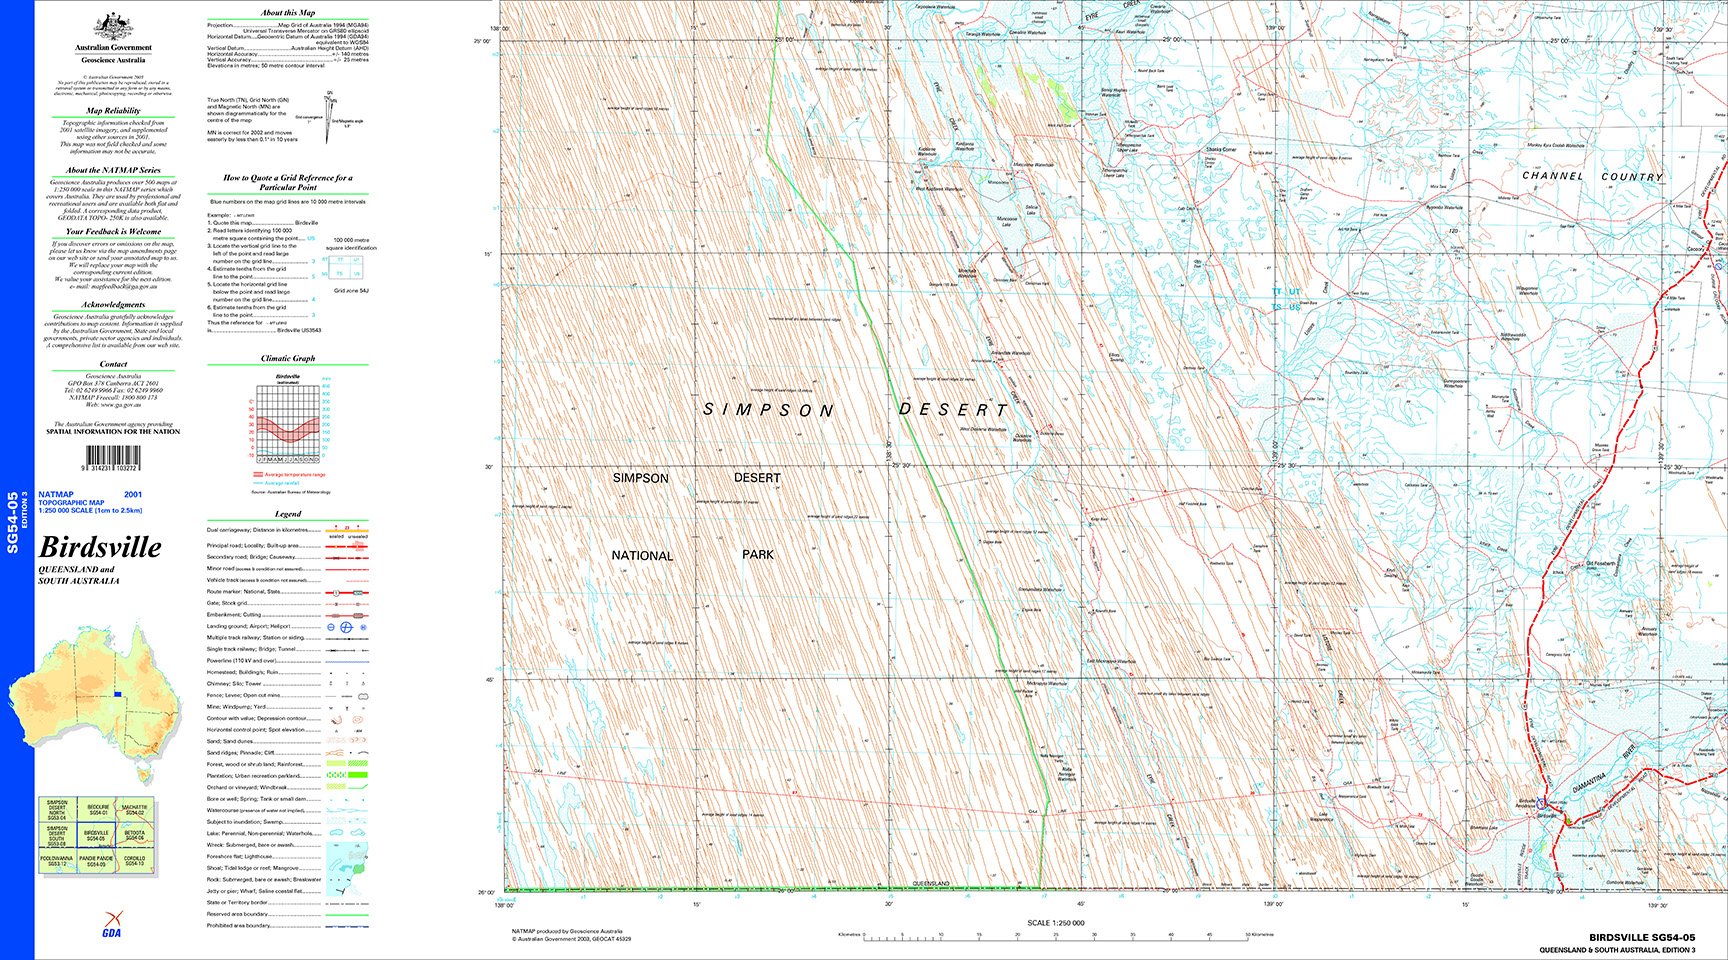
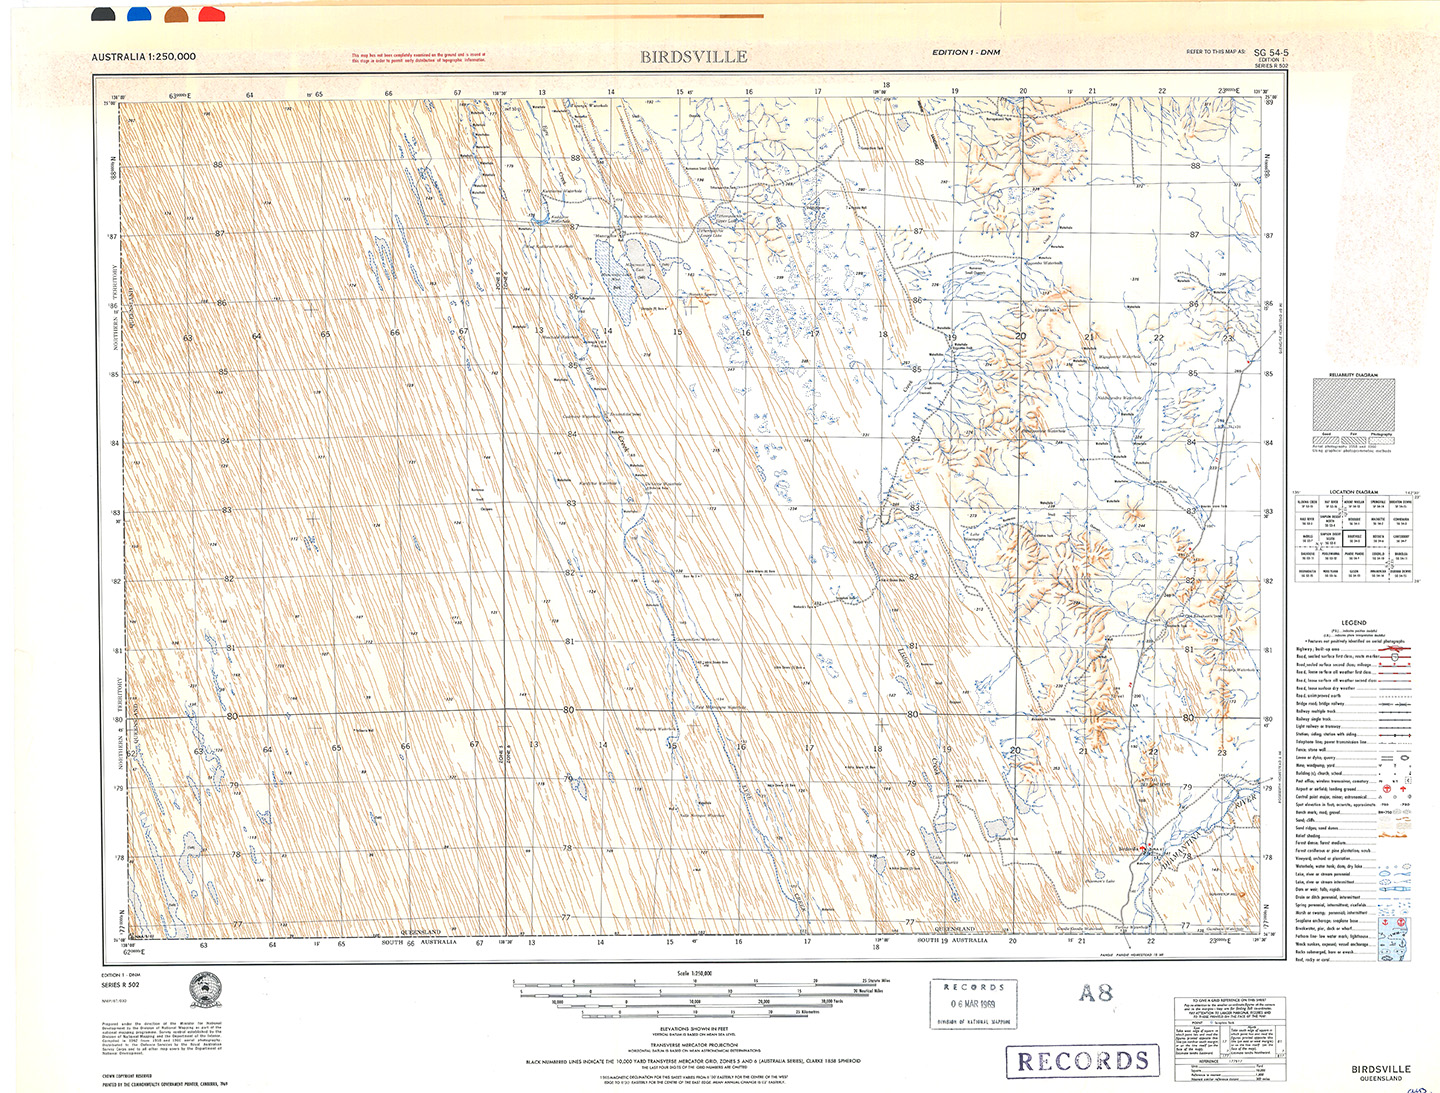
Apart from relief depiction and some compilation procedures, there are few differences between the sheets produced by the two organisations, which will hereinafter be referred to as AAS ( Australian Army Survey) and DNM (Division of National Mapping). Figure 11a and Figure 11b are examples of recent editions from the AAS and DNM respectively.
The series is produced in accordance with the Specifications and Standards of Accuracy laid down by the National Mapping Council, (see Appendix 1) and embodied in the army Manual of Map Specifications - these in turn having been designed in accordance with current International practices, in particular those of the US Army Map Service.
|
Series Name |
Australia 1 : 250 000 scale
|
|
Series Number |
R502 (in accordance with the international system in Appendix 2)
|
|
Sheet Name |
e.g. : AUVERGNE (sheet names are the same as the old 4 mile scale areas)
|
|
Sheet Number |
e.g. : SD52-15 (the IMW 1 : 1 Million area (SD52) is divided into 16 map areas
|
|
Edition |
The AAS bring out no provisional editions, and all editions are numbered consecutively - to date, all have been First Editions. DNM sheets which are published without having been field checked are designated Provisional Editions, and only 300 copies are printed, in three colours; black, blue and brown. Immediately after publication, these sheets are forwarded for nomenclature check. Sheets which have been field checked (by ground examination, spot photography from light aircraft etc.) incorporate the authorised nomenclature and are published as First Editions. 1000 of these are printed at a time in four colours, black, blue, brown and red. Second Editions (none has yet been published) will be in full colour, i.e. with the addition of light blue (water surfaces ) and green (vegetation).
|
|
Projection |
Transverse Mercator. The Horizontal Datum varies, and may be based on mean or specific astrofixes, Sydney observatory, local data, etc.
|
|
Graticule |
Sheets are graticule - bounded, each one covering 1.5 degrees of Longitude x 1 degree of Latitude
|
|
Grid |
The Transverse Mercator Grid is shown by full lines on the face of the map at 10 000 yard intervals; this grid is described in Appendix 2.
|
Cultural detail
All cultural detail compatible with the scale is shown in accordance with the Army Manual of Map Specifications, based on the National Mapping Council's. classification of map symbols. (The DNM may depart from the rigid army specifications in respect of some minor items such as type size and positioning; for example, labelling of features such as rivers will follow the curves of the river, whereas army practice is to adhere to angled or straight lettering).
Relief
Planimetric series : Both the DNM and AAS editions depict relief by oblique hill shading and the two slightly different approaches to this technique are worth recording. Until recently, the AAS was in the habit of preparing, at the expense of much valuable time, an extremely accurate plaster relief model, and photographing it with a north west illumination. The hill shading plate would then be made in halftone from this negative. DNM meanwhile was concentrating on the perfection of the air-brush technique, producing a relief drawing (in black on white plastic) which is then photographed, and the plate made by normal methods. Some most vivid impressions of the third dimension have been achieved by the model technique of the AAS, although the time involved must have been hard to justify; a more subdued but thoroughly effective indication of relief is achieved much more economically by the air-brush technique favoured by DNM, and the AAS has now adopted this method.
Topographic series : On the AAS Topographic sheets, relief is shown by contours at 250 feet interval, and the vertical Datum varies e.g. Low Water Mark Williamstown, MSL Van Diemen Gulf, MSL Sydney, etc.
Hypsometric tinting is also applied.
Spot heights supplement all forms of relief depiction on maps in these series.
Other Detail
The AAS editions Topographic and Planimetric, have an additional colour in the green used to denote various categories of vegetation cover, which is not shown at all at present on DNM sheets. Usual hydrographic detail is shown conventionally in accordance with National Mapping Council specifications. (The Department of Lands & Surveys, Western Australia, has produced a number of combined topographical and cadastral 4 mile and 1 : 250 000 scale sheets based on the national sheet system, projection, and grid. Cadastral detail is overprinted in green on the topographic base).
Initially, the aerial photography used for the production of these maps was at about 1 : 50 000 scale, but now both organisations use Wild RC-9 superwide angle photography with an approximate photoscale of 1 : 80 000.
AAS : Compilation scale is that of the 1 : 100 000 series i.e. 1 : 75 000, and where possible two adjacent (north and south) sheets are compiled together. RC-9 photography is usually flown at 25 000 feet, and aerotriangulation is carried out at 1 : 80 000 scale on the Wild A9 stereoplotter. This instrument is capable of triangulating 25 models per run up to 18 runs, and requires for horizontal control nine points selected symmetrically, plus checks. Plotting may be carried out on B8 or B9 stereoplotters.
Vertical control is obtained from sources which range from the Airborne Profile Recorder to 3rd order levelling. A recent acquisition which will probably revolutionise the collection of vertical data is a Johnson Ground Elevation Meter. Vertical control is supplemented where necessary by the Jerie method.
DNM : Compilation scale for the planimetric series is at 1 : 100 000 scale from RC-9 superwide angle photography.
Map control in the less developed areas is mainly astronomical fixations (astrofixes) supplemented by geodetic stations where available. Control extension is obtained rapidly and adequately by slotted templates. DNM considers graphical methods are sufficiently accurate for this series considering the existing ground control.
Map detail is plotted using Wild B8, A6 stereoplotters, or the simpler instruments such as Zeiss Stereotope and (in flat areas of sparse detail) Sketchmaster. The plotting is done, using specially designed ball point pens and inks, on stable base drafting film as follows :
|
Purple |
1 : 250 000 scale stream pattern |
|
Red |
Roads and tracks |
|
Blue |
1 : 100 000 scale stream pattern |
|
Brown |
Peaks and ridge-lines as a starter guide for the hill-shader |
|
Green |
Vegetation |
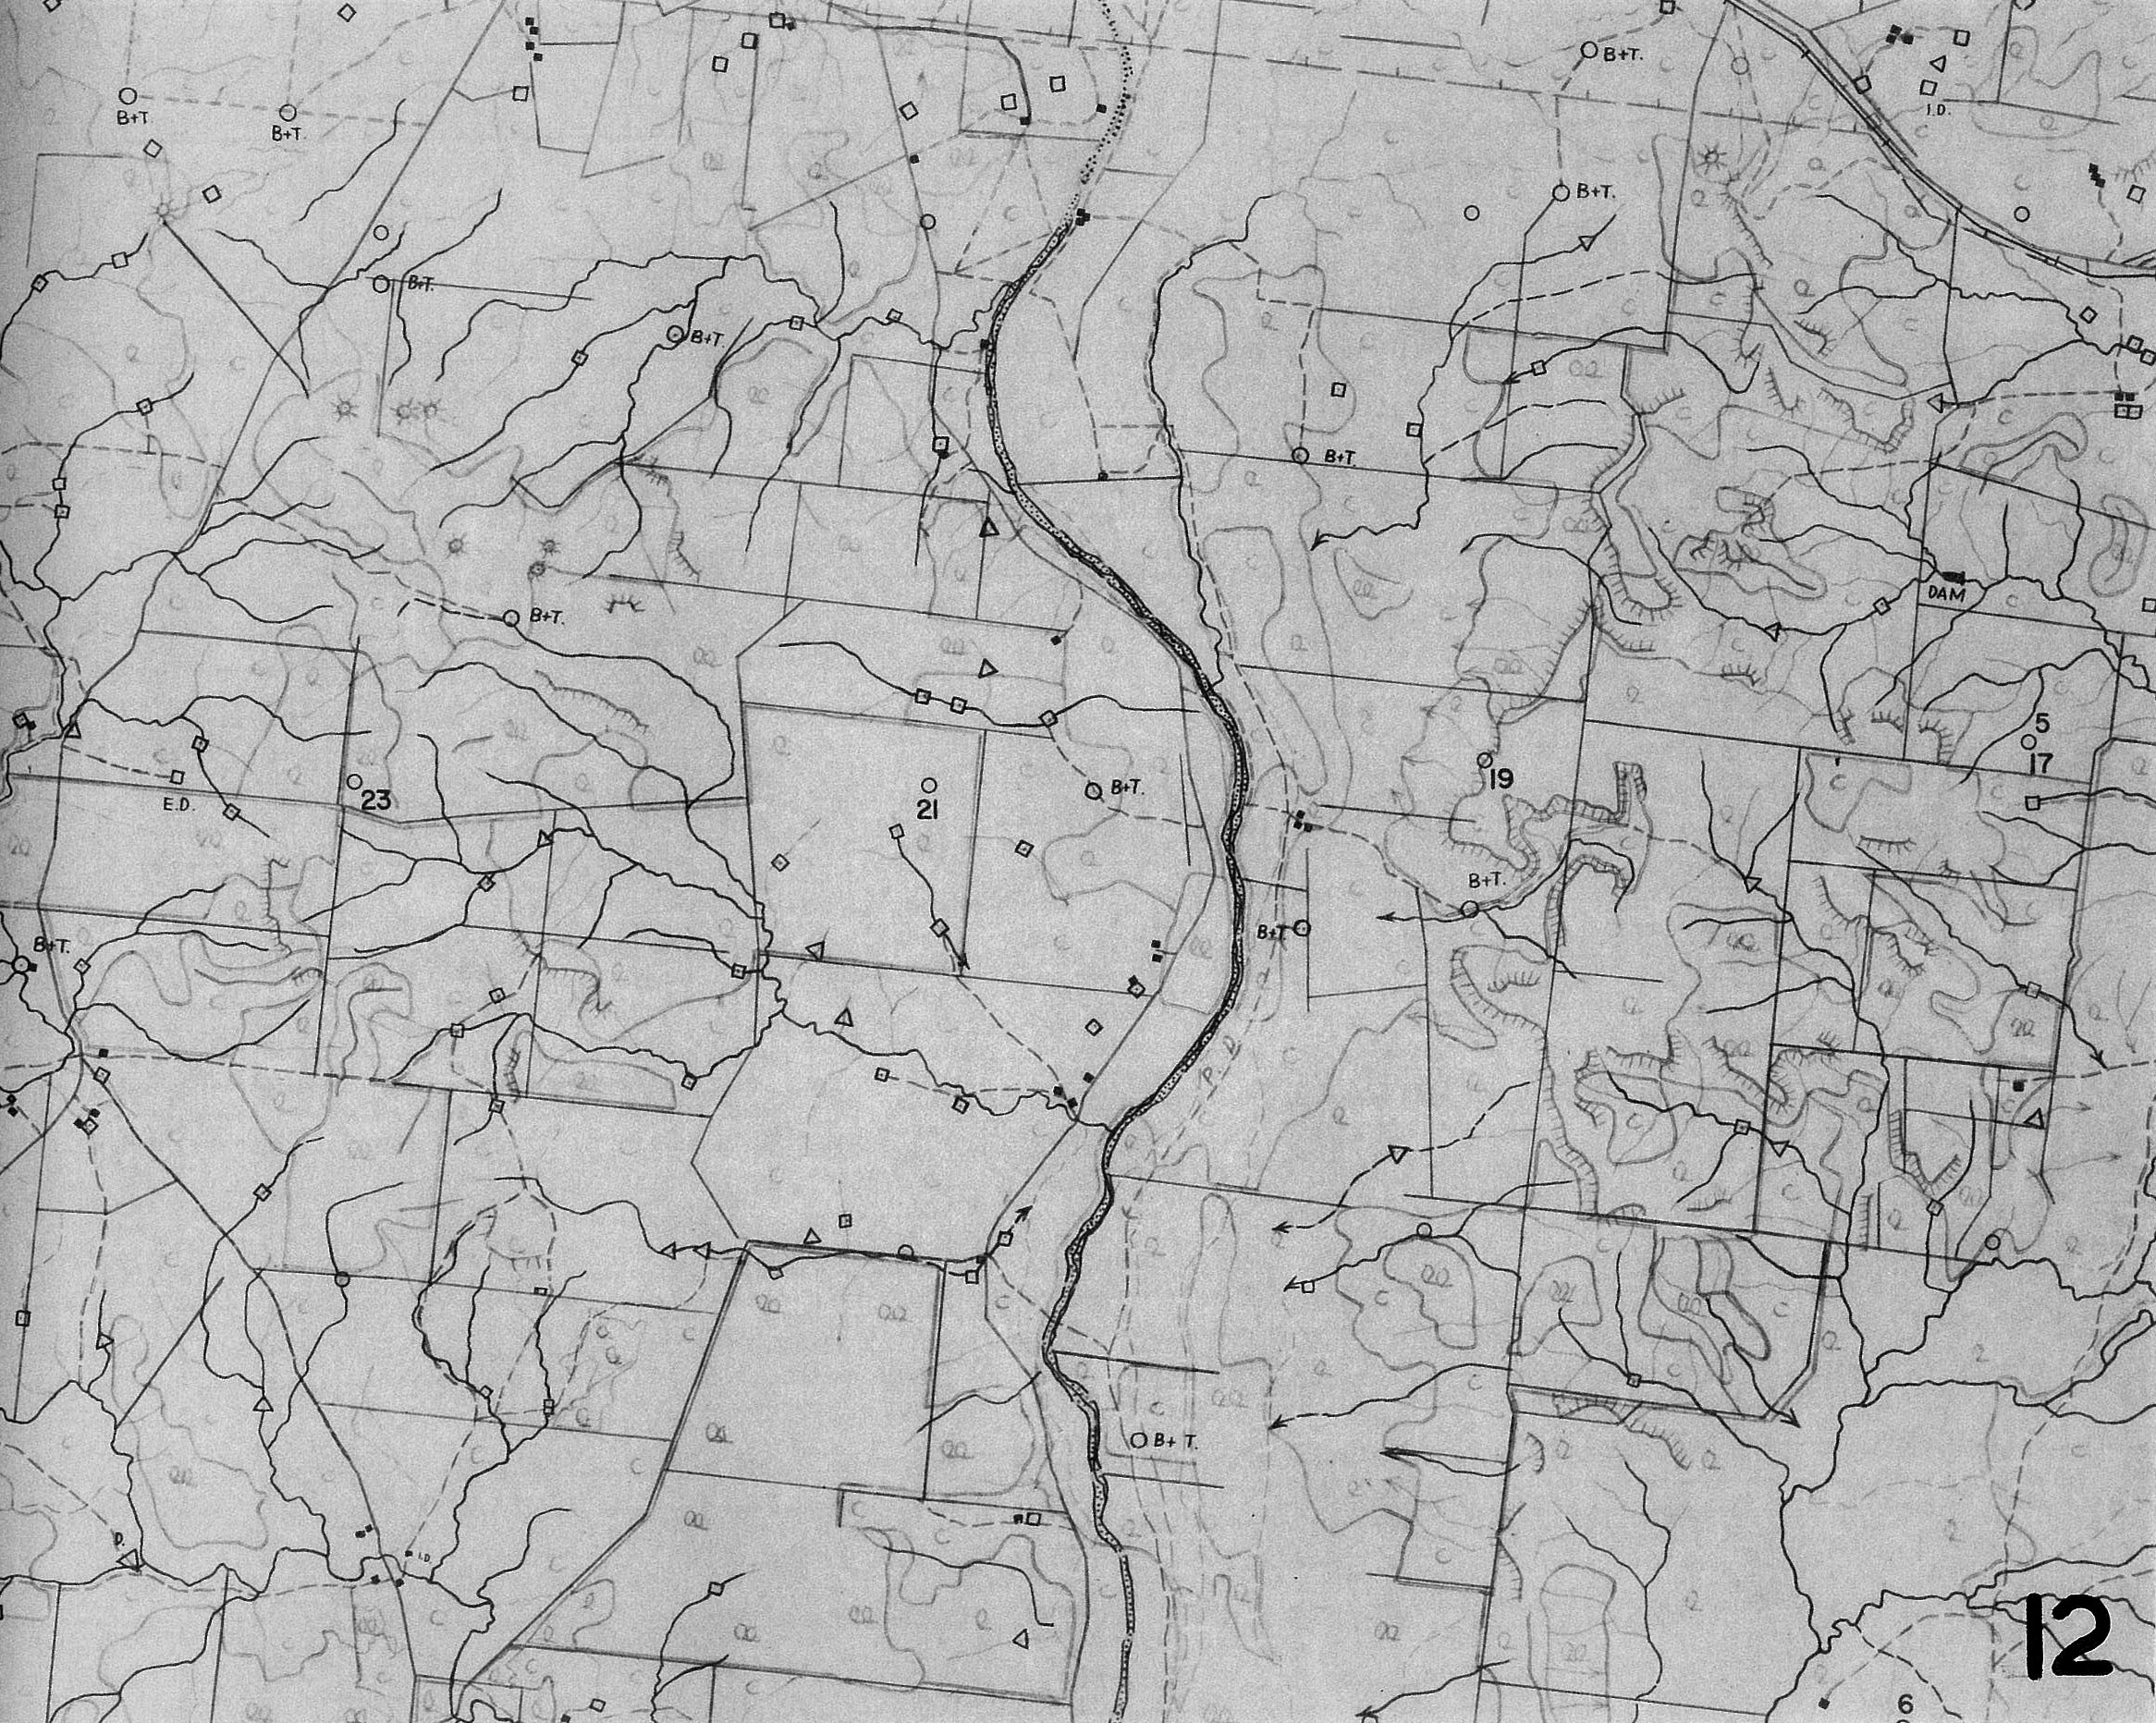
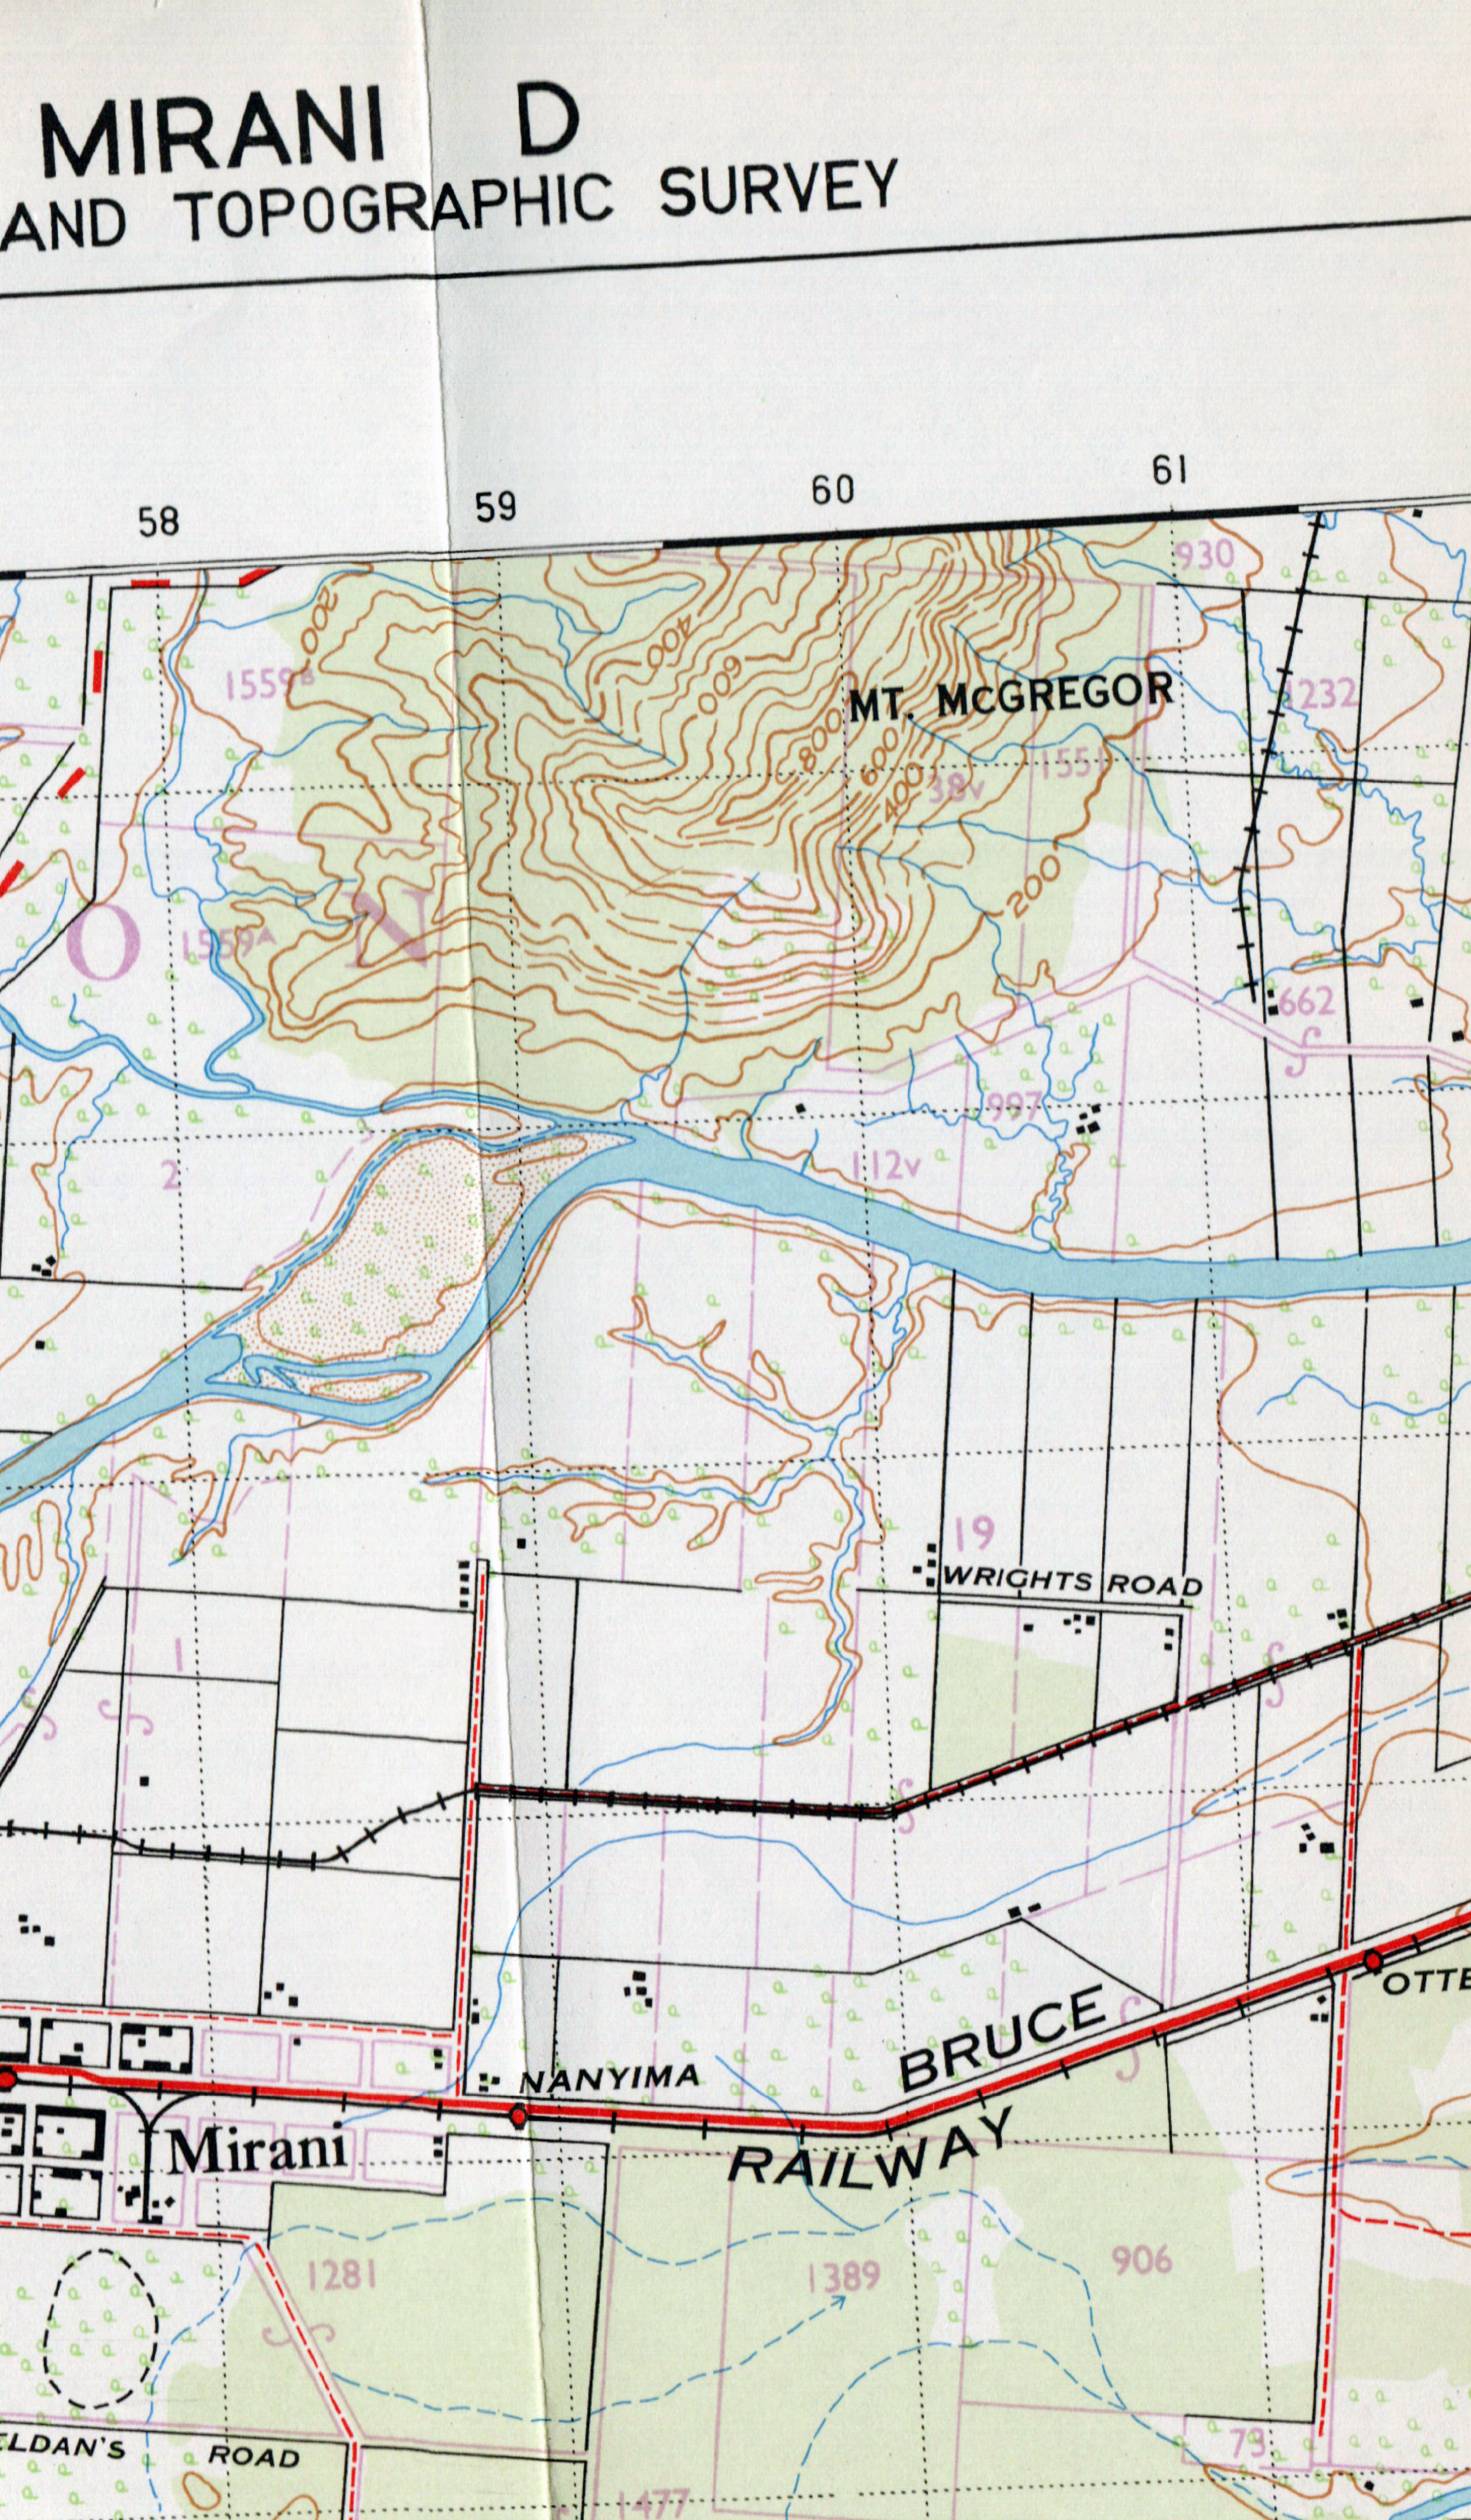
It is current practice to supply many prime users, such as the Bureau of Mineral Resources, with dyeline copies of the compilation base sheets for their field investigations. Figure 12 shows an extract.
Drawing, reproduction and coverage
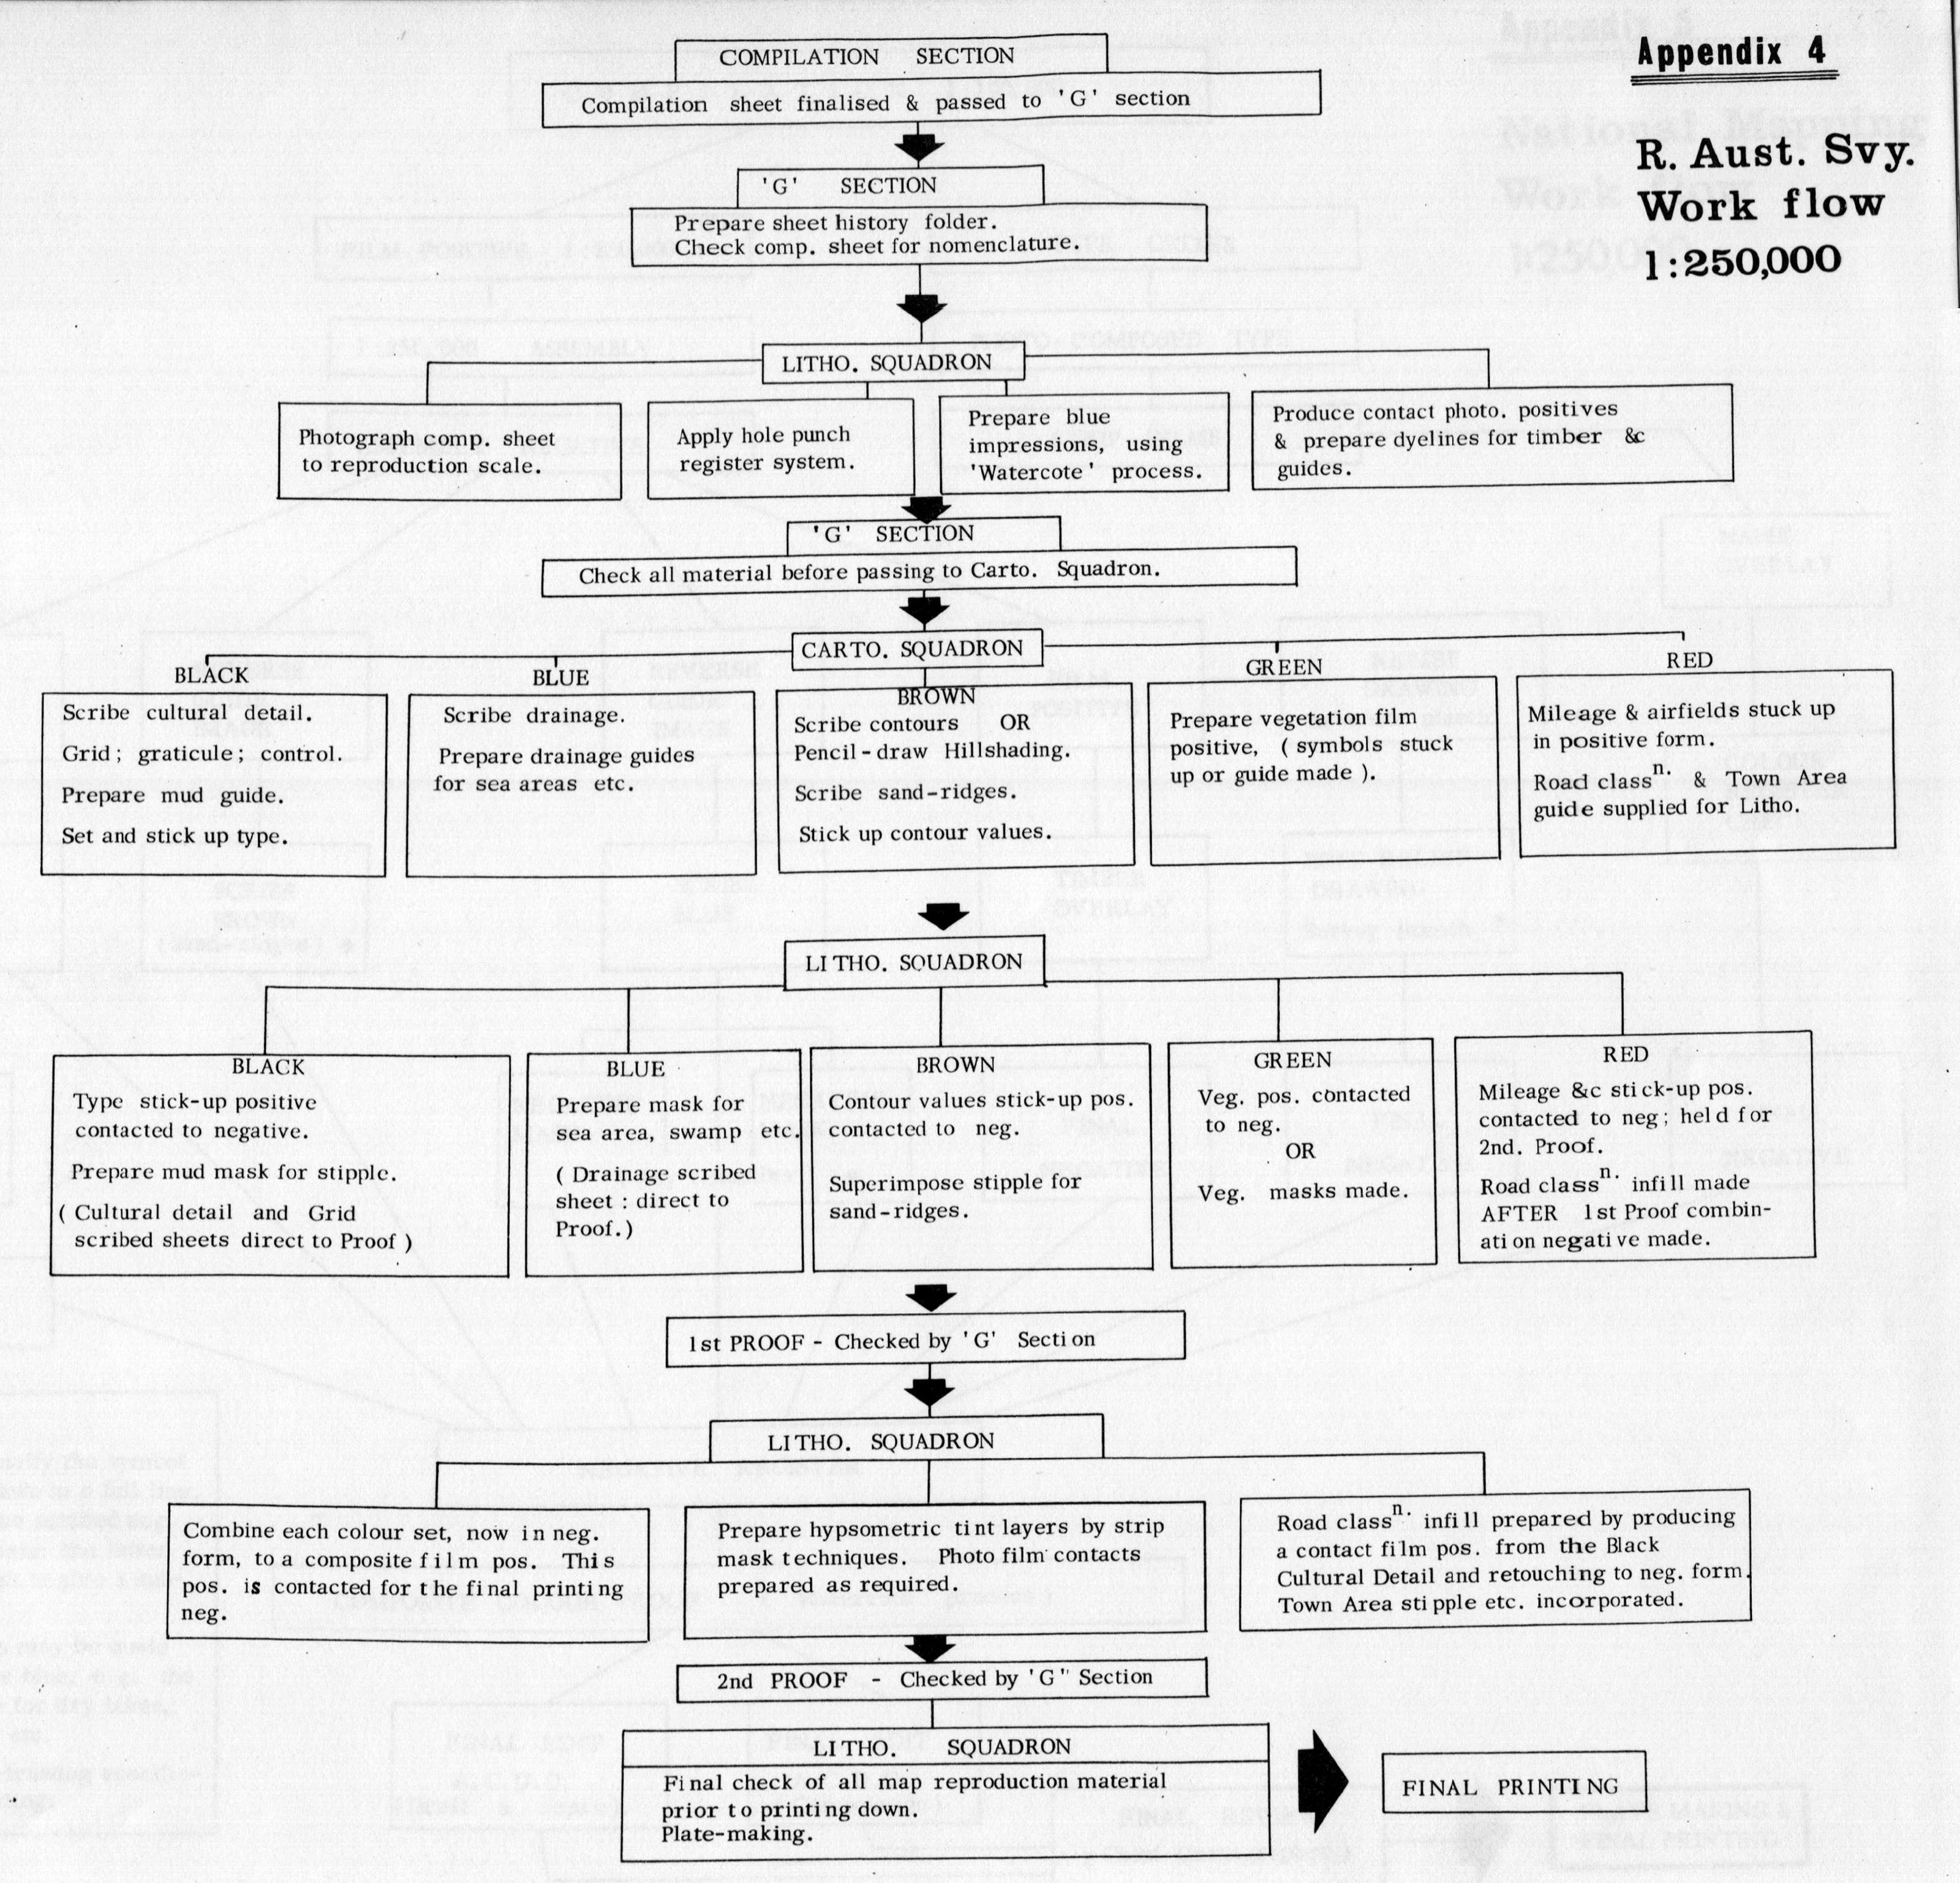
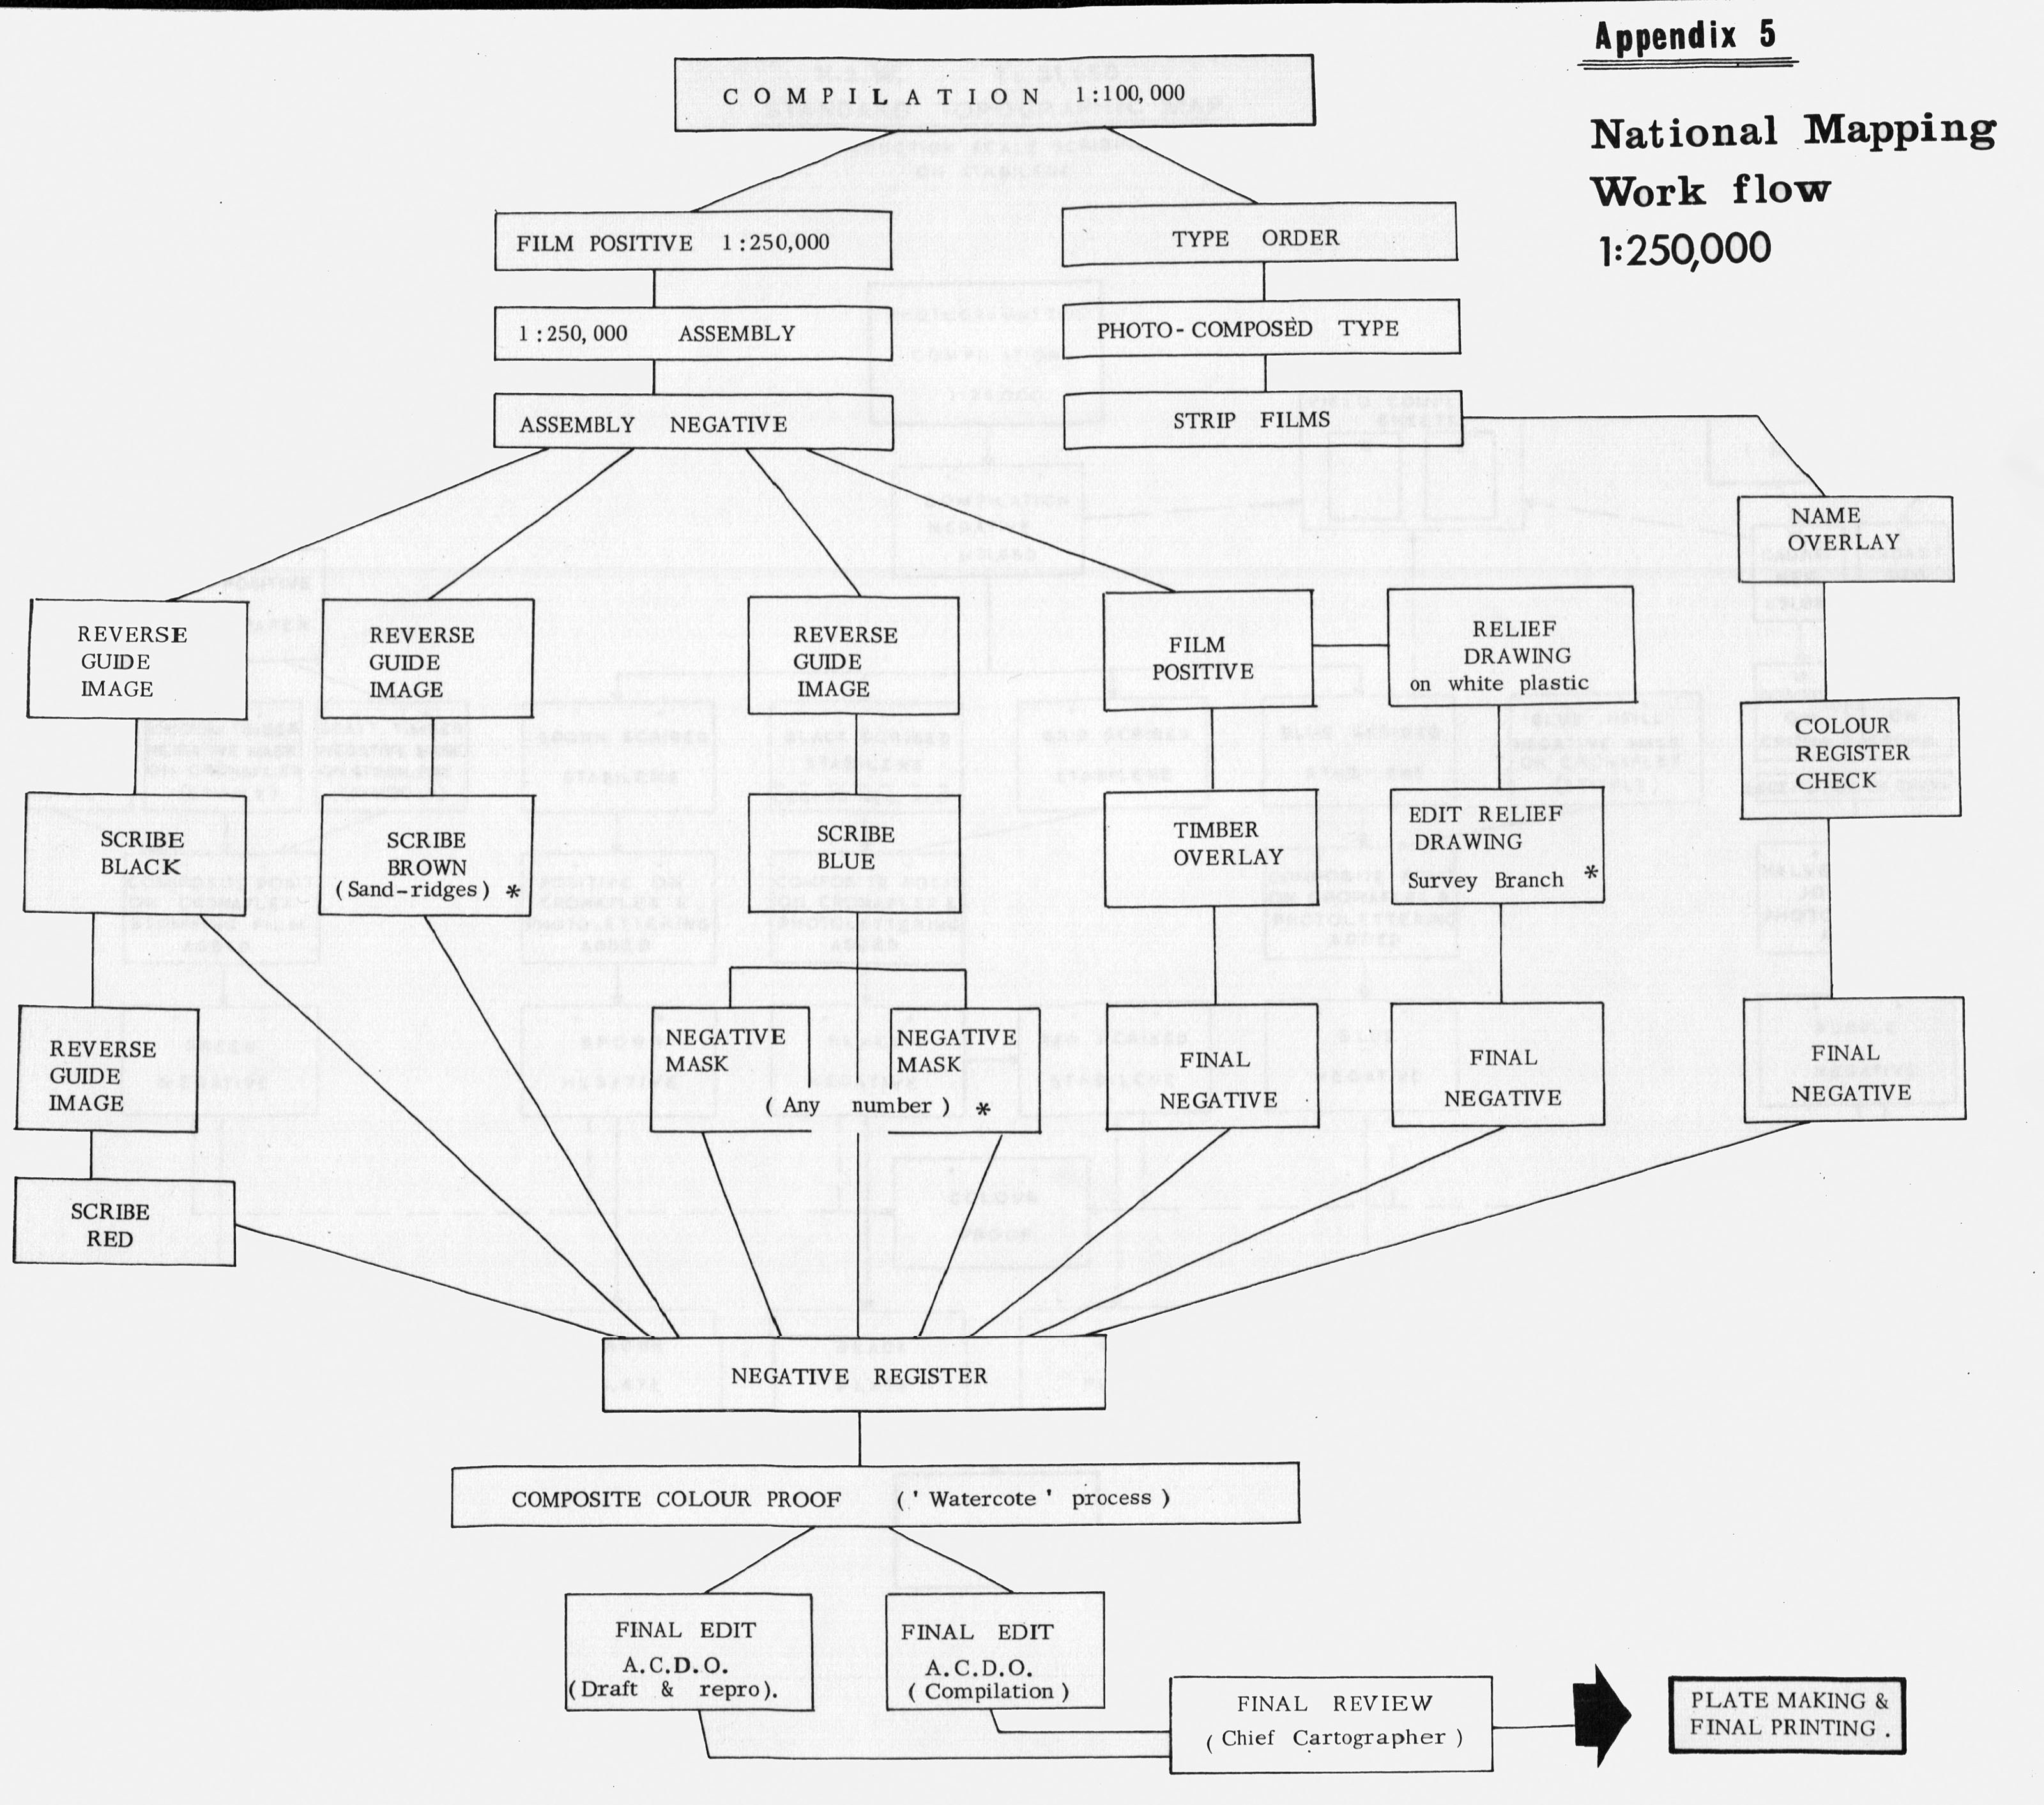
Colour separation is effected by the scribing technique, which was first introduced into Australian mapping by the Army in 1956, following UK and USA success. Similar fair drawing techniques are employed by the Army and DNM, and detailed work-flow charts are given in Appendix 4 and Appendix 5 respectively.
AAS : The Lithographic Squadron of the Royal Australian Survey Corps is currently using two, colour rotary offset presses by MAN (Machinefabrik Augsburg Nurnberg) Series Type 3. Paper used is Shoalhaven High Wet Strength, with final trim size 29 inches x 22.5 inches.
DNM : DNM’s map editions are at present being printed by the Government Printer using a single colour Parva Double Demy press, and plates prepared by the Division. The plates are printed down on both sides for economy, direct from the scribed negatives.
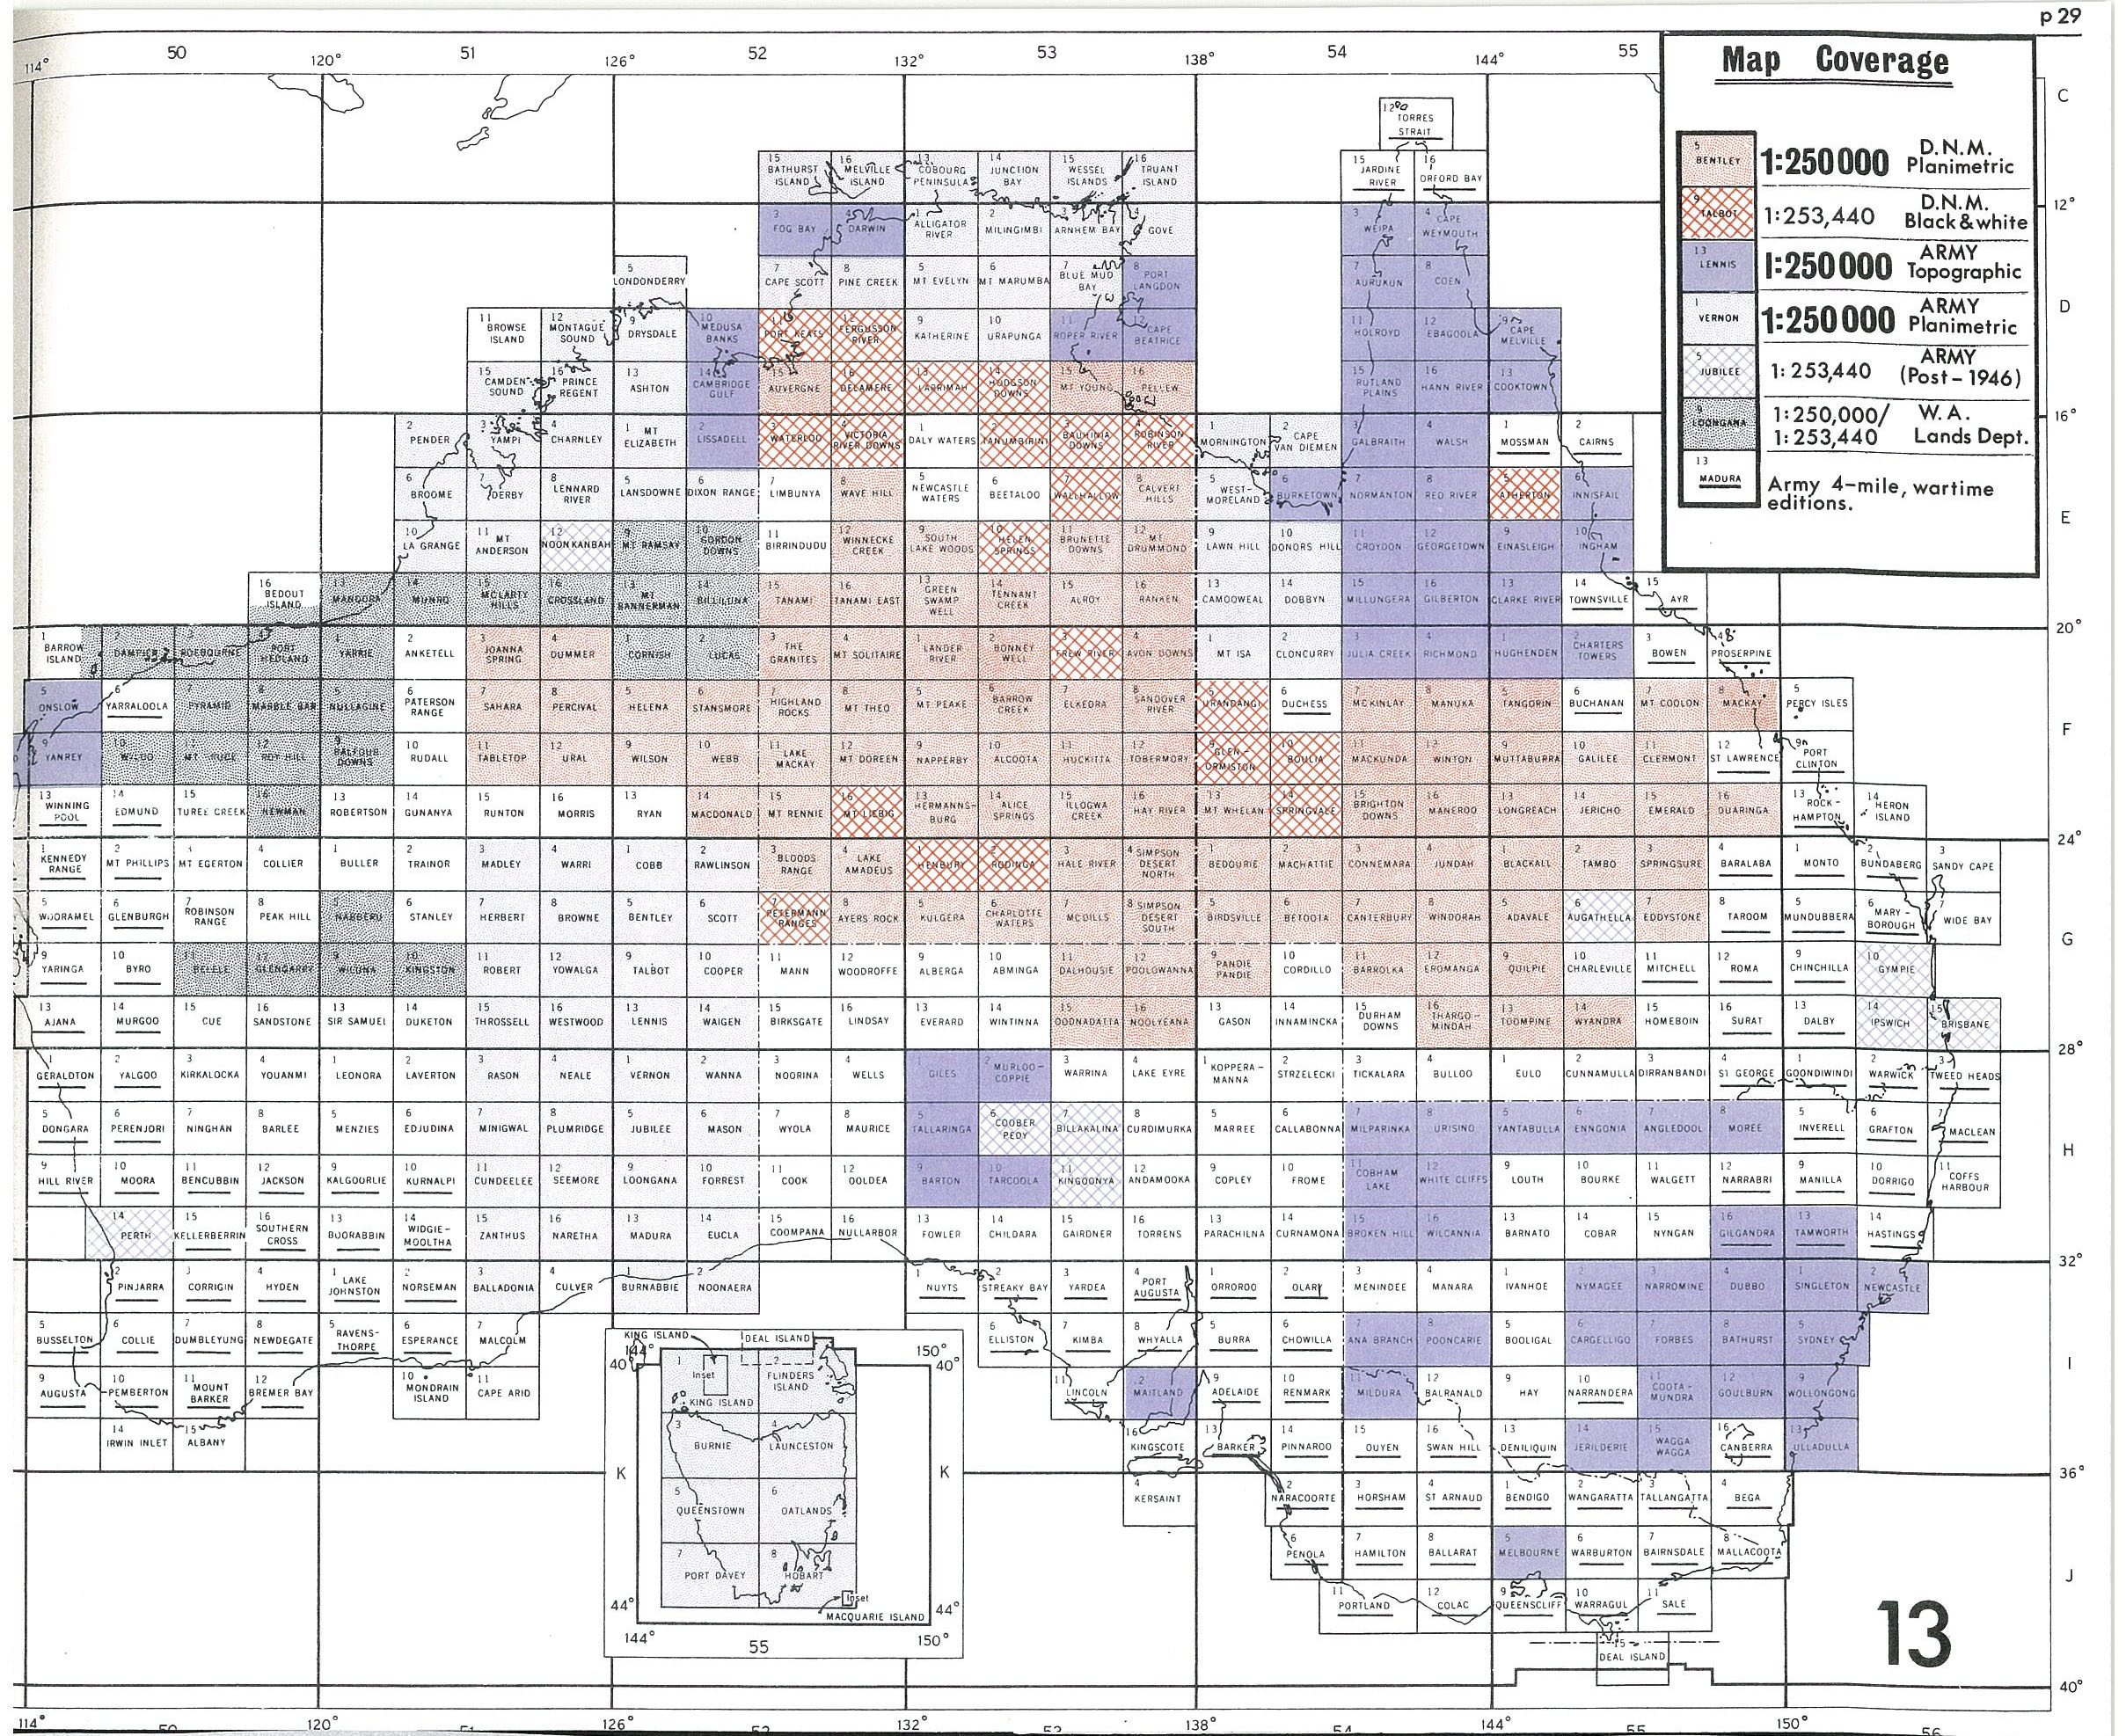
The whole of Australia is divided into some 540 sheets at 1 : 250 000 scale - in contrast, the British Isles occupy only 17 sheets at the same Scale. The table below, and the index map at Figure 13, shows the present coverage of the 1 : 250 000 scale series and of the 4 mile scale series which preceded it.
|
75 sheets |
1 : 250 000 scale Topographic Series |
Royal Australian Survey Corps : Contoured
|
|
87 sheets |
1 : 250 000 scale Planimetric Series |
Royal Australian Survey Corps : Hill shaded
|
|
97 sheets |
1 : 250 000 scale Planimetric Series |
Division of National Mapping : Hill shaded
|
|
9 sheets |
1 : 253 440 ( Post 1945 )
|
Royal Australian Survey Corps : 8 contoured, full colour 1 hachured, black and white
|
|
23 sheets |
1 : 253 440 ( Post 1945 )
|
Division of National Mapping : Spot heights, black and white
|
|
27 sheets |
1 : 250 000/1 : 253 440 ( Post 1945 )
|
Western Australia Lands Department : Topographic base and Cadastral overprint |
|
123 sheets |
1 : 253 440 |
Army Emergency Mapping 1939-1945 |
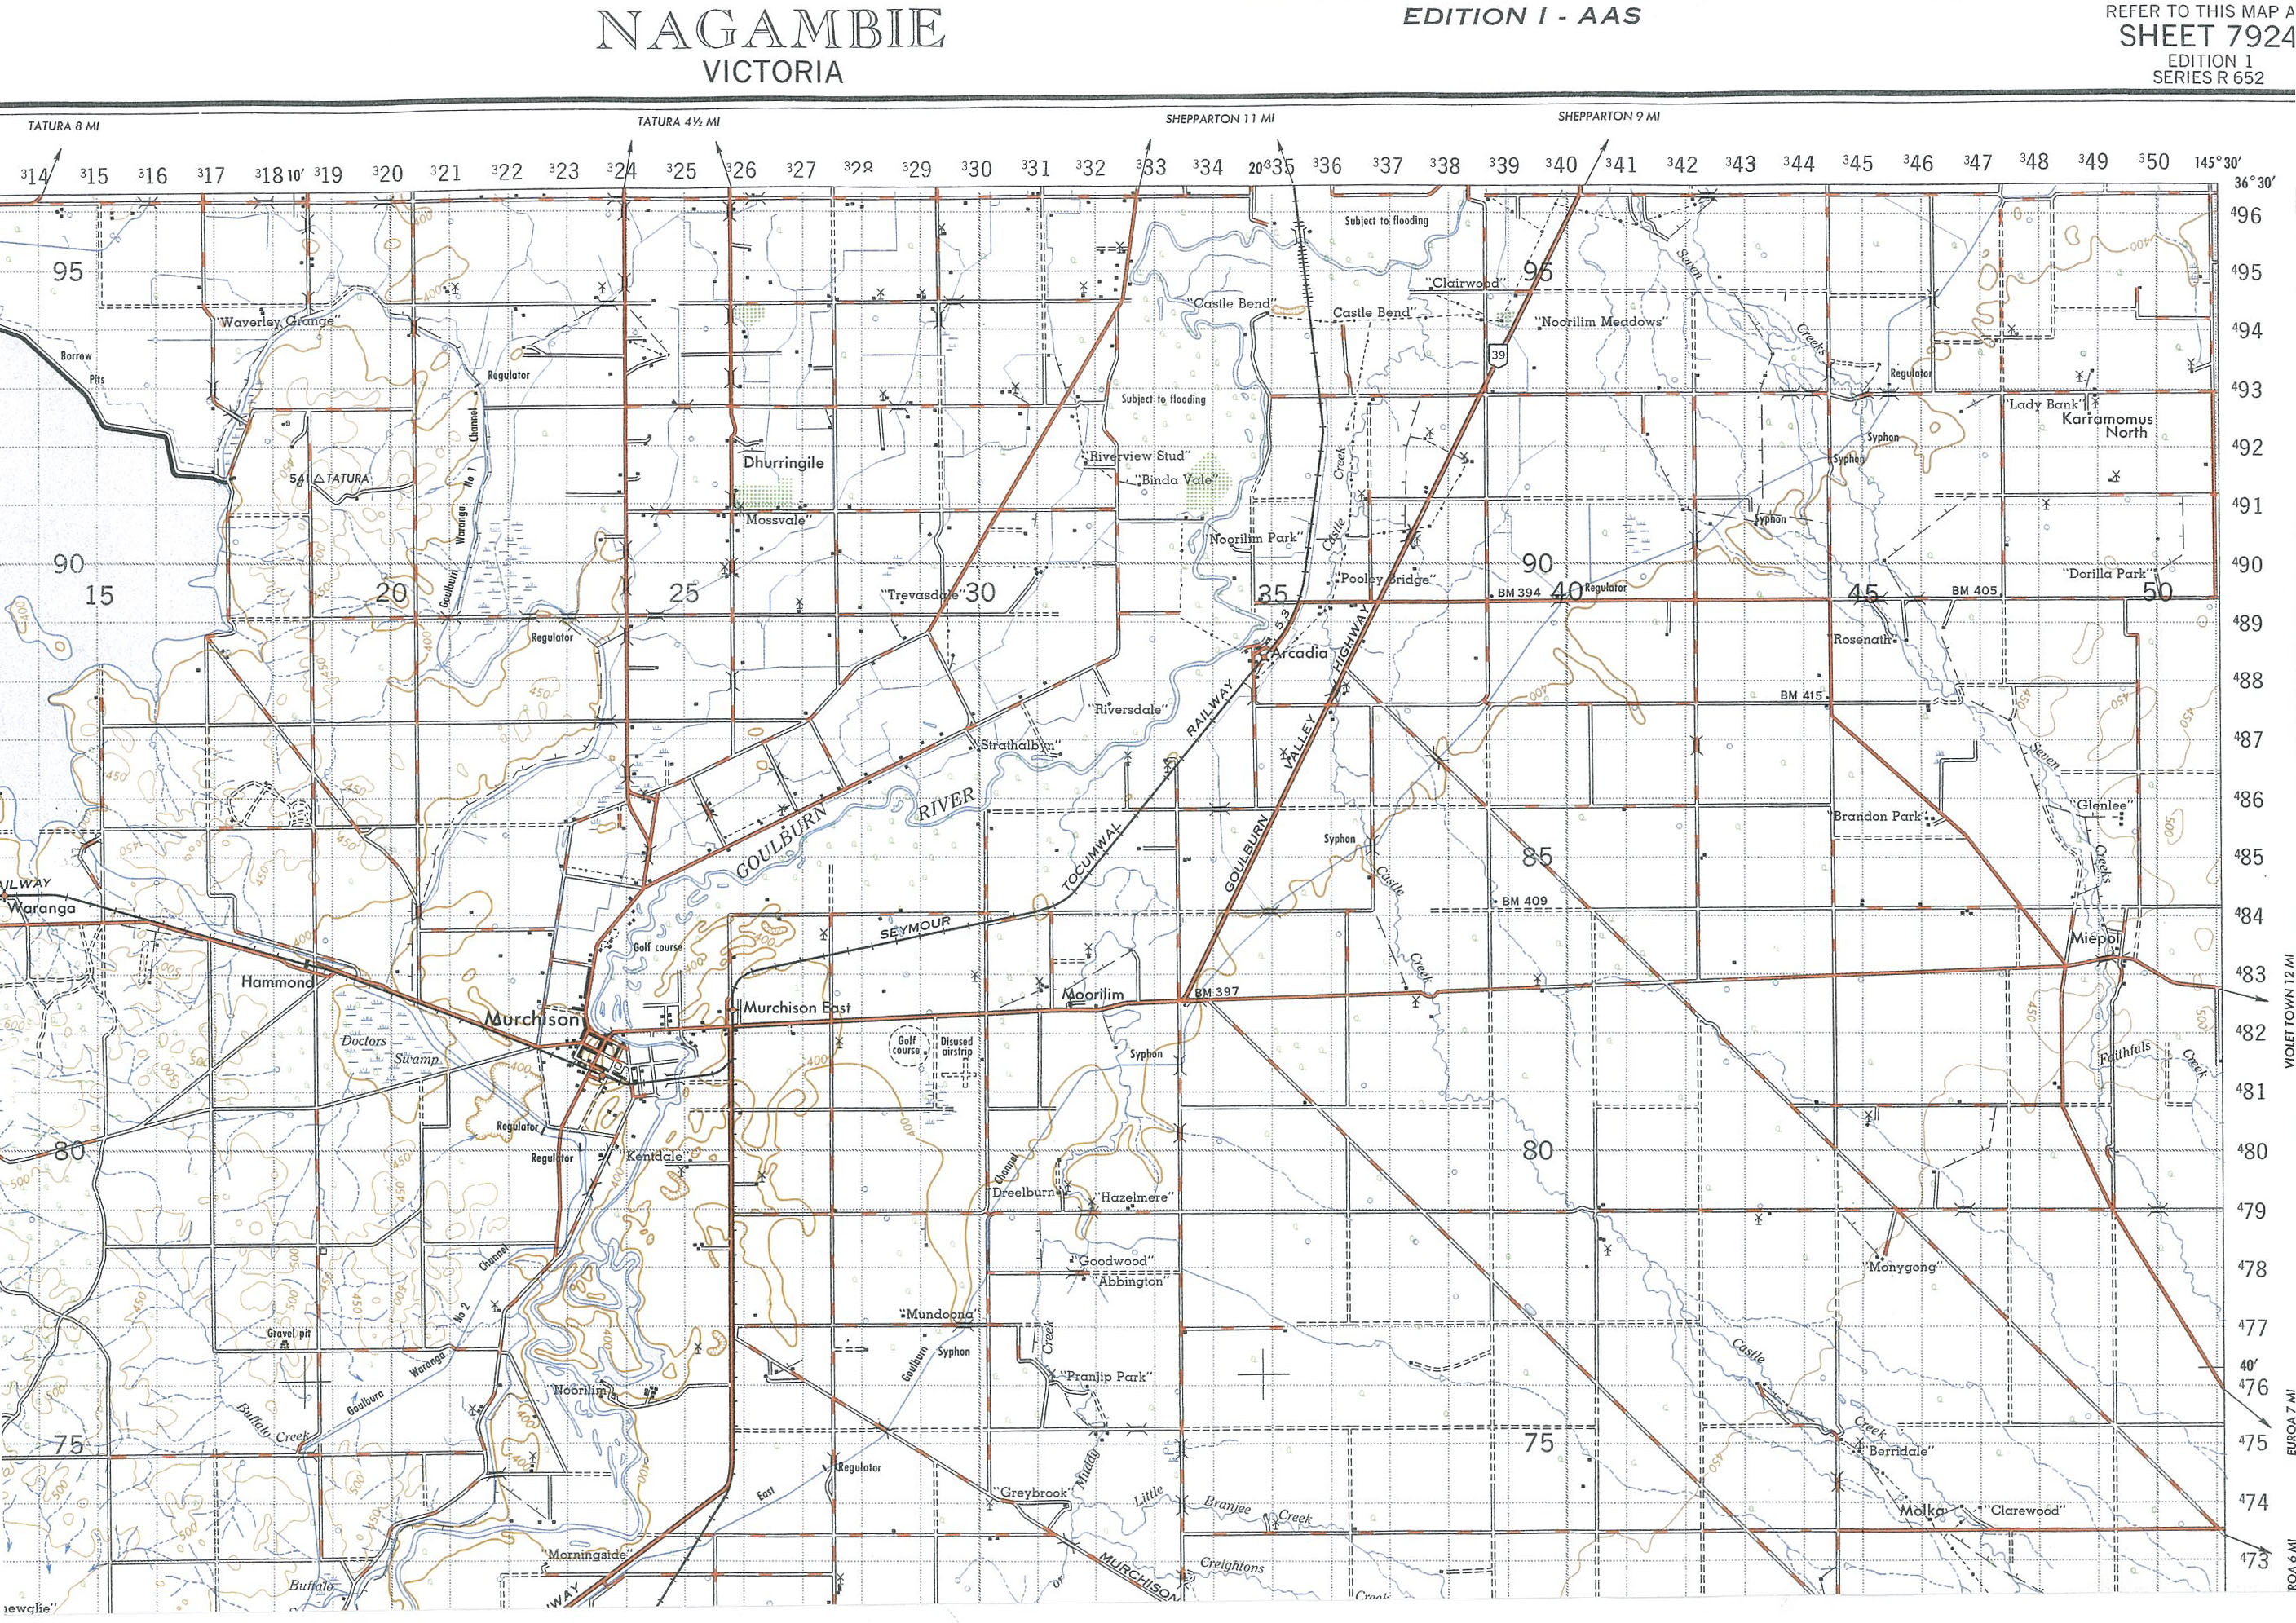
THE 1 : 100 000 scale TOPOGRAPHIC SERIES
Background
The ultimate objective of the National Mapping Programme is the provision, after completion of the 1 : 250 000 scale task of 1 : 100 000 scale topographical maps for all areas of developmental interest, this cover to be supplemented in special areas by larger scale mapping. It has also been decided that this series will be the standard medium scale map for the Army; it has already proved very popular with them, mainly because of the wealth of detail and contour information, and the fact that for the modern highly mobile Army a single map sheet at this scale covers the optimum area of ground.
A few sheets have already been published, mainly by the conversion of larger scale maps to Army specifications. Editions so far published have been solely by the Royal Australian Survey Corps. Figure 14 shows an example.
General Description
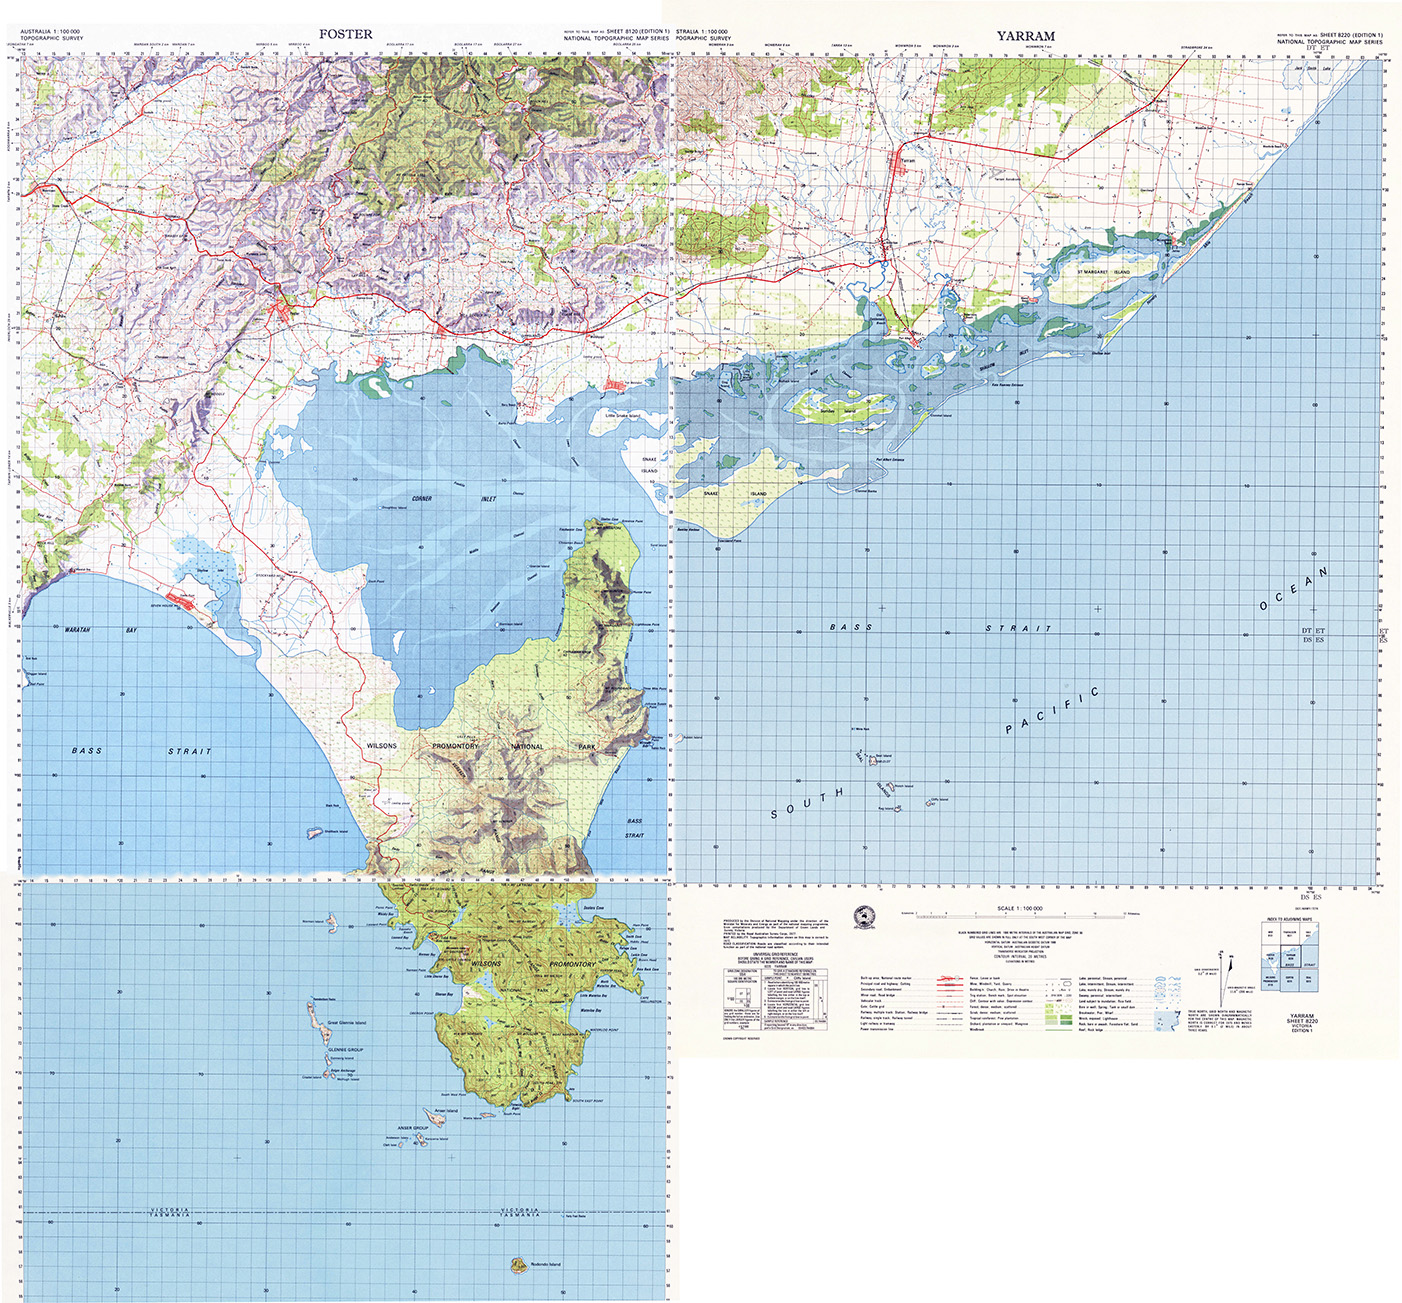
The format of these maps is different in that the longer side of the map sheet runs north - south; they are printed generally in five colours, black, blue, green, brown and red. The layout of these maps is conventional, and they appear to be clear, well balanced and well produced.
|
Australia 1 : 100 000 scale
|
|
|
Series Number |
R652 (in accordance with the international system in Appendix 2)
|
|
Sheet Name |
e.g. : NAGAMBIE (each sheet contains two of the old 1 mile scale sheets, and generally takes the name of one of them)
|
|
Sheet Number |
e.g. : 7924 (Australia is divided into 30 minute squares for this numbering system; as there are less than 100 squares in either direction and they are numbered west to east and south to north, each area can be located by four numbers, e.g. 79, 24.
|
|
Edition |
All sheets so far published have been First Editions.
|
|
Projection |
Universal Transverse Mercator. The National Mapping Council recently passed a resolution that future sheets in this series shall be on the Universal Transverse Mercator projection and 'the Australian National Spheroid, and will carry a metric grid.
|
|
Graticule |
Sheets are graticule - bounded, each one covering 0.5 degrees of Longitude x 0.5 degrees of Latitude
|
|
Grid |
The Universal Transverse Mercator Grid is shown by full lines on the face of the map at 1 000 yard intervals. The new metre grid will appear on all subsequent sheets.
|
Detail
All detail, including vegetation, compatible with the scale of the map is shown in accordance with the Army Manual of Map Specifications, based on those of the National Mapping Council. A full legend is given in the bottom margin.
Relief
The series is fully contoured at 100 feet interval, with supplementary contours at 50 feet intervals where thought to be warranted by flatter terrain. Contours are supplemented by trigonometrical point heights but very few spot elevations, particularly along roads, rivers, etc.
Compilation and coverage.
Although DNM has not yet produced maps in this series, their compilation for 1 : 250 000 scale is carried out at 1 : 100 000 scale with the dual purpose of plotting most of the detail that will be required when mapping at the larger scale eventually commences, and being able to make copies of the manuscript compilation available to certain users as early as possible - an example of such a copy has already been seen in Figure 12.
AAS : Compilation from RC-9 photography flown at 25 000 feet will be at 1 : 75 000 scale, and plotting carried out on Wild B8 stereoplotters. The sheets so far published in this series however, have been compiled from 2 inch Lands Departments maps or 1 inch Army Survey maps, usually with field revision and roads reclassified.
Fair drawing involves the normal colour separation and scribing techniques, similar to those described for the 1 : 250 000 scale.
Lithographic printing is carried out on the two colour rotary offset presses used for the 1 : 250 000 scale; final trimmed sheet size is also the same, 29 inches x 22.5 inches.
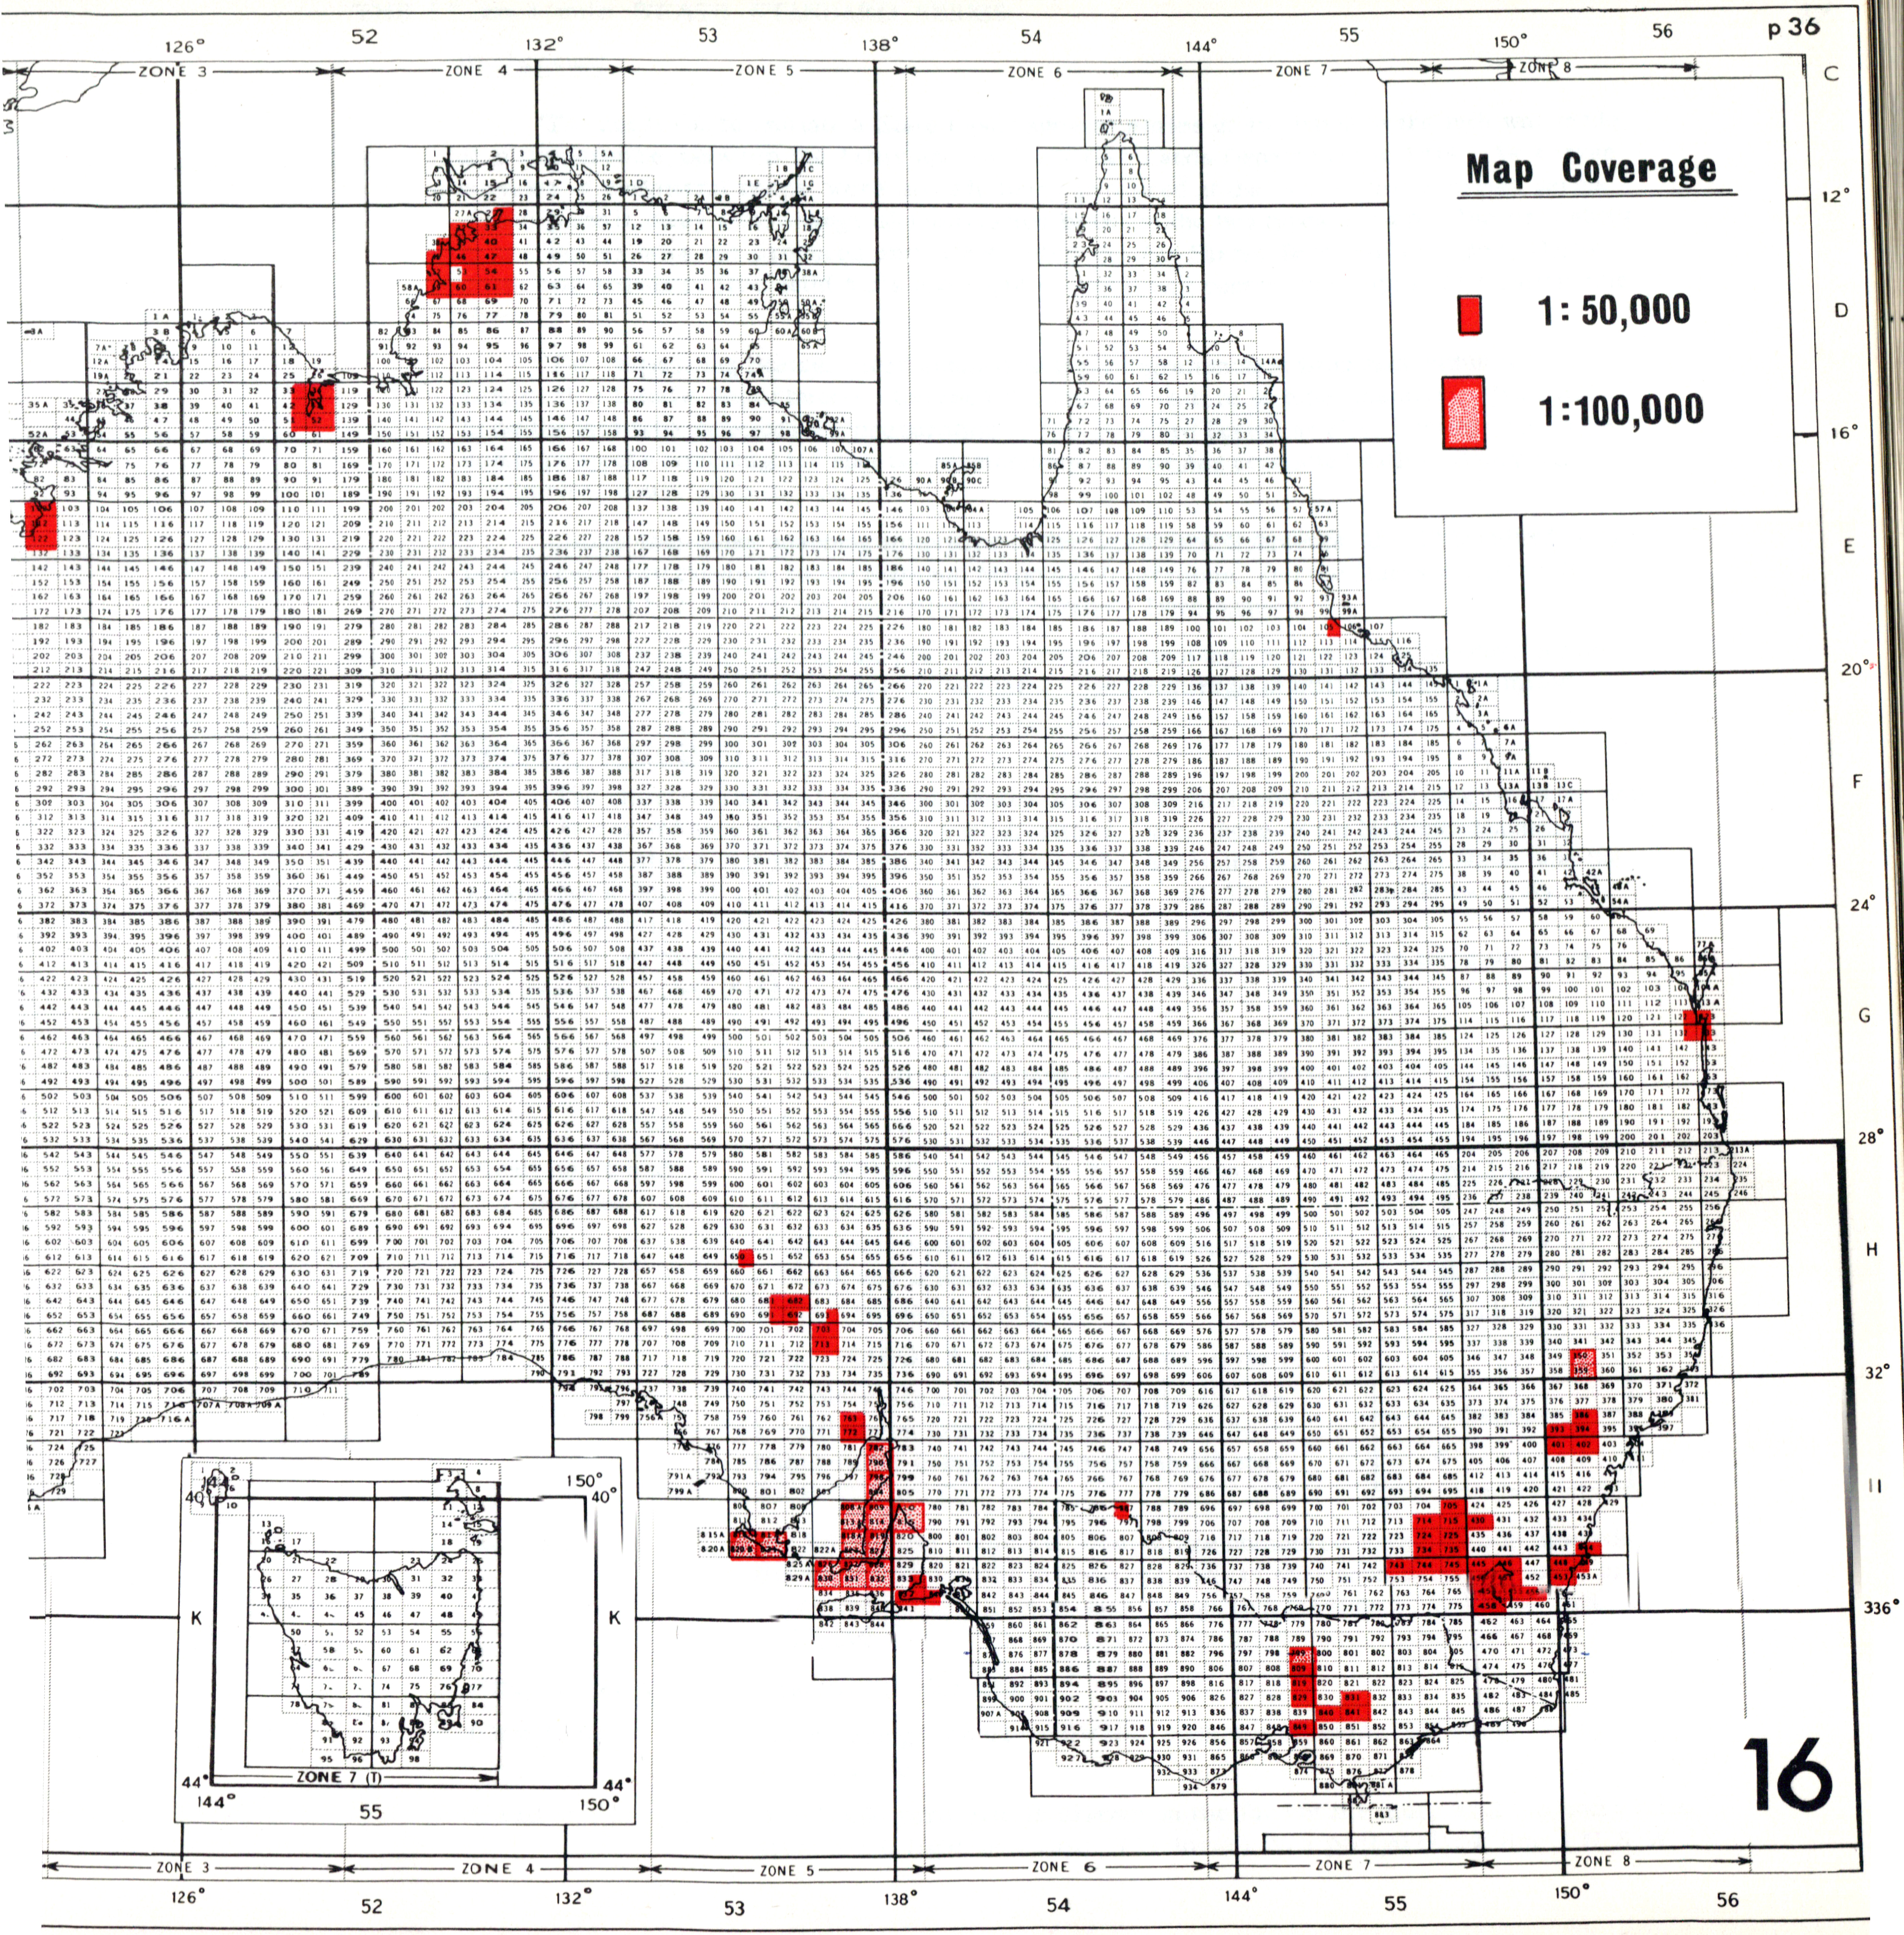
Only fourteen sheets have been published to date, twelve of these being in the area bordering Spencer Gulf in South Australia, one in Victoria (Nagambie) and one in NSW (Murrurundi). An index to sheets published is given at Figure 16.
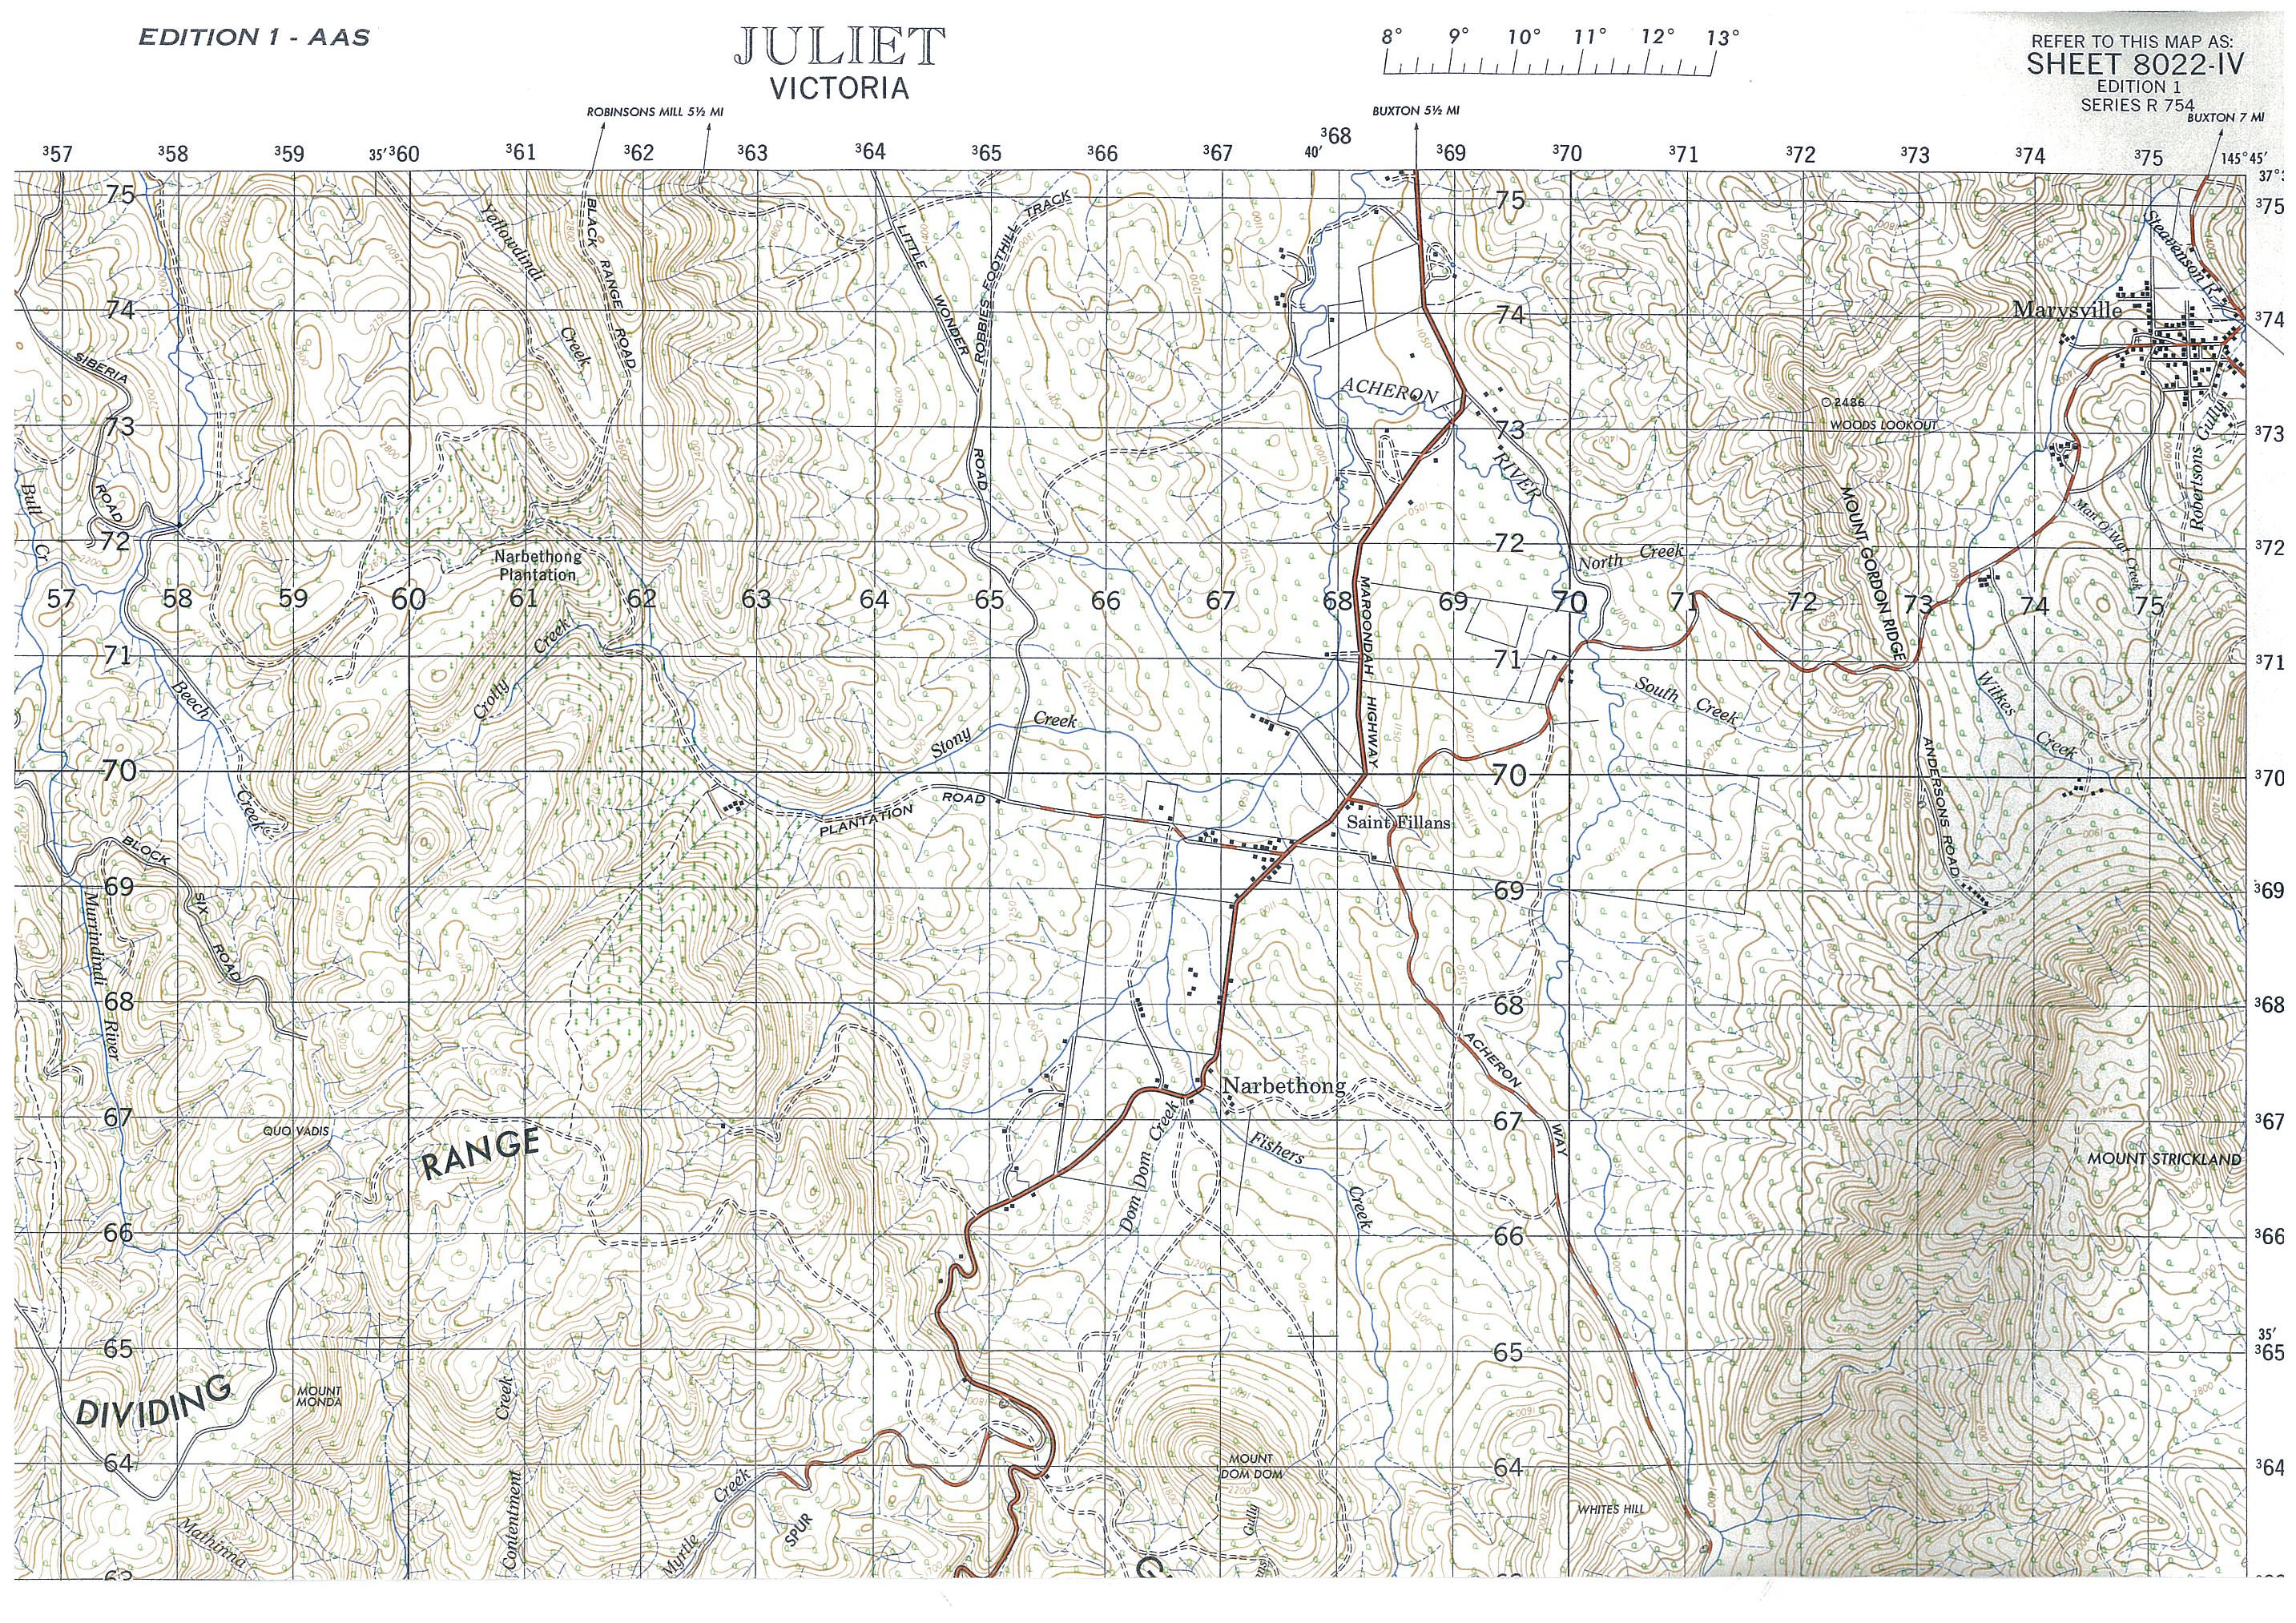
THE 1 : 50 000 scale TOPOGRAPHIC SERIES
Background
Originally designed in 1956 to supersede the 1 inch to the mile scale mapping, this series has been greatly curtailed recently as the Commonwealth authorities concentrate on the 1 : 250 000 scale task. It is certain that 1 : 100 000 scale mapping will gain impetus as the 1 : 250 000 scale series nears completion, and this probably means that for many years 1 : 50 000 scale mapping may not extend beyond a small number of priority areas.
General description
Almost identical in layout and style with the 1 : 100 000 scale sheet (Figure 15 shows an example) and printed in the same colours, there is little comment of any significance to be added concerning this series except perhaps by way of comparison with the series it replaced. The larger scale, giving two sheets to each of the corresponding 1 mile scale sheets, is a mixed blessing to the civilian user, for the improvement of clarity is set against the disadvantages of having twice the number of sheets and an unfamiliar scale to deal with. In military and scientific fields the above disadvantages are hardly valid, and in the former case, these maps may well prove to be a more than satisfactory substitute for purposes hitherto catered for by the 1 : 25 000 scale military series.
|
Australia 1 : 50 000 scale
|
|
|
Series Number |
R753 (in accordance with the international system in Appendix 2)
|
|
Sheet Name |
e.g. : JULIET (one sheet usually bears the name of the corresponding 1 mile scale sheet, the other being given a new name.
|
|
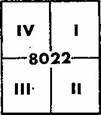
Sheet Number |
e.g. : 8022-IV (the 1 : 100 000 scale area is divided into four, which are given Roman Numerals as follows :
|
|
Edition |
The majority of the sheets published so far have been fully contoured First Editions. However, 17 sheets in the Northern Territory were published as Provisional Editions, in black and white, indicating relief only by form lines - these maps have the appearance of hastily drawn sketch maps, and are not comparable to the First Editions.
|
|
Projection |
Universal Transverse Mercator
|
|
Graticule |
Sheets are graticule - bounded, each one covering 0.25 degrees of Longitude x 0.25 degrees of Latitude
|
|
Grid |
The Universal Transverse Mercator Grid at 1 000 yard intervals
|
Cultural and other detail
All detail compatible with the scale of the map is shown in accordance with the Army Manual of Map Specifications, based on those of the National Mapping Council. A number of early sheets, reproduced by enlarging 1 inch to the mile scale compilations, have a consequent coarseness of line which fortunately is not evident on later ones, which are particularly notable for the quality of draughtsmanship.
Relief
The first Editions are contoured at 50 feet interval. The new scale does little to improve the appearance of contours in rugged country, their clarity depending rather on the thickness and qualify of line. Many instances can be found where the 1 inch contours, compared with the same contours at the larger scale, are in fact more legible. Contours are often allowed to run together on very steep slopes, and this habit is only occasionally avoided by using a cliff or steep slope symbol.
Compilation and coverage
Using the Wild B8 stereoplotter with 1 : 80 000 scale RC-9 photography, plotting can be carried out at publication scale without loss of accuracy. This is the accepted method, but where larger scale maps are available, these are used. Several of the sheets in New South Wales and Victoria have been compiled mainly from existing Military or State 1 inch and 2 inch maps.
Scribing is carried out on Astrascribe or Stabilene, the latter being preferred for its resistance to scratching.
The techniques and processes involved in drawing, proving etc. are similar to those employed for 1 : 250 000 scale mapping by the same establishment.
Printing is carried out on the Lithographic Squadron's two, colour rotary offset presses, and the final trimmed sheet size is also 29 inches x 22.5 inches.
At the present time, the following number of sheets have been published, mainly covering selected Army training areas and other areas of special interest to the Commonwealth :
|
New South Wales |
54 First Editions |
|
Victoria |
15 First Editions |
|
South Australia |
19 First Editions |
|
Western Australia |
15 First Editions |
|
Northern Territory |
27 First Editions 17 Provisional Editions |
|
Queensland |
5 First Editions |
|
Total (1956-1965 ) |
152 |
THE 2 inches to 1 mile scale STATE STANDARD SERIES
Background
The decision to initiate a State topographical series at 40 chains to the inch was made at a conference between the Army and the Victorian Lands Department in 1944. As a large number of cadastral maps were already being produced at that scale, the proposed series would permit easy interchange of information between the two types of map. The first sheet in the series was not produced until 1949, after the Air Survey Branch of the Lands Department had acquired five Wild A6 stereoplotters and supplied sufficient control to compile the Castlemaine sheet.
The remaining States, after establishing photogrammetric branches within the respective Lands Departments, followed the general pattern of topographic mapping, which fell broadly into two categories, preparation of the Standard Series at 2 inches to 1 mile scale, and large scale project mapping for special developmental schemes connected with engineering, irrigation, town planning etc.
Unlike the other mapping activities of the State establishments, the 2 inch Standard Series is a direct contribution to the National Mapping Programme, and the States are partially re-imbursed for this by the Department of National Development.
Owing to the pressing nature of the project mapping, output of the Standard Series has recently diminished in most of the States, and coverage is still extremely limited.
General description
The sheets produced by the six States differ only in minor details, being compiled and drawn in accordance with the same specifications, viz, those of the National Mapping Council. Nothing significant would be achieved by examining one from each State, and the examples at Figure 17a and Figure 17b may be taken as fairly representative of both the style and content of all of them (it should be remembered that Victoria has recently abandoned the 2 inches to the mile scale in favour of 1 : 50 000 scale).
|
Series Name |
2 inches to 1 mile scale Standard Series or AUSTRALIA 1 : 31 680
|
|
Series Number |
Not allocated
|
|
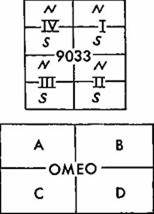
Sheet Name & Number |
e.g. : SCONE, 9033 - 1- N (new style) : The current trend is to favour the division of the corresponding 1 : 50 000 scale sheet into a North and a South sheet, and to give each sheet a separate name
e.g. : OMEO, A 824A (old style) : The older style of numbering divides the 1 mile scale area into quarters, the 1 mile sheet name being followed by the letters A, B, C, or D.
|
|
Edition |
All full colour contoured sheets are numbered Fist Edition upwards, the term Provisional Edition applying to the uncontoured coloured or black and white sheets at scales varying between 1 inch to 1 mile and 1 : 25 000
|
|
Projection |
Transverse Mercator
|
|
Graticule |
Sheets are graticule - bounded, each one covering 0.25 degrees of Longitude x 0.125 degrees of Latitude
|
|
Grid |
The 1 000 yard grid is shown on the face of the map, and the line varies from a full light blue line (Victoria) to a pecked black line (NSW)
|
Detail
All cultural, vegetation, and hydrographic detail is shown conventionally within the limits of scale. All the maps recently published are particularly notable for the clarity of the symbols, and a generally very high standard of draughtsmanship and reproduction.
Of particular interest is the practice in some States of overprinting (usually in light mauve) cadastral information. Portion boundaries and numbers, and County and Parish boundaries and names are shown - these features being particularly helpful to civil users (In NSW, the cadastral information is superimposed on the topographic map by recomputing the cadastral traverses on Transverse Mercator co-ordinates and fitting them onto control).
Relief
All First Editions are produced with 25 feet contours, or, where the steepness of the terrain may warrant it, 50 feet contours. Auxiliary contours may be shown by a dash-dot line, and in addition all sheets show spot heights. Provisional Editions, which may be either in colour or monochrome, depict relief by contours, form lines or hachures, depending on the amount of control available at the time of compilation.
Compilation and drawing
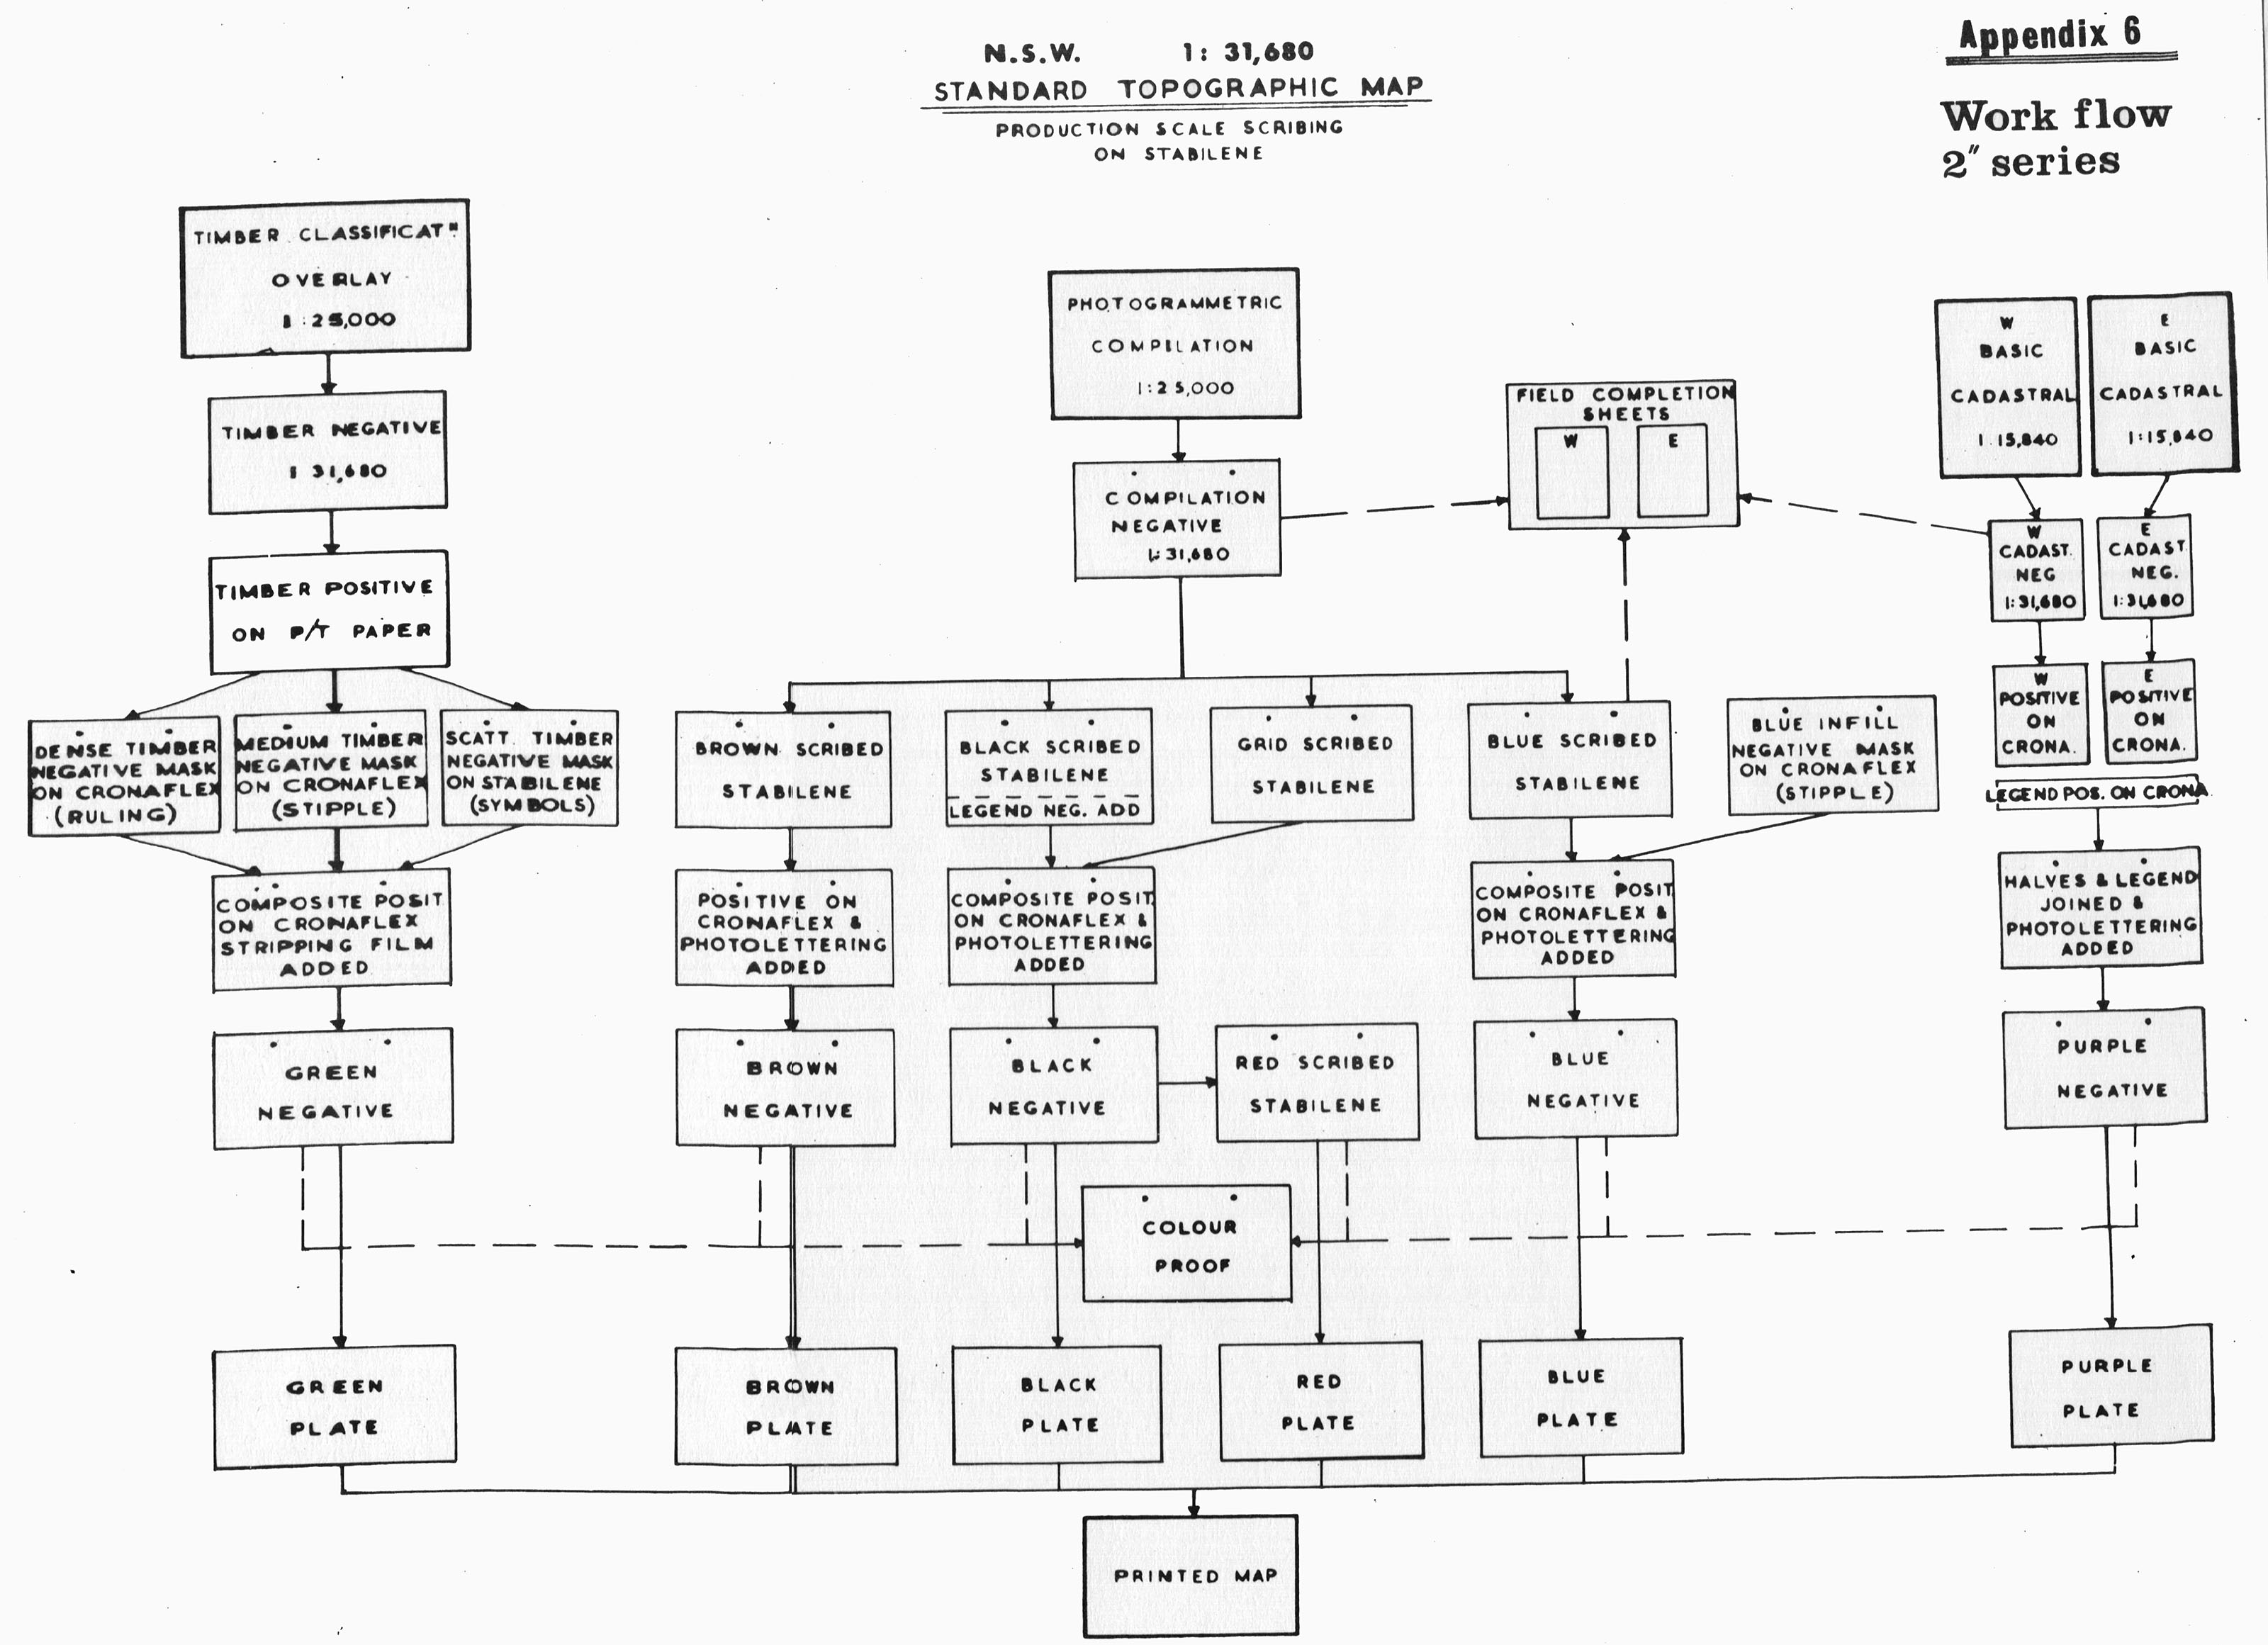
Similar equipment and techniques, including scribing, are used by all the State authorities in compilation of these maps. The work-flow chart (Appendix 6) for the NSW drawing procedures may be taken as fairly representative of all States; similar charts are in the course of being prepared by the other States for the National Mapping Council. The following notes for the other States give a good indication of the equipment and techniques used :
VICTORIA : Aerial photography is carried out by private contractors using a variety of cameras ranging from the Wild RC-9 superwide angle to the Wild RC-7 plate camera which is the property of the Department. Photogrammetric equipment includes Wild A5, A6, A7 and A8 stereoplotters, some equipped with automatic recording devices; Kern PG2 stereoplotters; Williamson SP3 and APU Multiplexes.
Field work is carried out with Tellurometers as well as modern theodolites and levels; vertical control is supplemented by the Jerie method. Colour separation is by scribing; photolithography is carried out by the Central Plan Office; printing is by the Government Printer using Geo. Mann single colour presses.
QUEENSLAND : Available photography has been used, flown at 12 000 feet with a 6 inch focal length lens camera, but in the current contract provision has been made for 1 : 50 000 scale photography to be flown specifically for these maps. Aerotriangulation is carried out on Wild A5s or SP3 Multiplexes; plotting on A6s or B8s and APU Multiplexes.
Compilation is at production scale; colour separation is by scribing; printing is carried out by the Government Printer using a Roland Ultra two colour press.
WESTERN AUSTRALIA : Photography at a scale of 40 chains to the inch is used, and plotting is carried out by Multiplex at a compilation scale of 16 chains to the inch; these are then reduced photographically to reproduction scale. Colour separation and fair drawing are carried out by positive drawing on Astrafoil.
TASMANIA : Photography used has been at a scale of 45 chains to one inch. Plotting has been carried out on a Wild A8. All photolithography work is carried out by a private firm.
SOUTH AUSTRALIA : Scale of photography for standard mapping is usually 1 : 60 000 scale, and the Aerial Photography Section uses a Wild RC-7 plate camera. Aerotriangulation is carried out on Wild A5 Autographs; plotting on A5s or A6s.
Coverage
The number of sheets published, to date is as follows :
|
New South Wales |
57 |
plus |
104 |
Provisional editions at various scales |
|
Victoria |
114 |
plus |
7 |
Provisional editions at 1 inch to 1 mile scale |
|
Tasmania |
28 |
plus |
2 |
Provisional editions |
|
South Australia |
28 |
plus |
4 |
Provisional editions |
|
Western Australia |
24 |
plus |
19 |
Uncontoured editions |
|
Queensland |
9 |
|
|
|
|
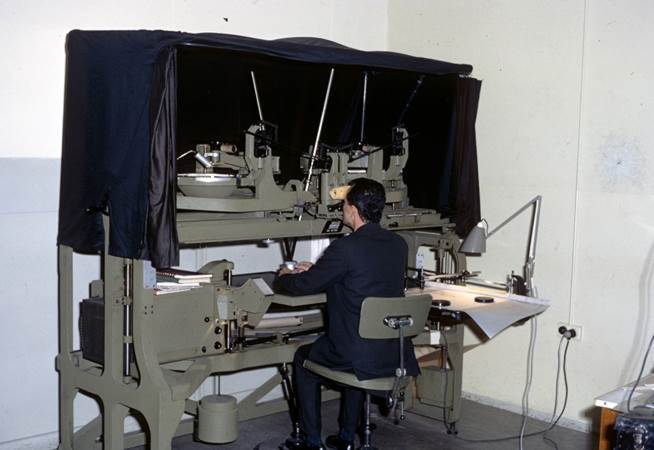
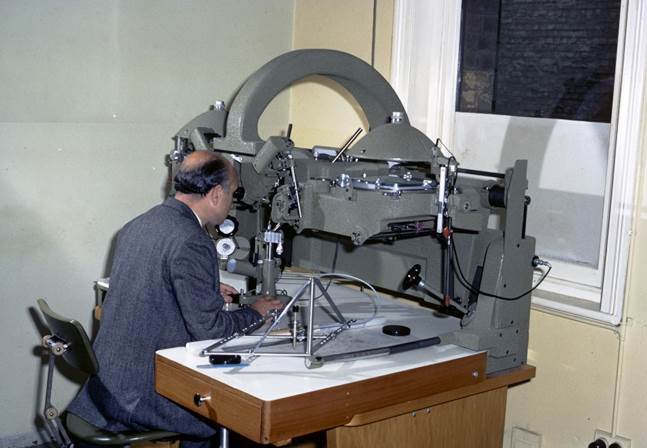
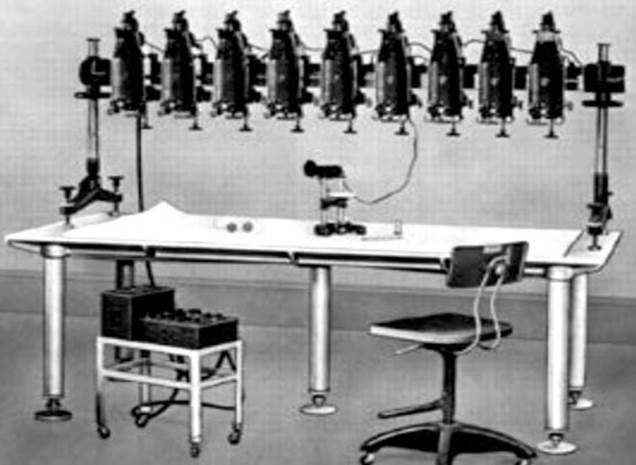
XNATMAP Photographs of some of the Photogrammetric Equipment mentioned above |
|
|
|
|
|
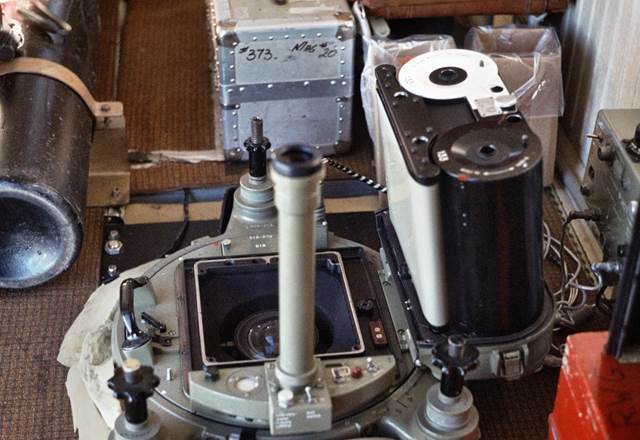
Wild RC-9 aerial camera showing film plane |
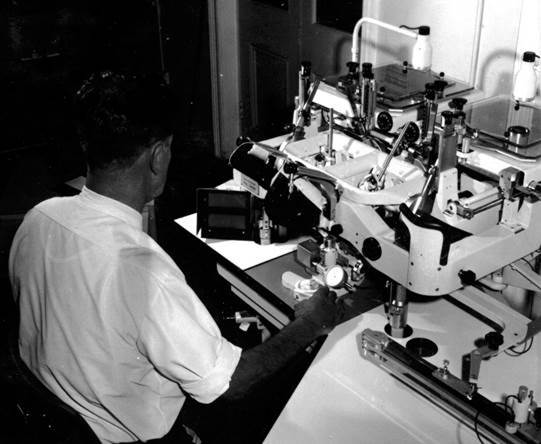
Kern PG2 stereoplotter |
|
|
|
|
Wild A6 stereoplotter |
Wild B8 stereoplotter |
|
|
|
|
Multiplex Aeroprojector with 9 projectors for projecting aerial photos onto map plane |
|
Part III : AN EVALUATION OF THE CURRENT SERIES
THE NEED FOR MAPS
Unprecedented activity in resources and developmental surveys throughout Australia has led to an urgent demand for a general national coverage of small and medium scale maps, supplemented by larger scale fully contoured maps for scientific projects. To this must be added the military requirements for defence purposes, aeronautical and nautical charts maps for administrative purposes, and maps for the use and benefit of the general public. All these requirements must somehow be economically and speedily satisfied if the nation is to progress.
It can be seen that the need for maps in Australia is substantially different from that of the United Kingdom, where the national mapping requirement is largely oriented towards planning needs. A comparison is given below between the topographic scale-groups of the two countries :
|
UNITED KINGDOM |
AUSTRALIA |
||
|
1 : 1 000 000 |
International Style |
1 : 1 000 000 |
Australian Geographical Series |
|
1 : 625 000 |
OS Topography (2 sheets) |
N/A |
|
|
1 : 250 000 |
OS Quarter Inch |
1 : 250 000 |
Topographic & Planimetric Series |
|
1 : 126 720 |
OS Half Inch |
1 : 100 000 |
Topographical |
|
1 : 63 360 |
OS One Inch |
1 : 50 000 |
Topographical |
|
N/A |
1 : 31 680 |
State Standard Map |
|
|
1 : 25 000 |
OS 2.5 Inch |
1 : 25 000 |
Topographical – restricted Artillery Map |
|
1 : 10 560 1 : 2 500 1 : 1 250 |
OS Six Inch OS 25 Inch OS 50 Inch |
1 : 31 680 or larger scales |
State mapping of various kinds
|
|
OS stands for Ordnance Survey, the UK’s national mapping agency |
|||
THE NATIONAL MAPPING PROGRAMME
The Basic principles
The Director of National Mapping has stated the principles on which the National Mapping Programme is based as follows :
|
i |
that the ultimate and most desirable form of presentation of topographical data is a fully contoured map, and that all such mapping must be based on a national geodetic survey;
|
|
ii |
that as much information as possible should be provided as early as practicable;
|
|
iii |
that many users can make use of a planimetric indication of relief and do not necessarily require its portrayal in measurable form;
|
|
iv |
that there is always a continuing need for revision;
|
|
v |
that greater efficiency will result if large areas can be tackled rather than small isolated priority areas.
|
It was further stated that the final objective (overall coverage with fully contoured maps) could equally quickly be provided by a staged programme of air photography, uncontrolled photomaps, planimetric maps, and contoured maps. The main advantages would then be that principles (ii), (iii) and (iv) above would be satisfied, in addition the latest developments in survey and mapping techniques and equipment would become available at the more complicated stages of the work.
The Programme
On these principles and conclusions the National Mapping Programme is based, and is staged as follows :
|
First |
the provision of a nation wide coverage of aerial photography; this is now completed, with the use of superwide angle cameras to give 1 : 80 000 scale photography;
|
|
Second |
the provision of uncontrolled photomaps as soon as photography is made available; this is a continuing process as new photography is acquired; |
|
Third |
provision of planimetric maps at 1 : 250 000 scale over the whole country, and in the course of doing so, making available to users copies of manuscript compilations (usually at 1 : 100 000 scale) ;
|
|
Fourth |
provision of fully contoured maps at 1 : 250 000 scale over the whole country;
|
|
Fifth |
provision of contoured maps at 1 : 100 000 scale in areas of special developmental or military interest; in very special circumstances 1 : 50 000 scale maps may be produced.
|
Priorities within the national survey and mapping programme have been allocated to developmental surveys of immediate importance, in particular, to the air photography and mapping of the Sedimentary Basins in connection with the intensified search for oil. These areas are marked on Figure 18 [updated map version showing Sedimentary Basins]. These requirements have now largely been satisfied by the first editions of the 1 : 250 000 scale mapping programme.
Other priorities relate to requirements of developmental investigations including land use, soils, minerals and water resources, as well as specific requirements of the Northern Territory Administration (Department of Territories). and the Weapons Research Establishment (Department of Supply). These last two areas are shown as A and B in Figure 18.
The Royal Australian Survey Corps has a primary commitment to satisfy the requirements of the General Staff of the Army in all phases of mapping for military purposes, as well as assisting with the National Mapping Programme.
Priorities for State 2 inches to the mile scale mapping are, by comparison, less pressing, and in fact the programme is seriously curtailed by the large amount of project mapping undertaken by almost all the State mapping establishments.
Control Surveys
The prime object of the national geodetic survey is to ensure that the requisite control data is available in advance of the later phases of topographical mapping. It can be appreciated that full consideration of it is beyond the scope of this work, but an outline should be given here in order to relate it to the mapping programme above.
Initially, for horizontal control, a large number of astrofixes were observed in addition to existing triangulation and traverse control, but current provision is based on first order Tellurometer traverses controlled for azimuth by frequent Laplace stations. It is planned to extend this with the aid of airborne distance measuring equipment (Aerodist) and/or second order Tellurometer traverses.
For vertical control, barometric spot heights and miscellaneous levelling is being used, but it is planned to cover the country with a network of third order levelling. This will be supplemented by heights obtained from fourth order levelling, helicopter-borne barometer heighting, the Airborne Profile Recorder, Johnson Ground Elevation Meter etc.
Progress
The national mapping requirement is given in Figure 19. It should be compared with Figure 20, which is a composite diagram for all the map series considered in this book. In the inner area, it can be seen that 1 : 250 000 scale mapping in the Planimetric editions is nearing completion, while very little inroad has yet been made on the 1 : 100 000 scale map requirement. Much material is available at the latter scale however, in the form of manuscript compilations, prints from which are already widely used.
Wartime and pre-war mapping at 1, 4, and 8 miles to the inch scales is of comparatively little value today, and has been excluded from Figure 20, which is designed principally to reveal the progress made towards meeting the present nationwide need for maps. Bearing in mind the short history of topographical mapping and the vast size of the continent, the situation is surprisingly encouraging, and continues to improve rapidly.
THE MAP USER SURVEY [deleted 2021]
This section was considered to contain extremely dated and limited information so has not been included.
Information on later Federal map and data products may be found via this link.