Looking Back to Earth
John Richards and Paul Wise
From “To Mars and Beyond” published by the National Museum of Australia,
reproduced with permission.
We now take for granted views of the Earth from space. It is easy to forget how recently this has become possible and how much technology is needed, not only to capture those views but to put them to use for the benefit of humankind. From Arthur C. Clarke’s 1947 vision of using artificial satellites for global telecommunications, and the first demonstration of a satellite with the launch of Sputnik in 1957, we now readily accept that services provided by satellites form part of our everyday lives.
Within a lifetime we have moved from a vantage point no higher than an aircraft, to one where we can see the whole disc of the Earth, often in real time. It is easy to imagine the feelings of the Apollo astronauts in the 1960s when, on their journey to the Moon, they looked back for the first time and saw the Earth floating in space as a discrete sphere on which its oceans, land masses and weather patterns could be seen globally and dynamically. Even more when they observed “Earthrise” from the Moon they would have been drawn to the beauty and detail of the features of the Earth shown in relief against the Moon’s horizon. It would not have taken much imagination to realise that viewing the Earth and its processes from afar offered the potential to understand the fragility of our ecosystem and to monitor and manage our resources in a manner otherwise not possible.
We had, of course, experience with observing the surface of our Earth from aircraft and, through the use of on-board scientific instruments, gathering data that could be applied to crop monitoring and mineral exploration. But a space-related observation point suggested that wide ranging synoptic views should be possible, that many applications could be served simultaneously, and that regular and global monitoring of our Earth could be envisaged.
As it happened, the first applications-oriented space platforms used for looking back at the Earth were the early weather satellites. TIROS-1 launched in 1960 preceded the Apollo observations by several years. Since then there have been many meteorological satellites launched by several nations to provide us with near global forecasting and monitoring of weather conditions. Some of those satellites travel in orbit around the Earth and provide imagery as they pass over particular regions of interest, while others, starting with the US Geostationary Operational Environmental Satellites in 1974, in so-called geo-stationary orbits, can provide much more regular weather observations. A geo-stationary orbit is one in which the rotation of the satellite, in orbit above the equator, matches the Earth’s own spin so that the satellite appears to be stationary overhead.
Weather satellites can view large portions of the Earth’s surface at any one time. The US National Oceanographic and Atmospheric Administration’s, orbiting satellites view almost half of Australia on each pass. Fig.1 shows an almost cloud-free composition of several passes providing a view of the whole of Australia and not only its nearby cloud patterns but the distribution of vegetated and arid regions as well.
Before looking at spacecraft designed specifically to observe the Earth’s surface, it is useful to consider briefly other types of satellite missions in the service of humanity. Overseas telecommunications would not be so readily available without the use of communications satellites, again usually placed in geo-stationary orbit. Most modern navigation systems rely on the Global Positioning System (GPS) which consists of a cluster of 18 satellites orbiting the Earth in a birdcage fashion, any four of which can be used by observers on the Earth to determine their position in three dimensions to accuracies of the order of 10 metres or so. While communications and navigational satellites are not Earth observing, they do play a major complementary role in creating an operational Earth observing system.
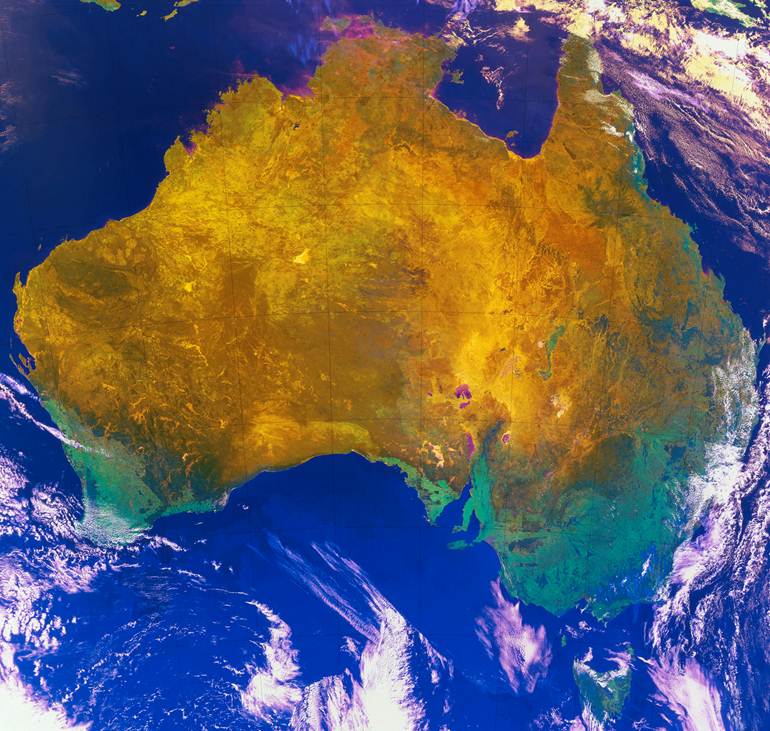
Fig.1 A combination of NOAA data swaths to provide a 1km resolution cloud free view of the whole of Australia.
Images acquired by ACRES. © Commonwealth of Australia.
Satellites are also used for intelligence gathering. In many ways these are similar to the Earth observing satellites described below, but they are generally capable of seeing much greater detail. Since the end of the Cold War the technologies of surveillance satellites have become available for civilian applications.
The Landsat Program
Experience gained with observing the Earth’s weather from space, and with the nature and value of data that could be recorded from aircraft, suggested that it should be possible to design a spacecraft system that could observe the Earth’s resources over the whole globe on a regular basis. So in July 1972 the Landsat program was born, with the launch by the USA of Earth Resources Technology Satellite-1, later renamed Landsat-1.
Landsat-1 was placed into a circular orbit that took it almost over the poles but in such a manner that the orbit precessed around the Earth at the same rate that the Sun moves across the Earth’s surface. Such an arrangement is called Sun-synchronous and has the benefit that any instruments carried on the satellite view the Earth under approximately the same conditions of solar illumination on every orbit. These Sun-synchronous orbits are a feature of almost all Earth-observing satellites; the satellites themselves are often called remote sensing satellites since observing the Earth from spacecraft or aircraft platforms is known as remote sensing.
The imaging instruments carried on remote sensing satellites generally view the Earth directly 700–900 kilometres below, and the forward motion of the satellite allows a continuous image ‘swath’ to be recorded. In the case of Landsat the swaths are 185 kilometres in width and the recorded data, when gathered by a ground receiving station, are generally composed into 185 x 185 kilometre frames. It is possible to purchase frames of this coverage or to buy selected subsets.
In principle, the images recorded by satellites like Landsat are just like the scenes we would see if we looked through a window in the bottom of the satellite. We observe the landscape because sunlight reflecting from the Earth’s surface makes it visible to us. It is the same with the satellite sensors - they record images using reflected sunlight. However they can do that at wavelengths not visible to us. We see scenes in a range of wavelengths from visible blue through to visible red. Remote sensing satellites can do that too, but their sensors also allow them to see the Earth’s surface beyond the visible out into the near- and middle- infra-red wavelengths. The sensors are designed to record imagery in a set of discrete bands of wavelength. We refer to those wavelengths as being in the optical range, and the satellites that use them are frequently referred to as optical Earth observing or optical remote sensing satellites.
For Landsat-7, the most recent in this series, there are wavebands covering the blue, green, and red wavelengths, along with three in the near and middle infra-red, and another, termed the thermal band, that detects heat emanating from the Earth itself. Landsat-7 also has a single band that covers a broader visible wavelength range, and in so doing allows greater detail to be observed in the recorded image. This is called a panchromatic band, because of its broad wavelength (or so-called spectral) coverage.
The degree of detail seen in an image is governed by the spatial resolution provided by the sensor. Each image is composed of individual discrete picture elements called pixels, within which no detail is evident. The size of a pixel in terms of equivalent metres on the ground sets the spatial resolution. The pixel size for the very early Landsat satellites was 80 x 80 metres while for the instrument known as the Enhanced Thematic Mapper+ (ETM+) on Landsat-7 it is 30 x 30 metres for all wavebands except the thermal band for which it is 60 x 60 metres, and the broad visible panchromatic band which displays pixels of 15 x 15 metres.
So the data recorded by remote sensing satellites consist of a set of images which cover a square geographical region on the ground, each corresponding to observations at different wavelengths, and each resolved into pixels. When we want to look at the recorded data we can do so by displaying each band separately, or we can combine sets of three bands by displaying them respectively in each of the primary colours (blue, green and red) on a computer monitor. That gives rise to a colour product in which the colour renditions of different features on the ground depend upon which of the recorded wavebands are used and how they are associated with the colour primaries. Fig. 2 shows one such colour composite of an image recorded over Adelaide. Because two infra-red bands have been used in creating the image the colours do not represent the natural colours of the scene
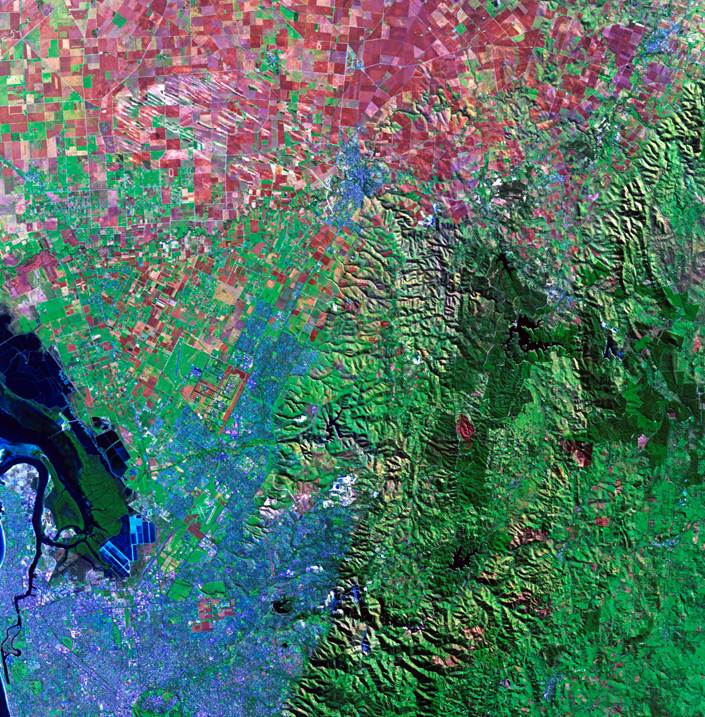
Fig. 2 Landsat image recorded over Adelaide on 20 May 1989. In this composite image only three of the seven bands recorded are used in giving the colour rendition.
Images acquired by ACRES. © Commonwealth of Australia.
The data acquired by remote sensing satellites are recorded digitally, which facilitates both transmission to a ground receiving station and subsequent archiving and processing. Generally each waveband has its own detector or detector set which, when illuminated by energy coming from the landscape, generates electrical signals that represent the properties of the pixel currently being observed. Current detectors can identify at least 256 levels of relative brightness compared with only about 16 detectable by the human eye.
Ever since 1972 the data recorded by the Landsat satellites have found many applications, ranging from environmental monitoring, vegetation assessment, land degradation, the impact of floods and fires, land use management, mineral exploration, crop forecasting and forest monitoring. Fig. 3 shows then random agricultural pattern west of Goondiwindi, Queensland. This area is also subject to flooding leaving the unusable “whitish” areas when the water drains away so farmers have to make the best use of what arable land remains, resulting in the unusual field layout.
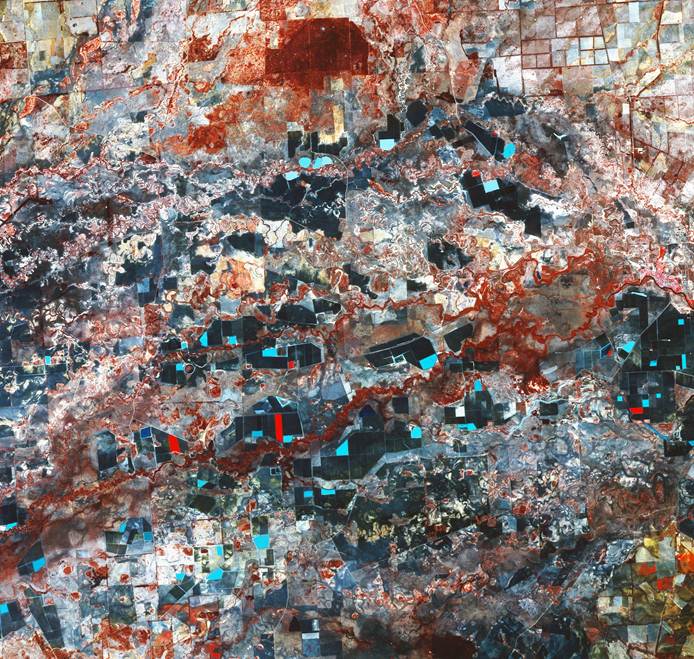
Fig. 3 The random agricultural pattern west of Goondiwindi, Queensland due to flooding.
Image acquired by ACRES. © Commonwealth of Australia.
International Programs
So successful was the early Landsat program that many nations have entered the business of remote sensing, with the design and operation of their own satellites. France launched SPOT-1 in 1986, followed by several further platforms in the series, culminating to date in SPOT-5; (which records in four wavebands over the visible and infra-red range with a spatial resolution of 20 x 20 metres, and in a panchromatic band of 5 x 5 metres resolution. India, Japan and the former Soviet Union among others have orbited remote sensing satellites over the past two decades. While their technologies have all been slightly different, the nature of the imagery recorded has been much the same, consisting of sets of pictures corresponding to different wavebands of observation, resolved into pixels. Australia launched its own Fedsat in 2002 (finally failing in 2007) as a demonstration that this country could re-enter the family of space-qualified nations after a hiatus of almost 35 years following the launch of the experimental WRESAT in 1967. Although not Earth observing, WRESAT did carry scientific instruments; more importantly though, it showed Australia’s early potential as a supplier of space hardware.
Seeing the Earth Differently – the Spectral Domain
The imagery illustrated in Figs 2 and 3 has been displayed as it has been recorded - as though it were a photograph of that region of the Earth’s surface. There are other ways of representing the data that make analysis by computer possible. Recall that for each pixel there are measurements of reflected sunlight corresponding to each of the bands recorded. If the satellite’s sensor records in four wavebands then there will be four measurements for each pixel, whereas if it measured in 6 wavebands there would be six.
The importance of those measurements for each pixel in an image is that they represent samples of the so-called reflectance characteristics of the features of the Earth’s surface being imaged. This can be illustrated with a simple example. Imagine a particular satellite sensor measures in just two wavebands. It produces two planes of image data so that each pixel has two measurements of reflected sunlight associated with it. Also imagine that the region being imaged consisted of just green vegetation, soil and water. Fig. 4 shows stylised versions of the characteristic curves for each of those three cover types, showing how they reflect incident sunlight at different wavelengths. Superimposed on those curves are the wavebands within which the hypothetical two-band sensor records data. One image plane corresponds to the red range of wavelengths and the other the infra-red range.
For a pixel recorded over water the red measurement will be small, while the measurement in the infra-red range will be zero, represented as black on the recorded image. For a vegetated region the recorded pixels will be dark in the red image but quite bright in the infra-red image. For soil pixels both the red and infra-red image data will be lightly coloured. Using this behaviour as a guide we can see that if we plotted a diagram in which the brightness in the red band were plotted horizontally and the infra-red brightness plotted vertically, and this were done for every pixel recorded, then we would have an new representation of the recorded image data, as shown in Fig. 5.
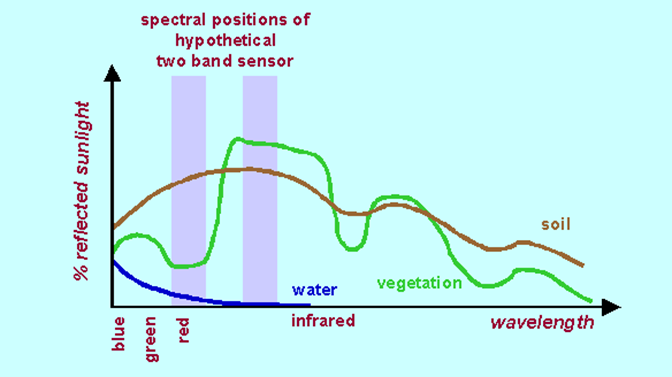
Fig. 4 Notional spectral reflectance curves of the three common Earth surface cover types of soil, vegetation and water. These depict the percentage of reflected sunlight over a wavelength range from the visible through to the infra-red.
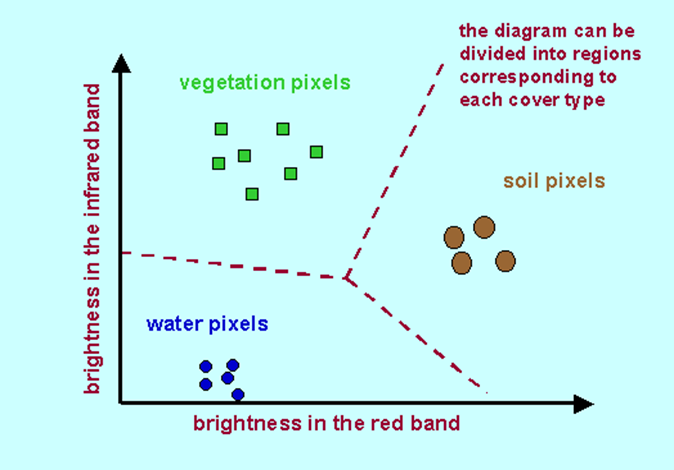
Fig. 5 ‘Spectral representation of satellite image data, showing how the individual pixels of a particular cover type have the same properties. A computer can be trained to recognise regions in the diagram corresponding to each material so that labels can be given to every pixel in an image to produce a cover type, or thematic, map.
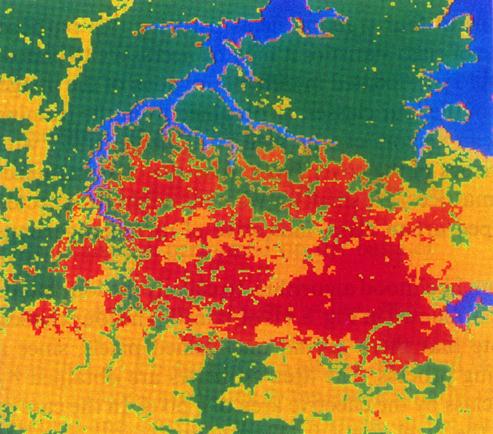
Fig. 6 Thematic map of labels where blue represents water, red is fire damaged vegetation, green is natural vegetation, and yellow is urban development.
Reproduced with permission from J.A. Richards and X. Jia, Remote Sensing Digital Image Analysis, 3rd ed., Springer, Berlin, 1999.
In this case of a two-band sensor we can actually plot the diagram and examine it. For a satellite sensor that records in say six wavebands, while we can still conceptualise the diagram, with as many axes as there are bands per pixel, we cannot plot it. That does not matter, because we will concentrate on the case of just two bands. However, properly programmed, a computer has no difficulty coping with a diagram with six dimensions, or even 200 dimensions for that matter!
Note how the pixels of a given cover-type group together. In fact the space in the diagram could be readily partitioned into regions which we can associate with water, soil and vegetation. The computer can do that readily and, in fact, can attach labels to the pixels of an image that tell us what they correspond to on the ground. From those labels we can actually produce a map of cover-types from the recorded image called a thematic map. Since it is composed of pixels of labels, and we know the sizes of the pixels in equivalent ground metres, we can count the pixels of a given cover type to give estimates of how many hectares of that particular cover have been recorded in the scene. Fig. 6 shows a computer-produced thematic map derived from Landsat imagery depicting vegetation damage in the vicinity of the Sydney suburb of Terrey Hills caused by extensive bush fires in 1979.
Using Other Wavelengths – Synthetic Aperture Radar
Can we record images at wavelengths much different from those in the visible and the infra-red ranges? Could we, for example, use radio waves instead? After all, Maxwell showed that radio waves and light are both forms of electromagnetic radiation. As it happens we can image the Earth’s surface at radio wavelengths, with enormous advantages.
There is however very little natural radio energy in reflected sunlight or emanating directly from the Earth itself. Therefore to produce an image at these wavelengths the spacecraft must carry its own energy source. It then beams this to the Earth and measures the reflected signal to form an image. This is the technique of radar, much as radar is used for detecting aircraft in the vicinity of airports or for mapping severe weather patterns.
The instruments used for mapping the Earth’s surface at radio wavelengths are called Synthetic Aperture Radars (SARs); formation of an image from the received signal is a non-trivial task involving quite complex computer algorithms.
SARs operate at wavelengths tens of thousands of times larger than those used by Landsat and similar optical remote sensing satellites. In fact, they operate in what is called the microwave range of wavelengths not too different from those employed in microwave ovens and mobile telephones.
Because their operating wavelengths are so different from those of optical satellites, SARs detect different properties of the Earth’s surface. The imagery recorded is dominated by the geometrical structure of the surface, both on small and large scales, and by the moisture content of the ground and its vegetation cover. SAR data are often seen as an adjunct to that recorded by optical remote sensing satellites so that fusion of the two data types can reveal information on Earth surface processes otherwise not available. An important benefit of SAR is that it is unaffected by cloud cover and can operate at any time of day or night.
The first available civilian radar satellite was Seasat, launched by NASA in 1978. No further satellites of this type were orbited until the launch of ERS-1 by the European Space Agency in 1991. Since then Japan and Canada have developed radar satellite programs.
The first available radar satellite was Seasat, launched by NASA in 1978. There were no further free flying radar satellites orbited until the launch of ERS-1 by the European Space agency in 1991. Since then Japan and Canada have developed radar satellite programs.
Fig. 7 of Lake Frome and the Flinders Ranges acquired by (a) Landsat on 30 September 1991 and by (b) ERS SAR two days earlier, shows how the two data sets complement each other because of the different views of the landscape provided.
Radar instruments have also formed payloads for the Space Shuttle. On the second flight of Space Shuttle Columbia in 1981 a SAR was carried for Earth feature mapping as was the case for Shuttle missions in 1984, 1994 and 2000. Because of the limited days in orbit, Shuttle radar missions have generally been more experimental than those involving satellites.
By operating at different wavelengths SARs can be matched to different applications. Some have been designed for monitoring the land, while others are optimised for sea and ice observations. In almost all cases the spatial resolution is comparable to that for optical imaging programs.
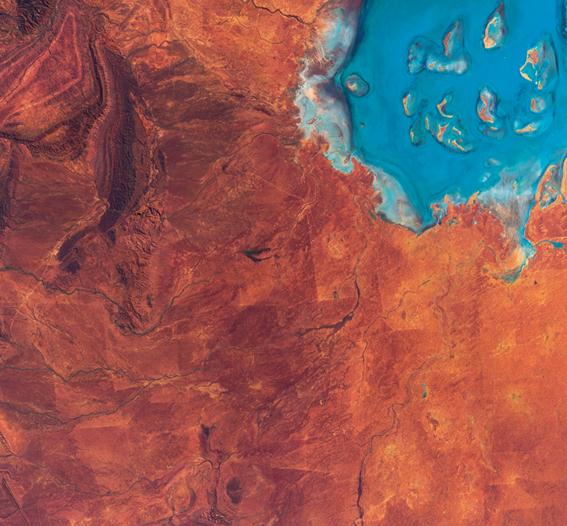
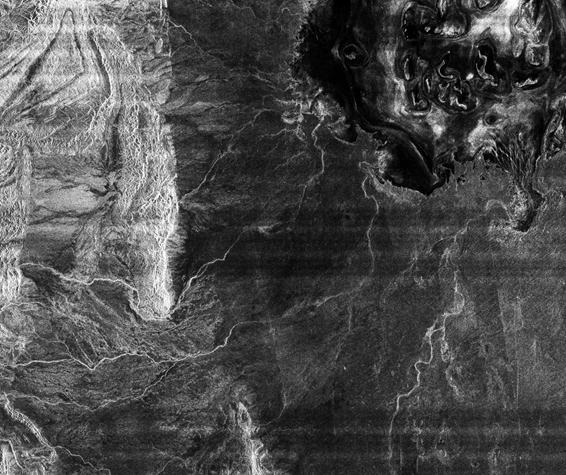
Fig. 7 Lake Frome and the Flinders Ranges acquired by (a) Landsat on 30 September 1991 and by (b) ERS SAR on 28 September 1991; the different information revealed in each is evident.
Images acquired by ACRES. © Commonwealth of Australia.
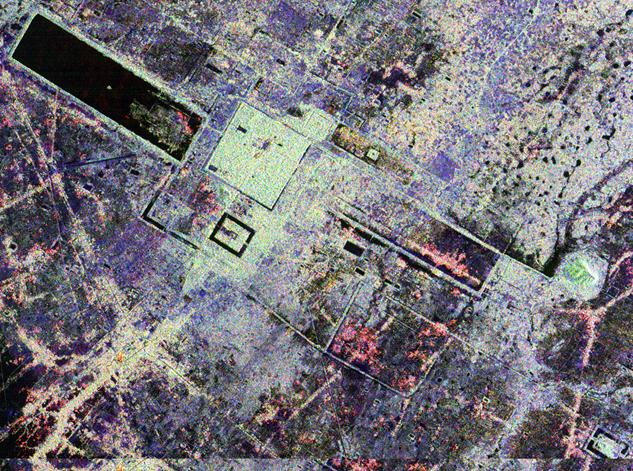
Fig. 8 Synthetic Aperture Radar image of the city of Angkor in Cambodia. The radar’s ability to penetrate cloud and vegetation reveals structures thought to be previously undiscovered.
Courtesy NASA (PIA00505).
At certain wavelengths radar energy can penetrate vegetation cover and, if the land surface is particularly dry, it is even possible to detect features under the ground. Some astonishing images of this type have been recorded over the hyper-arid regions of the Earth, such as in the Sahara desert in which underlying and ancient drainage systems have been revealed. Fig. 8 shows a radar image recorded over Angkor Wat in Cambodia, where the ability to image through the overlying rainforest shows archaeological detail otherwise not evident.
Hyperspectral Remote Sensing – Science from Space
Although valuable, the imagery obtained by optical remote sensing satellites has limitations for the identification of some Earth features, particularly those associated with mineral deposits Even though several bands of data available, they represent, for each pixel, just a small number of samples on the reflectance curves of Fig. 4. Successful application of the data requires very skilled human interpreters or depends on algorithms that examine trends in the data.
Over the past decade there has been a substantial increase in the number of bands of image data recorded and thus in the number of samples per pixel taken over the full reflectance curves of the Earth-surface cover types being imaged. Whereas most satellites have carried sensors that acquire between three and seven bands of data, we now have sensors that record several hundred samples and thus several hundred bands of image data simultaneously. They are known as hyperspectral sensors, whereas those on Landsat and SPOT, for example, are called multispectral.
Aircraft hyperspectral sensors have been available since the mid-1980s, including an Australian instrument known as HYMAP, built by Integrated Spectronics Pty Ltd. Spaceborne hyperspectral sensors to date include NASA’s Hyperion carried on the platform known as EO-1 and MODIS – for MODerate Resolution Imaging Spectrometer – carried as part of the instrumentation on the EOS-Terra platform. The spatial resolution of MODIS is quite low compared with that of multispectral sensors, being a little lower than 1 x 1 kilometre, more akin to the resolution of weather satellites.
The special benefit of hyperspectral imaging is that by recording hundreds of samples over the spectral range (rather than about six), scientific determination of the cover-types observed in each pixel is possible. It is easy to imagine that 200 samples over the reflectance curves of Fig. 4 allows most of the subtle features to be detected, whereas with only six samples, fine detail will be unobservable. With knowledge from laboratory measurements, or scientific analysis, of how different materials reflect light as a function of wavelength, then it should be possible to make quite precise inferences about the cover-types being imaged. The interpretation process then becomes one based on scientific understanding rather than on data analysis.
Another means by which each pixel in a hyperspectral image can be identified depends on having available large libraries of spectra covering a range of materials. Pixels are then identified by reference to the libraries.
Satellite Imagery as Management Information
Until 2005 remote sensing data for Australia was supplied by the Australian Centre for Remote Sensing (ACRES), which operated a Data Acquisition Facility (a ground receiving station) near Alice Springs, and a Data Processing Facility in Canberra. It provided data from US, French, Russian and Indian optical remote sensing satellites, as well as synthetic aperture radar imagery from Canadian and European programs. ACRES was formed in 1986 as an outgrowth of the previous Australian Landsat Station (ALS) established by the Federal Government in 1977. ACRES functions are now undertaken by the National Earth Observation staff of Geoscience Australia.
Weather imagery is available from the Bureau of Meteorology, often on-line and sometimes in real time.
It has long been recognised that satellite images could form one important component of a whole suite of data types useful in managing the Earth’s resources. When employed with land ownership and planning data along with, for example, soil and geological maps, much more information is available to assist in making management decisions about land planning, ecosystem monitoring, land use and resource exploitation. Together, a set of data of these types is commonly referred to as a Geographical Information System (GIS). The GIS is now an important tool used by many agencies, both public and private, to assist in decision making. In Fig. 9 the geographic boundaries of the Uluru National Park have been integrated with the Landsat data ready for inclusion in a GIS of the park.
With the improving capability of the Internet it is now technically feasible for users to have access to the variety of data types found in a GIS without themselves having to construct the full data base. Fig. 10 shows how a distributed GIS is possible using the Internet. Not only does such an approach relieve the user from having to collect complete sets but, more importantly, the data agencies responsible for acquiring the fundamental data maintain its integrity and timeliness.
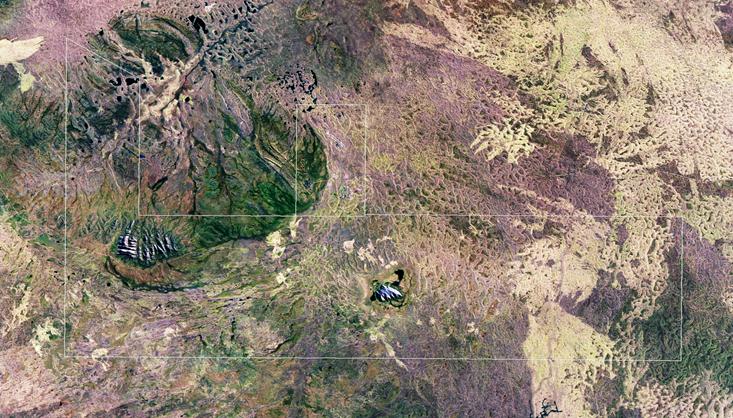
Fig. 9 Geographic boundaries of the Uluru National Park have been integrated with the Landsat data set ready for inclusion in a GIS of the park; the ‘whitish’ areas are fire scars.
Image acquired by ACRES: ã Commonwealth of Australia
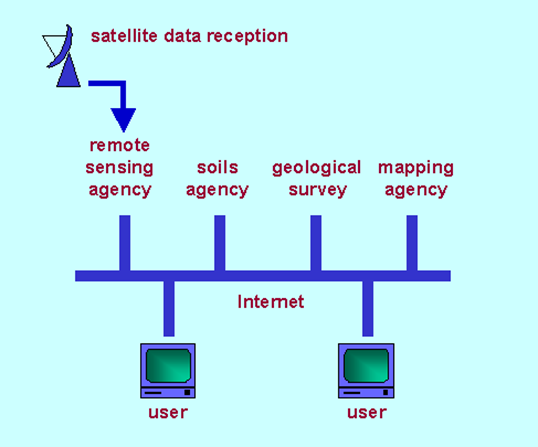
Fig. 10 Use of the Internet to distribute spatial data types, including satellite imagery, in a GIS.
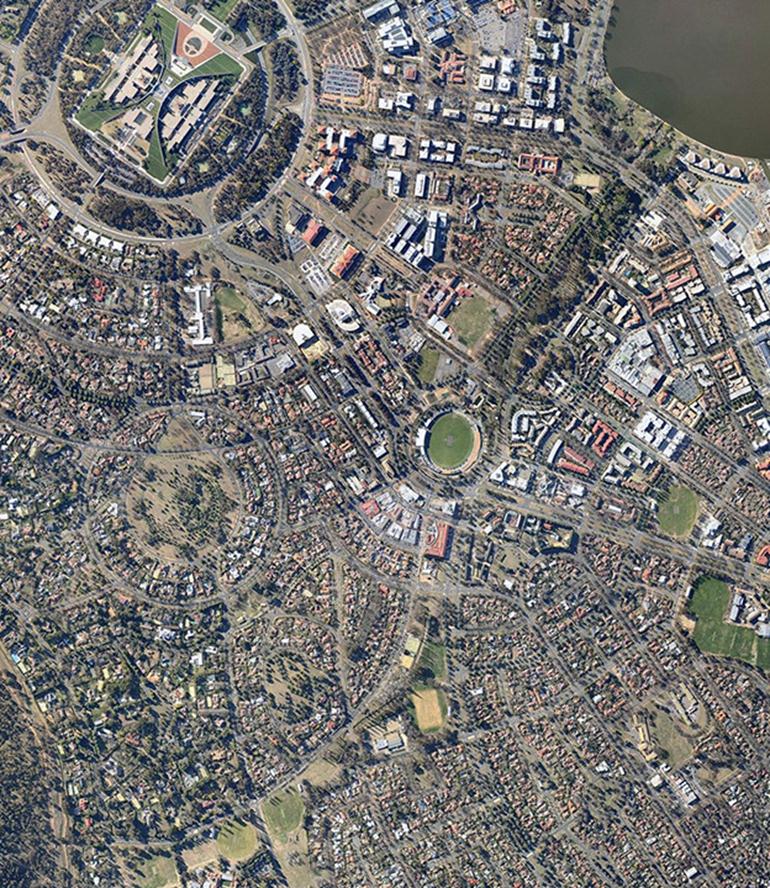
Fig. 11 High spatial resolution image of Canberra, recorded by the Ikonos satellite, in which detail as small as 1 m is visible.
ã Space Imaging
Near Photographic Quality
One of the most recent developments in imaging from space has been the availability of very high spatial resolution images delivered by platforms hitherto typical of those used for intelligence gathering. We now have commercially available panchromatic imagery showing detail as small as 1 metre and imagery in several spectral wavebands with 3 metres spatial resolution. Fig. 11 shows such an image, recorded by IKONOS, the first commercial remote sensing satellite launched in 1999. Having such high spatial resolution available opens prospects for a range of new applications including cartography, tourism, disaster management and electronic news gathering.
Some Closing Remarks
From the experimental Earth observing programs of the 1970s we have now reached a stage in which views of the surface of our planet from space are used routinely in mineral exploration, agriculture, land use planning, sea surface temperature measurements, fisheries and water quality assessment, to name a few. The data gathered are regularly integrated with other forms of geospatial information in decision support systems. We have learned to compensate the data for degradations introduced by the Earth’s atmosphere, and the motions of the Earth and the platform itself, and we have devised sophisticated image analysis techniques to assist in capturing as much information as possible from the data. Several nations are sources of data supply and the field has reached quasi-commercial status.
But there is promise of further significant advances in the foreseeable future, particularly when we combine the benefits of satellite-derived data with other space services. Precision farming is an example. By using satellite data on land condition, and by ensuring that the satellite imagery is correctly referenced to ground coordinates, the GPS navigational satellite system can be used to target precisely where fertilisers or weedicides, for example, need to be applied. It has been estimated that even the few percentage points greater yield achieved by these precision methods would more than justify their development as an operational tool.
Rarely in science and technology do systems function in isolation. The same is true for space technology. Navigation satellites can be a valuable adjunct to remote sensing platforms for sophisticated applications such as precision farming, but they have a wider role in assisting the registration of satellite imagery to ground-based coordinate systems to render the image data operationally useable, and also as a means for space probes to know their own locations. Communications satellites also work with Earth observing missions, not only to down-link the recorded data to ground receiving stations, but also to assist in the distribution of data from supplier to user. There are some novel synergies. The GMS geo-stationary weather satellite, owned by the Japan Meteorological Agency and from which Australia routinely receives weather imagery via its location over New Guinea, functions as both an Earth observing and a communications satellite. Imagery it records is down-linked to Japan where it is processed and then up-linked back to the satellite for broadcast distribution to the user community.
Looking back to Earth from space is both exciting and practical. It is an expensive exercise and yet, because of the global user community, is cost effective. It implies maturity but, in reality, is probably still in its infancy. It will have reached a level of true operational status when the user is able to purchase maps of the patterns of land use in a given shire, or predictions of profitable fishing grounds, without being aware that the primary data was obtained via a space platform about 1000 kilometres overhead. Less romantic perhaps, but a fitting outcome of decades of commitment, funding and dreaming by those dedicated to a vision of space technology in the service of humankind.
Further Reading
For a technical treatment of remote sensing, and means by which satellite imagery is analysed, the following are recommended:
P.J. Curran, Principles of Remote Sensing, Longman, Essex, 1985.
R.A.Schowengerdt, Remote Sensing: Models and Methods for Image Processing, 2nd ed., Academic, San Diego, 1997.
J.A. Richards and X. Jia, Remote Sensing Digital Image Analysis, 3rd ed, Springer, Berlin, 1999.
Information on satellite programs and data availability are given in the following Websites. NASA’s Jet Propulsion Laboratory in Pasadena California, which has been involved in many radar and shuttle remote sensing missions. NASA’s Goddard Space Flight Center in Maryland, from which data on optical missions will be available, and on which information on NASA’s Earth systems science initiative will be found. Geoscience Australia is the Australian Federal Government agency responsible for remote sensing data acquisition and distribution.