The Division of National Mapping’s Adoption of Digital Mapping Techniques
Introduction
Digital Mapping evolved from processes like Computer Aided Drawing, Computer Assisted Cartography, Automated Plotting, Automated Cartography and Automated Photogrammetry. While those technologies essentially focussed on only a part of the mapping process, digital mapping had the objective of capture once and use many (Scott, 2011).
This article describes the path National Mapping took in moving from the traditional manual map generation process to one that fulfilled the above objective.
The Beginnings
Simple, automated XY plotting was perhaps the earliest use of technology to quickly and accurately plot basic grids and graticules defining a map’s extents. Such plotters were usually large, table like structures on which the material to be inscribed was fixed. The plotting pen then moved in the XY direction to perform its tasks, predetermined by simple punched tape or card commands. As computer technology, storage and programming evolved so did the sophistication of such plotters. To save space, plotters became available where the material to be inscribed was fixed to a revolving drum providing the X movement while the plotting pen moved back and forth providing the Y movement. Such drum plotters however, tended to be used where speed rather than ultimate accuracy was the requirement.
The 1960s bought together advanced optical, electronic and automated technology in the form of the Wild, model IV, B8 Stereomat. The Stereomat was designed to automate much of the manual stereoplotting operation and generate orthophotographs. It was foreseen that a rapid mapping solution might lie in the form of orthophotomaps. An orthophotograph is an aerial photograph that has all the terrain, earth and camera related distortions removed and therefore all the features in the photograph are now truly positioned at scale. Put together as a mosaic these corrected photographs form an orthophotomap. The orthophotomap would have the accuracy of the traditional topographic map but would be faster to produce. Height data was continuously collected during the scanning of the photogrammetric model and recorded on magnetic tape. These data tapes were later computer processed to generate contours which were output on an automatic data plotting table. The development of automated photogrammetry is described in this paper, Automation in Photogrammetry, by Gottfried Konecny. Konecny delivered his paper to a gathering of senior state and federal mapping personnel in Australia in 1967. The subsequent experience of Natmap with its three Stereomats and two Topocarts in producing orthophotomaps, can be found via this link.
To assist in Natmap’s production of small scale thematic and census mapping a PDP 11/40 computer along with two, point mode digitisers and visual display units were delivered in June 1974. Peripheral equipment included a 9 track magnetic tape unit, a plotter with 30 inch wide printing capability, a line printer and photoscanning unit. This system was installed at Natmap’s Canberra office. Prior to this an eighteen month program had investigated the viability of using a string digitiser as an interactive device for recording and editing existing data and a photoscanning head which fitted the pen carriage of a conventional XY drum plotter. National Mapping and the then Department of Engineering Physics in the Research School of Physical Sciences of the Australian National University (ANU), undertook the work as a cooperative project and details were published in 1973 by Ian MacLeod, John Fryer and D Smith in National Mapping’s Technical Report 16, [report_tdnm/auto carto 16.pdf] A Rational Approach to Automated Cartography. The first use of this technology appeared to be the digitising over 28,000 census collection districts as well as index maps, and census division and sub-division boundaries. Nat Map also used digital mapping techniques for post census publications such as the Atlas of Population and Housing.
In the early 1970s, the Royal Australian Survey Corps (RA Survey) decided to move into the digital era and by 1976 accepted its Automap I system that was supplied by Systemhouse (Canada) (Royal Australian Survey Corps, 1978). RA Survey's Automap II followed in 1984 (Coulthard-Clark, 2000). To initially assist the interchange of digital data between the Army and Nat Map an interchange standard was developed. This standard evolved to become AS2482 - the Australian Standard for Interchange of Feature Coded Digital Mapping Data. The evolution of AS2482 is described at Annexure A.
National Mapping's path to digital mapping was initially made more convoluted by the ongoing resource constraints and risk averse bureaucratic practices of the time. Nevertheless, in 1977 the Commonwealth Public Service Board supported a proposal to gradually introduce computer assisted topographic mapping techniques to replace the conventional methods. Over the next few years, the necessary equipment and expertise was accumulated, which importantly included software based on RA Survey's Automap system and also supplied by Systemhouse. By both agencies having Automap software, future digital data exchanges were to be greatly facilitated.
The stereoplotting phase of the map compilation process was largely done by Natmap’s panel of contractors. It was realized that it was not practical to demand that this panel now produce a digital output. Such a demand would increase cost and also delay the stereoplotting in turn delaying map production. However, as contractors provided the option of a digital output this was accepted within the terms of the contracted work package. There was unanimous agreement within National Mapping, that existing stereoplotting be retained until such time that the scanning technology then being developed could convert this material to digits. Natmap however, would also develop a base of digital capture skills so as to understand the limits, difficulties and accuracies available for specification development.
For stereoplotters to generate a digital output they needed to be fitted with encoders. The encoders translated the operator’s movements in plotting detail into XYZ coordinates which could then be digitally stored. It was known that Natmap’s two Topocarts already had suitable encoders and thus these machines were the first to be used to collect digital data. Over time Natmap’s Wild B8’s and Kern PG2’s had encoders retrofitted and were linked into the digital capture system. The adaptation to digital capture did not negate the need for a visual record for the operator to verify work done. Thus, the traditional analogue plot from the stereoplotter was retained.
Following Natmap Melbourne’s move from city to suburban office space in early 1977 a PDP 11/40 computer became the central item to digital capture via stereoplotting. With peripherals consisting of two 2.4 Megabyte disks, a line printer, two terminals, a magnetic tape drive, a graphics screen and two 80 Megabyte disk drives, the digital output of two stereoplotters could be stored, verified and edited. The Automap software was finally adapted in the early 1980s to run on the PDP computer so that the final system was compatible to that of the Army Survey Regiment in Bendigo.
Operators soon learnt that digital capture required rigorous attention to detail over and above that needed for traditional stereoplotting. Before plotting a feature, that feature had to be given a feature code that identified the coordinates or string of coordinates about to be captured. This information was entered via a standard computer visual display unit (VDU). Once that feature was captured, the analogue plot was checked to verify what had just been plotted. The new capture terminology was :
|
Feature |
A single entity on a map, such as a road, building or contour |
|
Feature code |
A four digit number indicating what a feature represented |
|
Feature Modifier |
A four digit number which contained additional information about a feature |
|
Sequence Number |
A unique number assigned to each feature, used in the identification of features |
Then to the capture of the next feature. Any disruption to these steps likely resulted in meaningless data. As necessary, the graphics screen could be used to confirm that the captured data was as expected. Despite the greatest care the digital data generated was not clean; one feature might overlap another or a fenceline might not join a road. The graphics screen was used to clean up any such inconsistencies, correct errors and to join the stereomodels together to complete the map coverage. In the early days this process was very time and computer resource consuming.
Following the arrival of further equipment in mid 1979, the Dandenong offices’ digital system was expanded to consist of four stereoplotters, two backlit digitising tables and an interactive graphics screen plus a high speed verification plotter. As well as capturing data from existing material the two digitising tables could be used for editing any captured data. When the map data was believed to be acceptable the fast verification plotter was used to check the data set. These plots were usually produced with ball point pens on drafting film or paper. The standard form had four colours and basic symbolisation, but alternatives included colour coded contour lines for verification of contour tagging, and special symbols for use in field checking.
There was never any plan to transfer data from Dandenong to Canberra other than by magnetic tape. At that time, the data volume was too large and infrastructure costs just too excessive. Given that the Dandenong office by then had its own aircraft and pilots, if a real emergency had arisen it was often said that a data tape could be flown to Canberra more quickly and cheaply.
While the digital map compilation processes were being developed, the map production side had been duly considered. The result was the 1982 acquisition of a computer controlled, precision, flatbed, Norwegian Kongsberg Group, Kongsberg GT5000 plotter. Topographic repromat was produced on the Kongsberg plotter, using the light head to expose photographic film and a cutting tool to cut mask edges on peel coat material (repromat or map reproduction material can be considered as the components necessary for the map printing process). Custom made symbol disks were used to flash standard symbols and text onto the film. Separate plots were produced for each map printing colour. This plotter also allowed small scale mapping products to be generated in the Canberra office. Such was the versatility of this equipment that in this era both the Army and Navy mapping establishments also had a GT5000 plotter.
The naming of features on a map was a very important aspect of the mapping process (Kennard et al, 1977). Selecting the features to be named along with ensuring their correct spelling and attributes (type font, point size and case) was a very time consuming and error prone process. As computer assisted cartography evolved at National Mapping, a system to automate the extraction and typesetting of feature names for mapping purposes was developed.
A gazetteer of Australian map feature names was originally compiled from the 1: 250,000 scale R502 map series. It was later updated, expanded and sorted into alphabetical order within 1: 100,000 map sheet areas. To enable automatic feature selection based on order of importance to be made, a hierarchical system was established for groups of features, such as populated places, drainage networks, relief features etc. By setting up rules as to what hierarchical levels were required for a particular scale of map only the feature names applicable would be selected. For a small scale map, for example, only the highest (ie most important) hierarchical levels of city, river etc names would be selected by the software. The file of selected feature names and attributes could be further processed by an automatic type setting machine. Such a machine read the file and generated the feature names in the associated type font, point size and case on negative film. This film was then contact printed to positive, reverse reading, stripping film. As required, the feature names could be extracted from the stripping film and stuck down, or printed/plotted on, a clear plastic overlay in relative proximity to their associated feature with the knowledge that spelling and attributes were correct.
Review of Natmap’s Operations 1984
While the 1984 review was of the Division as a whole, the use of computer technology, its support and digital mapping, were aspects that received significant scrutiny. Undertaken during 1983 this review provided the status of digital mapping in the Division and the possible way forward. It was seen that : In some instances, one of the less desirable effects imposed by mapping programs of the Division is that benefit can sometimes be restricted by purpose. Until recently, this has been due in particular to the type of technology employed in the map making process. Although there have been many advances in surveying and photogrammetric equipment over the years, this same technology had locked the whole process of map making into a sequential series of operations. The printed map has thus loomed large as the end product of these operations, while the technology employed has limited the consideration of by-products. With the introduction of digitising technology into the mapping process, however, there is a greatly increased capacity to gather and manipulate spatially related data. In addition to the primary purpose of producing a printed map, data obtained through computer mapping may have many other applications. These applications would include the production of map alternatives and cartographic by-products, where the use of graphical information would be less efficient or impractical.
To a large extent the above focus was engendered by the view that digital mapping was just another tool. This narrow view thus provided no indication that the digital data being captured could have no other role than ending up on a piece of paper. While Natmap’s digital data volume was still relatively small and the mechanisms not yet completely entrenched it was time for digital mapping to enter a new phase.
Move from Spaghetti to Topologically Structured Data
The simple structure of the spaghetti data model allowed for efficient reproduction of maps and graphics. In the spaghetti model, each point, line, and/or polygon feature was represented as a string of X, Y coordinate pairs (or as a single X, Y coordinate pair in the case of a vector image with a single point) with no inherent structure. One could envision each line in this model to be a single strand of spaghetti that was formed into complex shapes by the addition of more and more strands of spaghetti. It was notable that in this model, any polygons that lay adjacent to each other had to be made up of their own lines, or strands of spaghetti. In other words, each polygon had to be uniquely defined by its own set of XY coordinate pairs, even if the adjacent polygons shared the exact same boundary information. This created some redundancies within the data model and therefore reduced efficiency.
In addition, despite the location designations associated with each line, or strand of spaghetti, spatial relationships were not explicitly encoded within the spaghetti model; rather, they were implied by their location. This resulted in a lack of topological information, which was problematic if the user attempted to make measurements or analysis. The computational requirements, therefore, were very steep if any advanced analytical techniques were employed on such data files.
Thus, to enable the captured digital data to be manipulated and not just reproduced as a paper map then the relationships between neighbouring points, lines, and polygons needed to be added to the data set. In the spaghetti model, the shared boundary of two neighbouring polygons was defined as two separate, identical lines. The inclusion of topology into the data model allowed for a single line to represent this shared boundary with an explicit reference to denote which side of the line belonged with which polygon. Topology was also concerned with preserving spatial properties when the forms were bent, stretched, or placed under similar geometric transformations, which allowed for more efficient projection and reprojection of map files.
The then failings of the digital mapping data were seen to be that :
|
attributes of area features (polygons) were not uniquely defined; |
|
|
- |
intersections between points, lines and areas were not explicitly recorded; |
|
- |
network connectivity was not explicitly maintained; and |
|
- |
adjacency was not explicitly recorded. |
|
|
|
|
There was also concern that :
|
|
|
- |
priorities for plotting coincident features were not recorded; |
|
- |
multiple feature coding for a point, line or area boundary was not possible; and |
|
- |
generalisation information was not stored for many features. |
Modifications to the data capture and recording procedures would then allow Natmap to not only start building a digital data base which would provide data for input to any future Geographic Information System (GIS), but also build a standardised data base incorporating digital topographic and thematic data. This would negate a possible proliferation of incompatible specialist data bases.
Natmap’s Digital Mapping Programs and Resourcing, early 1980s
At this time, Natmap digital mapping programs were:
|
- |
Topographic compilation at 1: 50,000 and 1: 100,000 scales |
|
- |
Derivation of 1: 250,000 scale compilations |
|
- |
Production of 1: 100,000 and 1: 250,000 scale repromat |
|
- |
Maintenance and processing of the Master Names File |
|
- |
Digitising and processing the Australian coastline and baseline |
|
- |
Digitising of 1: 1,000,000 scale topographic and thematic maps |
|
- |
Production of 1: 1,000,000 scale repromat |
|
- |
Digital Elevation Model (DEM) data acquisition |
|
- |
Census Boundary digitising and editing |
|
- |
Production of the Atlas of Population and Housing |
|
- |
Production of precision grids, graticules and base sheets |
|
- |
Supply of data files to clients |
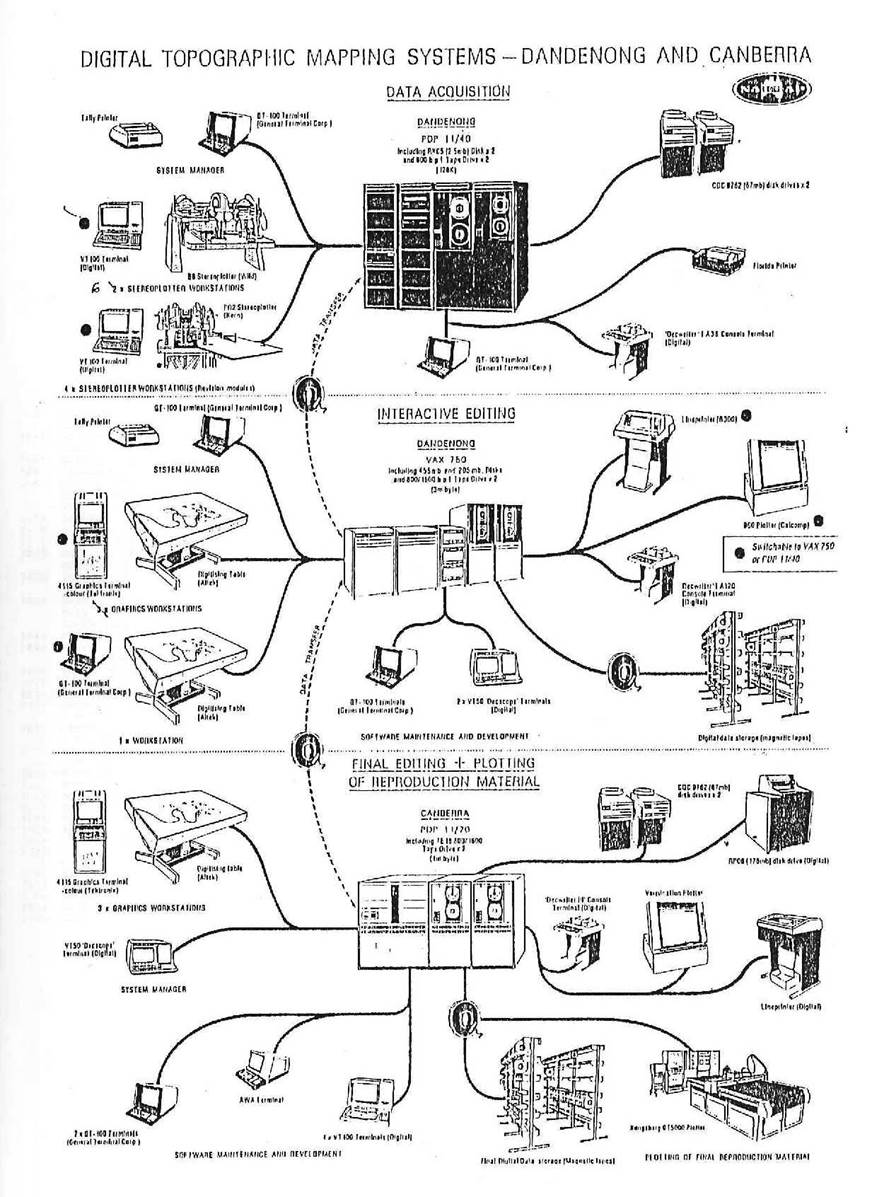
Topographic compilation, from both contract and in house captured data, at 1: 50,000 and 1: 100,000 scales and derivation to 1: 250,000 scale were performed in the Dandenong office. All the other aspects of the digital mapping, including the production of repromat from digital topographic compilations, was performed at the Belconnen office.
The hardware and software at both offices was :
|
Dandenong office hardware : |
||
|
- |
1 x DEC PDP 11/40 computer (256kb memory) |
|
|
- |
2 x DEC RK05 disk drives (2.5Mb each) |
|
|
- |
2 x CDC 9762 disk drives (67 Mb each) |
|
|
- |
2 x DEC TU10 800 bpi 9 track tape drives |
|
|
- |
1 x DEC LA36 Decwriter console |
|
|
- |
1 x Florida line printer |
|
|
- |
1 x DEC VAX 750 computer (3Mb memory) |
|
|
- |
1 x DEC RA81 disk drive (456Mb) |
|
|
- |
1 x DEC RA60 disk drive (205Mb) |
|
|
- |
2 x DEC TU77 800/1600 bpi 9 track tape drives |
|
|
- |
1 x DEC LA120 Decwriter console |
|
|
- |
1 x B300 line printer |
|
|
- |
4 x Tektronix 4115B graphics terminals |
|
|
- |
1 x Tektronix 4014 graphics terminal |
|
|
- |
1 x Tektronix 4010 graphics terminal |
|
|
- |
10 x DEC VT100 compatible alphanumeric terminals |
|
|
- |
2 x Wild B8 stereodigitisers (with triaxis encoders, GT100 terminals and Aust-Am Macromap controllers) |
|
|
- |
4 x Kern PG2 stereodigitisers (with triaxis encoders, GT100 terminals and Aust-Am Macromap controllers) |
|
|
- |
4 x Altek ACT 34/2 digitising tables (with Systemhouse Ltd. controllers and GT100 terminals) |
|
|
- |
1 x Calcomp 960 drum plotter (a 4 pen / continuous paper drum plotter is proposed for 85/86, with 960 moved to Belconnen) |
|
|
- |
2 x Tally printers |
|
|
- |
1 x Silver Reed daisy wheel printer |
|
|
|
|
|
|
Dandenong office software : |
||
|
- |
RSX 11M Version 4.0 (PDP 11/40) |
|
|
- |
Fortran 4 (PDP 11/40) |
|
|
- |
VMS Version 4.0 (VAX 750) |
|
|
- |
Fortran 77 (VAX 750) |
|
|
- |
Automap |
|
|
- |
Cardit and Colour Cardit |
|
|
- |
Succer |
|
|
- |
AS2482 Read/Write |
|
|
- |
Other non mapping software |
|
|
|
|
|
|
Belconnen office hardware : |
||
|
- |
1 x DEC PDP 11/70 computer (1Mb memory) |
|
|
- |
2 x DEC RPO6 disk drives (176Mb each) |
|
|
- |
2 x CDC 9762 disk drives (67Mb each) |
|
|
- |
2 x DEC TE16 800/1600 bpi 9 track tape drives |
|
|
- |
1 x DEC LA120 Decwriter console |
|
|
- |
1 x Tektronix 4115B graphics terminal (+2 proposed 85/86) |
|
|
- |
1 x Tektronix 4010 graphics terminal |
|
|
- |
15 x DEC VT100 compatible alphanumeric terminals |
|
|
- |
2 x Altek ACT 34/2 digitising tables (with Systemhouse Ltd. model 100 controllers and GT100 alphanumeric terminals) |
|
|
- |
3 x Summagraphics Series 2000 digitising tables (with NFPA Type II controllers and Teleray alphanumeric terminals) |
|
|
- |
1 x Kongsberg GT5000 flat bed plotter (offline), with 800bpi tape drive, controller and photo exposure device with two symbol disks |
|
|
- |
2 x Calcomp 563 drum plotters (+1 Calcomp 960, proposed to be transferred from Dandenong in 85/86) |
|
|
- |
1 x DEC LP05 lineprinter |
|
|
|
|
|
|
Belconnen office software : |
||
|
- |
RSX 11M+ Version 2.1 |
|
|
- |
Fortran 77 |
|
|
- |
Automap |
|
|
- |
Cardit and Colour Cardit |
|
|
- |
Succer |
|
|
- |
AS2482 Read/Write |
|
|
- |
Census |
|
|
- |
Grid/Grat Plot |
|
|
- |
DEM |
|
|
- |
Master Names file |
|
|
- |
Other non mapping software |
|
|
|
|
|
|
Notes re software |
||
|
Automap |
A map production Fortran package written by Systemhouse Ltd.
Data acquisition was by blind digitising at table or stereodigitisers, in either point or stream (continuous recording) mode, with a range of editing commands also available to station operators. Output was Calcomp verification plots or fully symbolised repromat from the Kongsberg. Other features included a facility for combining or dividing existing data files and a development system based on the Fortran V precompiler. Natmap staff had made numerous modifications to Automap, particularly at the user interface.
The Automap software communicated with controllers at the table and stereodigitising stations. The processors performed low level validations and transformations, removing these tasks from the host computers.
Automap data was stored on disk in files corresponding to map areas, with basic information for each file stored in a directory. Each digitised feature in a file had a Feature Index Record, containing a feature code and modifier, start and end point coordinates, minimum and maximum coordinates and some address pointers. A Feature Definition Table contained attribute details for each feature code, describing how the feature was to be processed on input and plotting.
1: 1,000,000 scale topographic data was acquired by in house Automap table digitising and by contract scan digitising. The contract scan data was supplied in a vector format which was converted to Automap.
Natmap used approximately 200 feature codes to describe topographic data.
|
|
|
Cardit |
A Fortran interactive graphics editing program, originally written in the South Australian Lands Department. Cardit was modified at Natmap to operate on the Automap data structure and complement the Automap editing facilities, and ran on the Tektronix 4010 and 4014 terminals.
|
|
|
Colour Cardit |
An interim modification for the Tektronix 4115.
|
|
|
Succer |
Super Colour Cartographic Editor was a Natmap program designed to utilise the full capabilities of the Tektronix 4115, for editing of Automap data.
|
|
|
AS2482 Read/Write |
A program based on Australian Standard 2482, Interchange of Feature Coded Digital Mapping Data. The program converted contractor supplied AS2482 data into Automap, and converted Automap data into AS2482 for supply to clients or exchange with other mapping agencies.
|
|
|
Census |
A Natmap system to digitise and edit census boundary data, form polygons in a topological structure, and produce various plots. The census data structure and software also supported aggregation of the basic Collection District polygons into other regions such as statistical divisions, local government areas, postcode areas and electorates.
Census boundary data was acquired both in house and by contractors. Nine polygon themes (Collection Districts, Local Government Areas, Postcodes etc.) were formed from the segments.
|
|
|
DEM |
An add on to Automap for digitising and editing spot heights on the Summagraphics tables.
|
|
|
Grid/Grat |
A Natmap system for producing grids and graticules to a variety of specifications, scales and projections on the Kongsberg.
|
|
|
Master Names File |
For maintaining a data base of place names, employed in the production of text overlays.
|
|
|
Non mapping software |
Non mapping software was also run at both sites, particularly in Dandenong where analytical photogrammetric block adjustments were computed.
|
|
|
|
|
|
|
Digital data sets |
||
|
Topographic |
The potential size of the 1: 100,000 and 1: 250,000 scale topographic data bases were 3100 and 540 map areas respectively. Considerable quantities of Automap format digital data were then held for 130 1: 100,000 areas (300Mb) and ten 1: 250,000 map areas (60Mb). Smaller data quantities, such as nomenclature only, were held for many other map areas. The topographic data tape archive then contained about 140 contractor (AS2482) tapes and 90 Automap tapes.
The 1: 1,000,000 scale digital topographic data base consisted of 44 map areas requiring 100Mb storage in Automap.
The then DEM data set consisted of irregularly distributed spot elevations in 75, 1: 100,000 map areas, requiring 8Mb storage in Automap.
|
|
|
Census |
The census data set contained about 28,000 Collection District (CD) polygons, and required 20Mb storage in the then data structure. The CD's were plotted on 7000 map sheets and updated for each five-yearly census.
|
|
|
Master Names File |
The Master Names File (MNF) contained 216,000 names in 25Mb. However, it was independent of the Automap and Census systems. |
|
A circa 1984 diagrammatic layout of the above listed hardware is shown in the diagram below taken from the then Assistant Director, Topography, Alan Thomson’s paper Digital Mapping in Natmap.
At this time, the system was heavily utilised such that some editing functions or multiple interactive editing sessions severely impacted system response time. So, despite the fact that the system did enable the production of very high quality graphics from digital data, data input along with derivation and generalisation procedures were inefficient. In looking to the future however, perhaps the greatest limitation of the then system was that the Automap data structure did not adequately support polygons or geographic analysis and so the data was not suitable for GIS applications. Natmap however, already had a store of map data in its printed maps. A method to convert this store of data for GIS use was thus needed.
Natmap’s Digital Mapping Upgrade 1986
Based on the above experience with the then digital mapping system and the data’s shortcomings, approval was sought for an extensive upgrade. Government approval was received in 1984 for an anticipated expenditure of $1,877,000 in the 1986/87 financial year for :
|
- |
an Automatic Digitising System (ADS), enabling fast, accurate and cost efficient scanning, vectorising and feature coding of topographic, bathymetric, thematic, census and future graphics;
|
|
- |
Map Production Software (MPS) designed for point, line and polygon data, and featuring improved batch and interactive editing, derivation, generalisation and text procedures;
|
|
- |
Geographic Information System (GIS) and Data Base Management Software (DBM) to support the creation of integrated databases and a range of analytical operations;
|
|
- |
new systems and workstations associated with the automatic digitiser and new software. |
Industry was first advised of Natmap’s planned upgrade through a brief, which was circulated in March 1985. The Request for Tender (RFT) was advertised in October 1985, with 11 companies responding by the closing date of 19 December 1985. The tender evaluation and recommendation process was completed in August 1986 resulting in the purchase of a Scitex scanning system and a GeoVision Geographic Information System (GIS).
Digital Topographic Products
For topographic data, the digital era could be said to have begun in 1988. By 1988 the Division of National Mapping had been subsumed into the Australian Surveying and Land Information Group (AUSLIG) but its 1: 100,000 scale National Topographic Map Series (NTMS) of 3,062 map sheets, commenced in 1965, was now complete.
The Hermannsburg (5450) 1: 100,000 scale map sheet, was the first sheet to be fully compiled by stereoplotting and table digitising by National Mapping. Significantly, it was the last map required to complete its NTMS program. These important aspects of the Hermannsburg sheet saw it being endorsed by the Federal Minister for Administrative Services, the Honourable Stewart West MP in October 1987. While digital mapping did not greatly impact the NTMS program, this technology and the NTMS program itself became the springboard for the next generation of mapping (O'Donnell, 2006).
In November 1994, national coverage of GEODATA TOPO 250K (Series 1) was completed. To deliver this product quickly a selective revision process was introduced which focused on only incorporating major changes such as new roads and railways. AUSLIG started working with non traditional partners such as the NRMA to source revision intelligence which pointed to where such changes had occurred. Landsat and SPOT satellite imagery were used extensively to capture the spatial geometry of changed features. GEODATA TOPO 250K (Series 1) was innovative in that the data was first created in GIS format and then that data was used to derive the printed map products. The derived paper maps were branded as NATMAPs. GEODATA TOPO 250K (Series 2) followed in September 2003. For the first time, all the 1: 250,000 scale maps were produced using a consistent mapping specification to provide high quality data for GIS and mapping via one process. A side effect of this approach was that the printed maps were consistent and could be easily joined together.
Finally, in 2005 with the release GEODATA TOPO 250K (Series 3) was there a seamless national digital topographic database that was consistent, rigorous, and built to a uniform specification. Data was held as continuous themes in a spatial database environment, no longer constrained by map sheet boundaries, and also web enabled. The 250K NTMS paper maps, now represented a direct hardcopy extract from the database.
Digital Topographic Data into the Future
The future of digital topographic data was addressed by the Intergovernmental Committee on Surveying and Mapping (ICSM) in November 2003. As had been recognised in the past with traditional map data, the ICSM saw that a long term, ongoing, coordinated approach was vital to topographic data collection, management and delivery. The Permanent Committee on Topographic Information (PCTI) was thus created. Perhaps the major difference from the past was that not only was the ICSM represented but also other key government and industry stakeholder groups.
In 2004 the Permanent Committee on Topographic Information developed a framework to facilitate a cooperative, cost effective and mutually beneficial approach to the collection of Australia’s topographic information collection. This initiative is referred to as Australia’s National Topographic Information Coordination Initiative (NTICI).
NTICI was established to be a national collaborative mechanism to offset the ongoing and increasing cost of topographic information data capture, revision and maintenance. Fundamentally, NTICI recognises the different but complimentary roles and responsibilities mapping agencies play within and across the Commonwealth, States and Territories, and has a clear focus on ensuring the data is managed by the data custodian. In essence, NTICI is the mechanism to effectively achieve the aim of capture once and use many times.
Compiled by Paul Wise, 2018
Acknowledgement
Thanks to Drew Clarke for providing a copy of his work in the form of the 1985 Request for Tender for the upgrading of then Natmap's digital mapping system and Laurie McLean for his assistance with the evolution of AS2482.
Photographs
An album of photographs showing most of the above equipment can be viewed via this link.
Sources
Australian Surveying and Land Information Group (AUSLIG) Topographic Data and Map Specifications for GEODATA TOPO-250K V2 Vector Product, GEODATA TOPO 100K V1 Vector product and NTMS Series 1: 250,000 & 1: 100,000 scale topographic map products.
Bomford, Anthony Gerald (1971), Automated Cartography in the Division of National Mapping, Cartography, Vol.7, No.3, pp.119-125.
Clarke, Andrew L, Swift, Alan, Trezise, Paul Trezise (2011), 100 Years of National Topographic Mapping in Australia - are we there yet?, 100 Years of National Topographic Mapping Conference, Canberra 2011, on CDROM.
Coulthard-Clark, Christopher D (2000), Australia’s Military Map-Makers: The Royal Australian Survey Corps 1915-96, Oxford University Press, 2000, ISBN 0 19 551343 6.
Division of National Mapping (1971-86), Statement of Activities for period 1971-1986, prepared by the Division of National Mapping, Department of National Resources, Canberra.
Hocking, David R (1987), Mapping Data and the National Mapping Programme, The Globe, No.28, pp.31-37.
Intergovernmental Committee on Surveying and Mapping (2107), Permanent Committee on Topographic Information, National Topographic Information Coordination Initiative, accessed at : http://www.icsm.gov.au/topo/ntici.html
Hoogsteden, Christopher (2001), Restoring Value : The revision of the AUSLIG medium-scale topographical mapping programme, personal copy.
Kennard, Robert W and Stott, Robert J (1977), An Automatic Name Selection and Typesetting System, Division of National Mapping, Technical Report 22.
Konecny, Gottfried (1967), Automation in Photogrammetry, Report on Colloquium Control for Mapping by Geodetic and Photogrammetric Methods (Ed. P. V. Angus-Leppan) held at the University of New South Wales, 22-24 May, 1967, pp. 96-122, accessed at : http://www.gmat.unsw.edu.au/about/school_pubs/pdfmono/mono00.pdf
Lines, John D (1992), Australia on Paper - The Story of Australian Mapping, Fortune Publications, Box Hill.
MacLeod, IDG, Fryer, JG and Smith, DR (1973), A Rational Approach to Automated Cartography, Division of National Mapping, Technical Report 16.
Menzies, Rod W and Wise, Paul J (2011), The 1: 100,000 Scale Topographic Mapping Program – Assisted by Technology, 100 Years of National Topographic Mapping Conference, Canberra 2011, Paper 7 from CDROM and available via this link.
O’Donnell, Ian (2006), The State of National Mapping 400 Years On, 400 Years of Mapping Australia, 2006, Darwin, on CD-ROM.
Royal Australian Survey Corps (1978), Position Paper : AUTOMAP - March 1978, National Mapping Council, 29th Technical Sub-committee Meeting, Bendigo, 1978, Item 5.3.12.
Scott, Gregory (2010), Topographic Mapping in Australia : The Future State, International Federation of Surveyors (FIG) Congress, Sydney, Australia, 11-16 April 2010.
Scott, Gregory (2011), Topographic Mapping in Australia – From the Present to the Future, 100 Years of National Topographic Mapping Conference, Canberra 2011, Paper 11 on CDROM.
Trezise, Paul & Lyons, Patrick, (interviewer.) & Geoscience Australia & National Library of Australia (2015), Paul Trezise interviewed by Patrick Lyons in the History of Australian Geoscience oral history project, accessed at : https://trove.nla.gov.au/music/result?q=subject%3A%22Surveyors+--+Australia+--+Interviews.%22
Thomson, WA (circa 1984), Digital Mapping in Natmap, Internal document.
United States of America (1967), Evaluation of Stereomat IV (Automatic Stereoplotter), Proceedings, Fifth United Nations Regional Cartographic Conference for Asia and the Far East (E/CONF 52/5), Canberra, March 1967, pp. 213-218, accessed at : http://unstats.un.org/unsd/geoinfo/RCC/docs/rccap5/5th_UNRCCAP_econf.52_5.pdf
Annexure A
AS2482 - Australian Standard for Interchange of Feature Coded Digital Mapping Data
As the Commonwealth’s defence and civilian mapping agencies embarked on digital data capture the Army and National Mapping saw that to maximise the benefits of their captured digits their storage and interchange should be as identical as possible. The imperative was to avoid any duplication in the digitising of topographic data. By 1974 the Commonwealth had a working exchange standard in place.
It soon became clear that many other organisations besides those represented on the National Mapping Council would be interested in the standard. A significant number of those organisations being private sector consultants who were implementing the capability to produce digital mapping data for government mapping authorities.
The NMC thus formed a Working Party to develop a standard for the exchange of digital topographic information. In 1977 the National Mapping Council adopted the Standard for Exchange of Topographic Information on Magnetic Tape. This standard was described in National Mapping’s 1976 paper [^data exch std 1977.pdf] Standard for Exchange of Topographic Data on Magnetic Tape (Division of National Mapping, 1976).
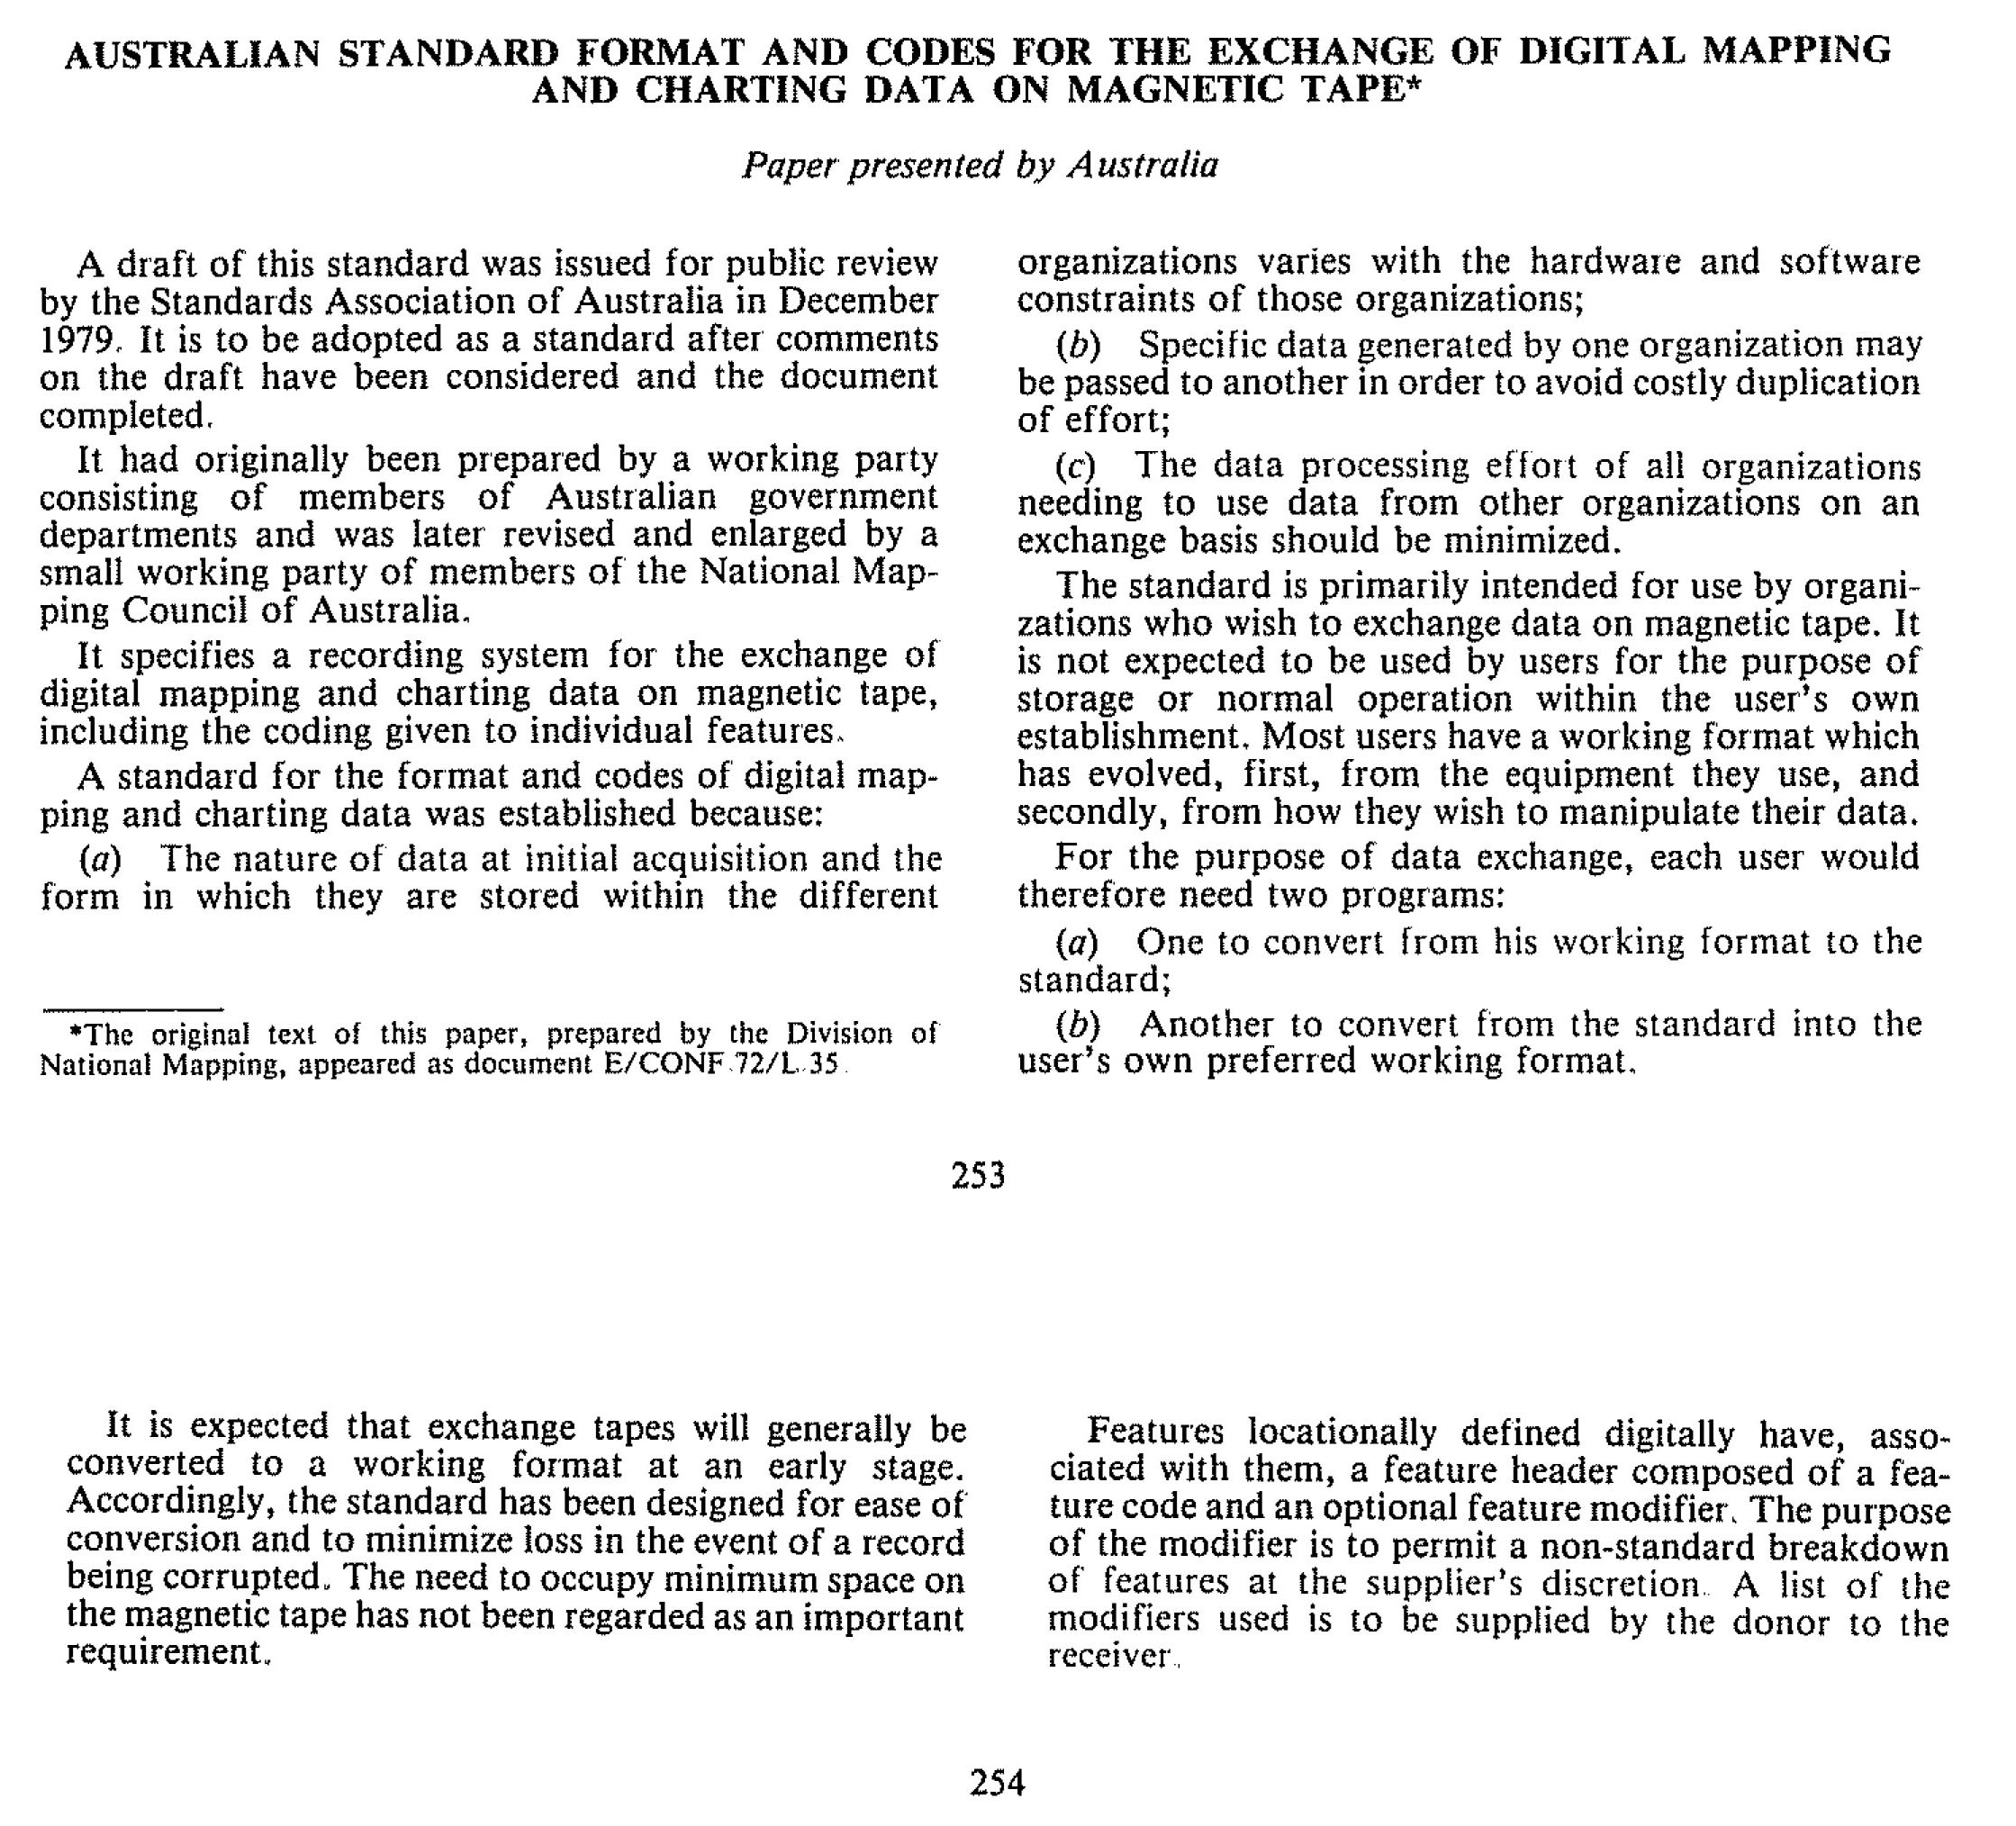
By now however, utilities and other agencies who were also starting to capture their mapping data digitally became interested in the standard, and in 1979 the National Mapping Council asked Standards Association of Australia (SAA) to publish the document as an Australian Standard. This involved public examination of the draft and as a result the SAA enlarged its scope to cover all types of mapping. The Division of National Mapping’s 1979 paper, Australian Standard Format and Codes for the Exchange of Digital Mapping and Charting Data on Magnetic Tape, described its status at this time.
A final draft of the standard was approved by the Standards Association in May 1981 and was published in August 1981 as AS2482 - Australian Standard for Interchange of Feature Coded Digital Mapping Data. Australia was believed to be the first country to publish a national standard for this purpose.
In 1982 a NMC Working Party developed a subset of AS2482 Recommended Procedures for the Interchange of Digital Mapping and Charting Data on Magnetic Tape. The subset defined preferred options in places where the Standard allowed for alternatives.
What is now called the second edition of the standard was published by the SAA in 1984 (AS2482-1984). This version was an extension of the 1981 standard, adding more feature codes and improving the scope and content of various record types.
To implement AS2482-1984 and the reflect the experience of members in the use of the standard, the NMC in 1985 revised its recommended procedures. The NMC document was titled Recommended Procedures for the Interchange of Small and Medium Scale Digital Vector Topographic Mapping Data to indicate the NMC view of the narrow scope of AS2482. The NMC document was published by National Mapping as SP12 [Dig Data Exchange.pdf] Special Publication 12.
In 1987 the SAA formed Committee IT/4, Geographical Information Systems. This was partly in response to a request from the NMC to change the title of AS2482 to reflect its narrow application. Key outcomes from the initial meeting of IT/4 were to produce a third version of AS2482 by incorporating the NMC subset, and to assess the United States Draft Standard for Digital Cartographic Data with a view to adopting it as a basis for development of a new Australian Standard to supersede AS2482. Subcommittee IT/4/2, Geographic Data Exchange Formats, was formed to undertake these tasks. (Information Technology Committee Number Four (IT/4), Geographical Information Systems, had representatives from government agencies, academia, industry associations, professional societies and research bodies involved in surveying, mapping and land information. Development of spatial data transfer standards was the responsibility of Subcommittee IT/4/2, Geographic Data Exchange Formats.)
Standards Australia published the third edition of AS2482 in 1989 (AS2482-1989). AS2482-1989 was compatible with AS2482-1984 and included an Appendix based on the 1985 NMC subset. The description of the scope was changed and other minor changes were made to reflect developments relating to the Australian Geodetic System and to enable identification of versions of AS2482. The 1989 standard is described in this paper [^ALC 2482.pdf] Australian Standards for Spatial Data Transfer.
By the 1990s, Geographic Information System (GIS) technology was being applied to the digital data and found that the existing data structures unsuitable for databases or analyses without major reorganisation/editing of the data. Specific difficulties with AS2482 were seen to be :
|
- |
no support for polygon, grid or raster data types; |
|
- |
not support for topologically structured data; |
|
- |
only minimal provision for data quality information; |
|
- |
Only minimal provision for attribute data. |
These problems however, merely reflected the original purpose of the standard, which was to facilitate data transfer for digital topographic map production. It was therefore not a criticism of those involved with its development to say that it was not suitable for use as a general purpose spatial data transfer standard for GIS and related applications.
In 1988 the changing operational environment of the late 1980s led to the cessation of the NMC and the formation of the Intergovernmental Committee on Surveying and Mapping (ICSM) to cover both surveying and mapping issues, as they related to Government activities, to ensure continued cooperation in these activities on a national basis. One of the committees formed within ICSM was the Permanent Committee on Topographic Information (PCTI).
The PCTI was established in recognition of the long term, ongoing need for a coordinated approach to topographic data collection, management and delivery. This was to involve all the ICSM jurisdictions including other key government and industry stakeholder groups where necessary. The work was to be carried out in accord with ANZLIC - the Spatial Information Council’s implementation of the Foundation Spatial Data Framework (FSDF) (in 2002 ICSM became a Standing Committee of ANZLIC – the Australian and New Zealand Spatial Information Council. The ANZLIC Foundation Spatial Data Framework (FSDF) provides a common reference for the assembly and maintenance of Australian and New Zealand foundation level spatial data in order to serve the widest possible variety of users. It is delivering national coverage of the best available, most current, authoritative source of foundation spatial data which is standardised and quality controlled.)
The ICSM PCTI established the National Topographic Information Coordination Initiative (NTICI). Through these developing mechanisms a whole of government approach to the collection, availability and maintenance of topographic information to meet the needs of governments and the public, adding value to the topographic layers of the NSII (National Spatial Information Infrastructure) whilst recognising the different but complementary roles and responsibilities of the spatial data agencies in the different jurisdictions. One such mechanism is the Standardised National Feature Codes document describing a national standard set of feature codes and feature definitions for topographic data. This document brings together a diverse group of data dictionaries and standards into a single amalgamated set of feature codes and feature definitions. Where possible, ICSMs Harmonised Data Model (HDM) feature definitions have been used.
In 2015 AS2482-1989 was withdrawn and has not been superseded by an Australian Standard.
Sources for Annexure A
Clarke, Andrew (1991), Australian Standards for Spatial Data Transfer, pp.18-36 in Moellering, Harold (Ed.) (2013), Spatial Database Transfer Standards : Current International Status, International Cartographic Association Working Group on Digital Cartographic Transfer Standards, Elsevier Applied Science accessed at : https://books.google.com.au/books?id=YNf-BAAAQBAJ&pg=PA166&lpg=PA166&dq=DIGITAL+DATA+CLARKE&source=bl&ots=d3PvWy9X9n&sig=ktbbCaSV4KLjW6gnDxVbtkzawMc&hl=en&sa=X&ved=2ahUKEwjFv7W3vMDcAhVUMt4KHW5QBh8Q6AEwDnoECAkQAQ#v=onepage&q=DIGITAL%20DATA%20CLARKE&f=false
Division of National Mapping (1976), Standard for Exchange of Topographic Data on Magnetic Tape, 8th United Nations Regional Cartographic Conference for Asia and the far East, Bangkok 1977, pp.274-276, accessed at : https://unstats.un.org/unsd/geoinfo/RCC/docs/rccap8/8th_UNRCCAP_econf.68_8_Add1.pdf
Division of National Mapping (1979), Australian Standard Format and Codes for the Exchange of Digital Mapping and Charting Data on Magnetic Tape, 9th United Nations Regional Cartographic Conference for Asia and the Pacific, Wellington 1980, United Nations Publication, E.81.I.2 (1980), E/CONF.72/4, pp.253-254, accessed at : https://unstats.un.org/unsd/geoinfo/RCC/unrccap9.html
Division of National Mapping (1981), Statement of Activities : 1980-81, Division of National Mapping.
Standards Association of Australia (1989), AS2482 : Geographic Information Systems - Geographic Data - Interchange of Feature Coded Digital Mapping Data, Standards Australia, NSW (first published 1981, second edition 1984, third edition 1989) accessed at : https://infostore.saiglobal.com/preview/as/as2000/2400/2482.pdf?sku=272000