|
| Home |
| People |
| Photos |
| Documents |
| Products |
| Videos |
|
Australian Primary Data Acquisition Progress Maps
1827-1988
|
Circa 1753
|
|
|
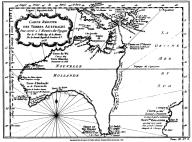
Carte Reduite
Des Terres
Australes
Pour servir a 1'Histoire des Voyages
Par le SnBellin Ing. de la Marine
De la Societe Royale de Londres c/1753
The first reputed visit to the shores of Terra Australis was by a
French sailor named Binnot Paulmier duGonneville in 1503, although his
description of an island continent seems more applicable to the Island of
Madagascar rather than Australia. In 1529 another Frenchman, Jean
Parmentier, is reported to have made a voyage to Australian waters, but
whether he saw the continent is uncertain. Many maps produced in the 16th
century were
based on reports by Parmentier but it is more likely that information
portrayed was copied from Portuguese originals acquired by the
French. The depiction of one uninterrupted continent joining large masses
of Southern Lands appeared on many world maps published by the French up
until 1778.
This small map by Jean Nicolas
Bellin (1703-1772) is no exception. Bellin (himself attached to the French
Maritime Office) here has added a theoretical coastline joining Australia,
New Guinea and Tasmania with the note I suppose that the land of Diemen
(Tasmania) can join with the land of the Holy Ghost, but this is without
proof.
The map, like others was based on Tasman and includes Dampier's
Sharks Bay, the coast seen by Abraham de Bellebat de Duquesne-Guitton (1648-1724), in 1687 and the I des Filles discovered by the
Dutch in 1697 and appeared in Neptune Francois published in 1753.
|
|
1846
|
|
|
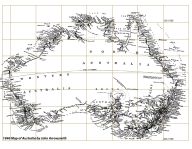
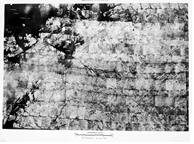
The 1846 Map
of Australia by John Arrowsmith demonstrated what an editorial in
the Argus (Melbourne) newspaper of 1861 was referring to when it
spoke of the map of this continent being largely a ghastly blank because
so little of the interior had been explored let alone mapped.
|
|
1519-1901
|
|
|
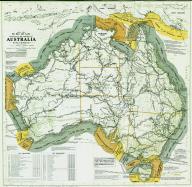
The discovery and exploration of
Australia by sea and land 1519-1901; late 1920s map
by HEC Robinson.
A zoomable version of this map is
viewable via this link and updated
tables contained therein, may be viewed via this link.
|
|
1834
|
|
|
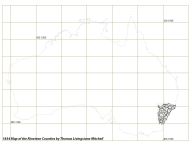
Some forty years after the First
Fleet commenced settlement, the arrival in 1827 of then Major (later
Sir) Thomas Livingstone Mitchell (1792-1855) as Surveyor General saw the
first systematic surveying and mapping of Australia. Towards the end of Mitchell’s management,
he was able to say that due to the extensiveness of his surveys, any
land sold since 1831 had been measured and mapped in its true place. By
1834, Mitchell had prepared a map, commonly called the Map of the Nineteen Counties,
based on his triangulation covering the nineteen counties then existing
around Sydney.
|
|
1867-1912
|
|
|
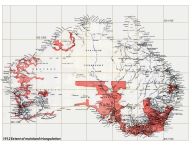
At the 1912 Conference
of the Director of Commonwealth Lands and Surveys, the Surveyor General and
the Government Astronomer of New Zealand, and the Surveyors General of the
States of the Commonwealth of Australia, held in Melbourne, the now
States reported on their survey work to date. These reports essentially
summarised their colonial triangulation schemes during the period 1867 to
1912. The individual States’ coverage maps
and a consolidated map may be viewed via this link (placing the cursor on the slideshow
will bring up a controller to manually view and pause individual maps).
The report of the 1912 Conference
may be viewed via this link.
|
|
1930-1937
|
|
|
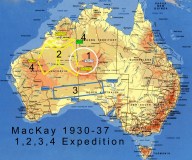
During 1930-37, Donald George Mackay
led four private aerial survey expeditions to map the largely unknown
Australian interior :
- The first
expedition in 1930, established a base camp near llbpilla Soak about 350
kilometres north-west of Alice Springs. From there the work extended
radially out to a distance of about 250 kilometres;
- A second
expedition took place in 1933 and operated from Docker River in the
Northern Territory and Roy Hill and Fitzroy Crossing in Western Australia.
The three base sites formed a triangle with sides about 1000 kilometres in
length (the range of Mackay’s aircraft). From these bases, large areas of
the Great Sandy and Gibson Deserts were surveyed;
- The third, 1935
expedition surveyed a strip of country about 1400 kilometres long and about
500 kilometres wide, immediately to the north of the transcontinental
railway. It used bases at Cook, Forrest, Laverton, Oodnadatta and Rawlinna;
- The fourth and
final expedition in 1937 was based at Tanami (about 470 kilometres due west
of Tennant Creek) and Roy Hill again. The 1937 expedition filled in some
gaps from previous flights.
The areas covered by Mackay’s four
expeditions between 1930 and 1937 are shown on this map.
|
|
1912-1950
|
|
|
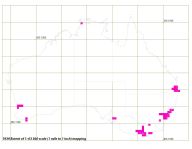
At the outbreak of World War 2, less
than 2 per cent of Australia had been mapped at a scale of one mile to one
inch. This coverage comprised some 80 map sheets in New South Wales,
Victoria and Queensland. A result of RA Survey’s own efforts, this mapping
was produced post World War 1 at an average rate of about 4 map sheets per
year.
The wartime need for maps
led to the instigation of the Emergency Mapping Scheme in November 1940.
Under the Scheme 1: 63 360 scale (1 mile to 1 inch) mapping was accelerated,
and new series at 1: 506 880 (8 miles to 1 inch) scale and 1: 253 440 (4
miles to 1 inch) scale were commenced. The Scheme resulted in some :
- 62 map sheets at
1: 506 880 scale;
- 230 map sheets at
1: 253 440 scale, and
- 342 map sheets at
1: 63 360 scale map sheets being produced (172 map sheets at 1: 63 360
scale being Standard Editions).
Owing to the necessarily tight
production timeframe, however, the quality of this mapping varied. Mapping
at 1:63,360 scale and 1:250,000 scale continued after the war.
Coverage at the various scales at
1939, 1945 and 1950 may be viewed via this link
(placing the cursor on the slideshow will bring up a controller to manually
view and pause individual maps).
|
|
1935-1966
|
|
|
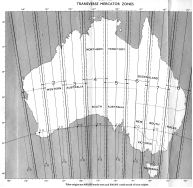
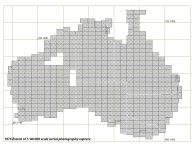
Australia’s first national map coverage was the mainly uncontoured R502
series. This map series comprised 540 printed map sheets at a scale of 1:
250 000 essentially controlled, horizontally by astrofixes and with spot
heights determined by barometric heighting techniques. Detail was plotted
from 1: 50 000 scale aerial photography using a transverse Mercator
projection and a corresponding yard grid (Clarke 1858 spheroid) which
covered the whole of Australia in 8 zones. Each zone was 5 degrees of longitude
wide with a half degree of common overlap. This was a simple projection
with no provision for a scale factor and each zone’s true origin at 34 degrees south latitude. This
projection was used for the R502 map series until replaced in 1966 when the
Australian Map Grid (AMG) was adopted. After adoption of the AMG, almost
half the R502 maps were overprinted with the 10 000 metre
grid in cyan. The last R502 map sheet went to press in 1968.
The R502 map index, a diagram of the 8 zone, transverse
Mercator projection and a 1956 National Mapping Council recommendation for future (Imperial) Map Scales to achieve National Coverage, may be viewed via this link (placing the cursor on the slideshow
will bring up a controller to manually view and pause individual diagrams).
|
|
1940-1960
|
|
|
When produced in 1936, the Sale 1:
63 360 scale (1 mile to 1 inch) map sheet was the first Australian map
sheet to be fully compiled from Royal Australian Air Force aerial
photography. For the Emergency Mapping Scheme, however, three simultaneous
camera Trimetrogon aerial photography was acquired. This process enabled
vast areas to be captured on film quickly.
Post-war aerial photography coverage
was an on-going requirement that saw camera equipped Royal Australian Air
Force aircraft operating in most States. In 1953, however, the government
directed that contracts for aerial photography should be let to commercial
aerial survey companies for any aerial photography required by Commonwealth
departments up to a limit of £120,000 per annum. The RAAF’s role in civilian mapping photographic acquisition
subsequently ceased. Thus, 1: 50 000 scale aerial photography supplied by
the RAAF and civilian contractors was used for most of the R502 series
mapping.
The extent of aerial photography by
the Trimetrogon system 1942-45 (plus 3 sheets in South Australia in 1950)
and the progress of 1: 50 000 scale aerial photography capture may be
viewed via this link (placing the
cursor on the slideshow will bring up a controller to manually view and
pause individual maps).
|
|
1945-1985
|
|
|
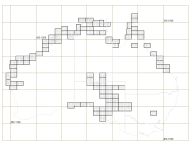
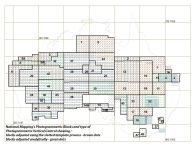
From its earliest years Nat Map had
used graphical radial triangulation or commonly slotted templates to
mechanically intensify the mainly perimeter horizontal control to the
photogrammetric model level, within a photogrammetric block. Such blocks of
photogrammetric control adjustment were continued into the NTMS era. With
the implementation of computer processing, however, photogrammetric control
adjustment was also undertaken by analytical or numerical methods.
National Mapping’s Photogrammetric Blocks showing the blocks adjusted using the
slotted template process and the blocks adjusted analytically, may be
viewed via this link.
|
|
1945-1978
|
|
|
Throughout the Nat Map era various
programs of Photomapping were undertaken in order to provide information
from aerial photography in a speedy and cost effective
form. From its earliest days Nat Map produced Uncontrolled and
Semicontrolled Mosaics for Photomaps at 1: 63 360 (1 mile to 1 inch) scale
in selected and resource rich areas. A program to produce photomaps at 1:
253 440 scale (4 miles to 1 inch) from semicontrolled mosaics, commenced in
1950. When completed each mosaic was now oriented and at average scale.
Major detail was then annotated in ink to be visible at final scale and a
separate legend composed. Available 1: 50 000 scale aerial photography was
used in these programs.
Subsequently, between 1965 and 1972
1: 100 000 scale photo indices were produced from aerial photographs
captured with Wild RC9 aerial survey cameras at a nominal 1: 80 000 scale.
Automated photogrammetric techniques were used by Nat Map from 1968 to 1978
to publish 783 1: 100 000 scale orthophotomaps. An orthophotomap was a
mosaic of 1: 80 000 scale aerial photographs where the photographic images
had been rectified to their true plan positions. This mid 1968 diagram shows the planned method of compilation for each Nat Map responsible, 1: 100 000 scale map sheet.
More on these programs may be read
at Photomaps.
|
|
1948-1965
|
|
|
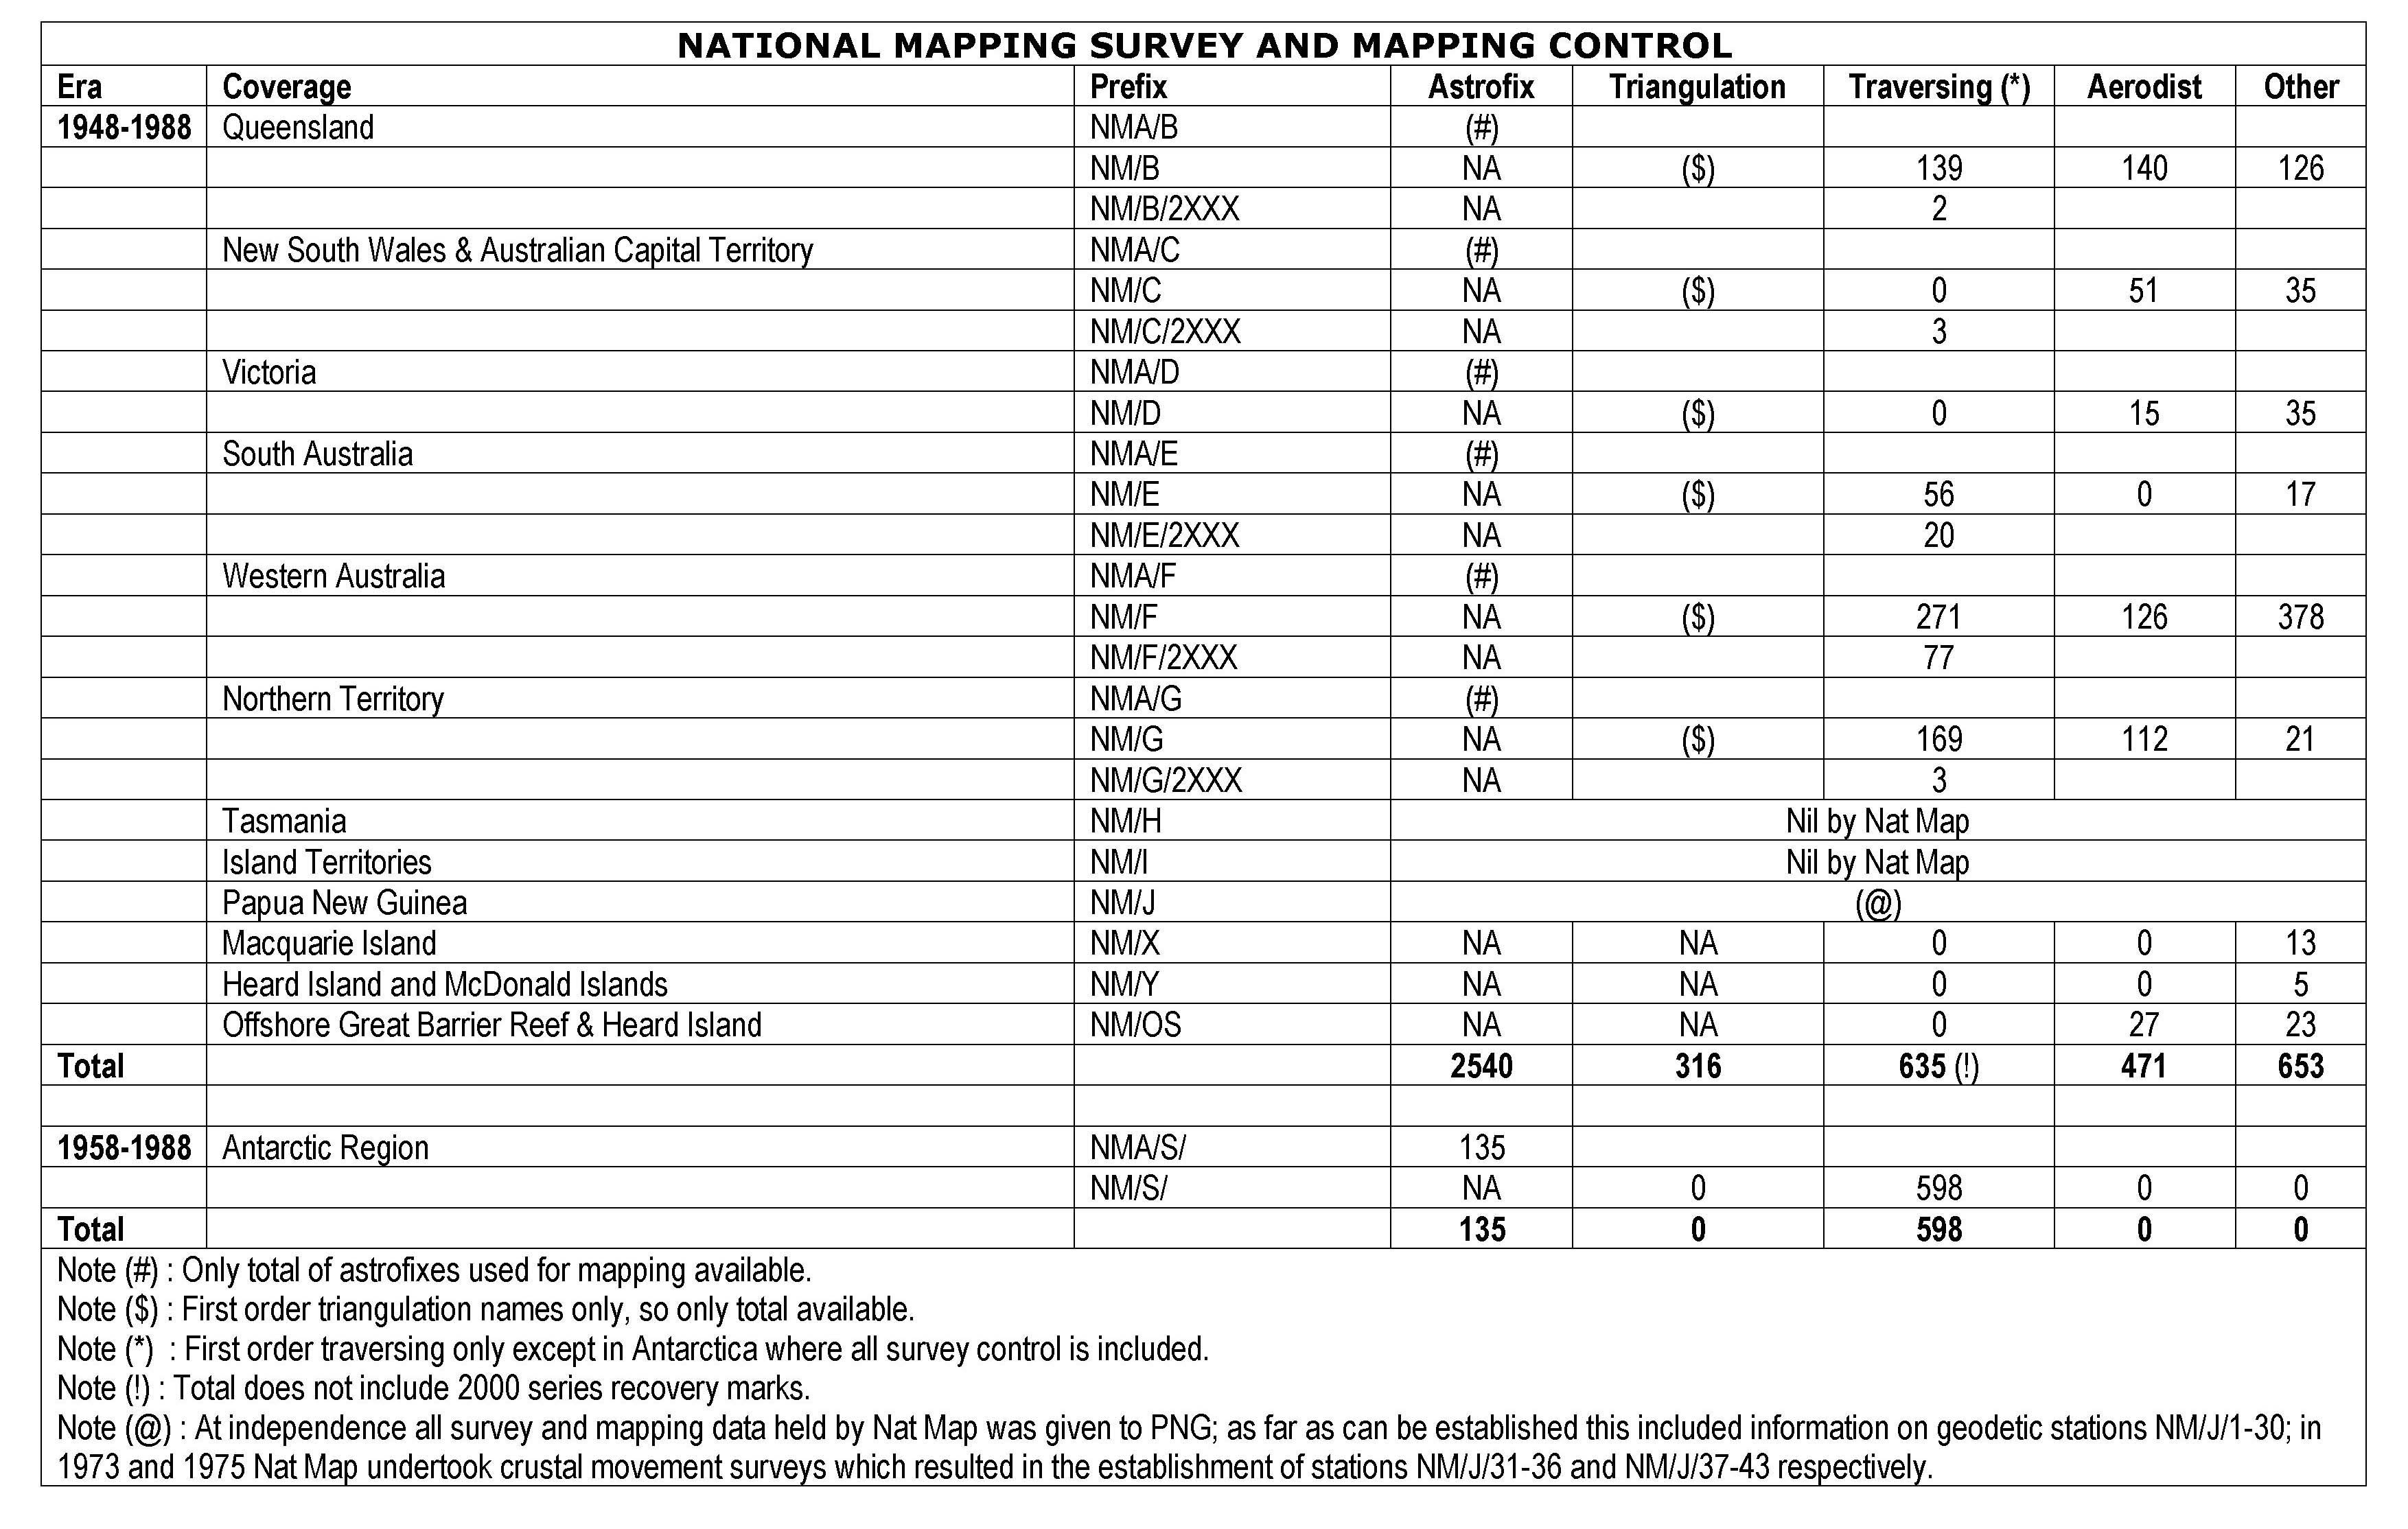
Horizontal control for the initial
photomapping programs and later R502 1: 250 000 scale mapping program,
was mainly provided by astronomical observations for geographical position
or astrofixes. Some 2 540 astrofixes were used for the R502 mapping
program. Height was determined at each astrofix site using barometric
heighting techniques.
In addition to the survey control
and astrofixes established by RA Survey and National Mapping, each of the
State mapping agencies of the time contributed as well as the following
organisations :
Australian Gulf Oil Company
Ltd
Delhi Australia Petroleum Pty
Ltd
Department of Interior
Hydrographic Office, Royal
Australian Navy
Snowy Mountains Hydro Electric
Authority
Country Roads Board, Victoria
Weapons Research Establishment,
Department of Supply
Western Australian Petroleum Pty Ltd
(WAPET).
The extent of the astrofix program
may be viewed via this link (placing
the cursor on the slideshow will bring up a controller to manually view and
pause individual diagrams).
|
|
1948-1988
|
|
|
Photogrammetric vertical control
provided its own challenge. Initially height difference came from simple
vertical angle and distance between the two points. During 1954-65 geodetic
survey height difference was carried point to point by observing simultaneous
reciprocal vertical angles. For the R502 mapping program heights were
obtained using banks of aneroid barometers or aircraft altimeters.
In the early 1960s Aneroid barometers by Mechanism Limited of Croydon, UK,
became available to Nat Map. These mechanism barometers became
standard equipment for all survey parties for obtaining air pressure
observations.
In 1968 a photogrammetric block was
controlled by barometric observational techniques. A highly specialised
vehicle, the Johnson Ground Elevation Meter, was used to obtain
photogrammetric vertical control in suitable areas of Australia between
1964-70. An airborne solution was seen as the most suitable for acquiring
photogrammetric vertical control over the vast areas of Australia.
The Canadian Airborne Profile
Recorder (APR) was used under contract to Nat Map. Some nine separate
contracts were let between 1962 and 1973 to supply terrain profiles (when
the Laser Terrain Profiler became operational some APR areas were strengthened
with mainly north-south laser profiles). The relative success of this
equipment led to Nat Map having developed the Laser Terrain Profiler (LTP
or WREMAPS1). Initially installed in a contract aircraft from 1970-75, in
1977 the laser profiler was installed in Nat Map’s own aircraft until the terrain profiling program was
completed in 1979. A second
generation terrain profiling system, the Laser Airborne
profiling System (LAPS) was operated by Nat Map during 1987-88. More on
photogrammetric vertical control is available here.
The progress of acquiring
photogrammetric vertical control may be viewed via this link (placing the cursor on the slideshow
will bring up a controller to manually view and pause individual diagrams).
|
|
1950-1980
|
|
|
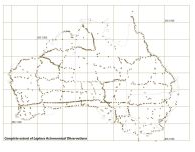
Laplace astronomical observations by
National Mapping commenced in 1950. For the next 20 years or so observation
programs continued such that when the Australian Geodetic Survey was
completed it was considered to be particularly strong in azimuth due to the
great number of Laplace stations within the network.
In 1962 the Maurice origin
emerged from the astronomic/geodetic comparison of the coordinates at 54
Laplace stations along the vicinity of the 32º parallel between Sydney and
Perth. An improved origin was then determined from the coordinates at 155
Laplace stations spread over the whole of Australia with the exception of
Cape York and Tasmania. By December 1965, further Laplace observations had
also been undertaken to then include Cape York and Tasmania, bringing the
total number of Australian Laplace stations to 533. Of these Laplace
stations, 275 stations were judiciously selected and the central origin
calculated was formally named the Johnston Geodetic Station, or Johnston
Origin, for the Australian geodetic adjustment 1966 (AGD66). By 1979,
Laplace observations totalled 1 593.
The extent of the Laplace program
may be viewed via this link (placing
the cursor on the slideshow will bring up a controller to manually view and
pause individual diagrams).
|
|
1950-1970
|
|
|
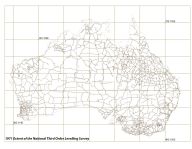
The major part of the National Third
Order Levelling Survey was undertaken from 1961-70. However, earlier
levelling work starting in the 1950s was mainly found to meet
specifications and able to be incorporated into the later network. This
earlier work was completed by the Department of the Interior. At the end of
1970, 161 000 kilometres of levelling had been completed.
The work selected for inclusion in
the final simultaneous mathematical adjustment of the third order levelling
network totalled 97 320 kilometres of levelling. Of this total, the
Department of Interior contributed 15 per cent, the various States 22 per
cent and National Mapping 3 per cent. The private sector played the major
role, in that private surveyors under contracts arranged by National
Mapping and overseen by the States, carried out 60 per cent of this
levelling.
The 1971 adjustment of this work was
identified as the Australian Height Datum (AHD) 1971 and defined as the
datum surface derived from a simultaneous adjustment of the two way
levelling network holding 30 tide gauges fixed at their mean sea level
values. When the adjustment was completed, there were 42 000 permanent
bench marks with values in terms of the AHD spread across the Australian
mainland. More on the AHD is available here.
The extent of the third order
levelling network at 1971 may be viewed via this link.
|
|
1954-1965
|
|
|
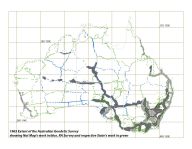
1954 saw National Mapping commence
its part in the Geodetic Survey of Australia. By the end of 1965, National
Mapping, along with RA Survey and the States, had completed the survey work
comprising some 2 506 stations, 53 000 kilometres of Tellurometer traverse,
the geodetic triangulation nets, and 533 Laplace stations. The 1966 adjustment
of this work was identified as the Australian Geodetic Adjustment, 1966
(AGD66). A 1979 readjustment first constructed a database of the 1966 data
with the following statistics : 2 490 stations, 2 305 observed distances
and 403 observed Laplace azimuths. More on the Geodetic Survey of Australia
is available here.
The progress of the Australian
Geodetic Survey, including 1956 and 1959 National Mapping Council recommendations for the future of the Geodetic Survey before and after the Tellurometer's impact was realised, may be viewed via this link
(placing the cursor on the slideshow will bring up a controller to manually
view and pause individual diagrams).
Geodetic activities continued after
1965 as described below.
|
|
1960-1987
|
|
|
Nat Map purchased the first Wild RC9
super wide
angle cameras. These were supplied to contractors and
standard coverage at a scale of 1:80 000 was commenced. The effect of the
coverage provided by the super wide angle lens in the RC9 camera
was to reduce the number of models per map area by approximately 75%, with
similar economies in subsequent handling but required more skilful photo
interpretation of map detail at the smaller scale. The systematic
East-West, 1: 80 000 scale aerial photography acquired from around 25 000
feet ASL by 1: 250 000 map sheet area, became the standard for the NTMS
program. By 1975 all of Australia, except for small pockets in Western
Australia which were proving logistically difficult, had been acquired.
In 1976 the Division of National
Mapping, following successful American experience with high altitude jet
aircraft chartered a Lear Jet aircraft and covered the remaining desert
areas with North-South Wild RC10 photography centred over map sheets from
45 000 feet ASL at a nominal scale of 1: 150 000. The flights were flown on
north-south flight lines to minimise the effect of shadow. This photography
was planned to enable an orthophotomap covering an entire 1: 50 000 scale
map sheet
to be produced from a single photograph. Problems were encountered in
resolution of the final product and with the tip and tilts resulting from
the roll and pitch of the aircraft. High altitude photography was flown in
1977-78 at 40 000 feet ASL (nominal scale 1:140 000). The Lear Jet
aircraft stability improved at this altitude but single photo coverage for
a whole 1: 50 000 map sheet
was not attainable. Resolution and orientation again presented problems
with some photographs but Australia had now been totally covered with
aerial photography flown with metric cameras.
From 1979 to 1981 (inclusive), the
Lear Jet photography program reverted to standard East-West flight lines at
a nominal scale of 1: 80 000 acquired from nominally 7 620 metres ASL.
In 1982 Nat Map acquired its own
aircraft capable of acquiring the nominal 1: 80 000 scale photography, and
such acquisition continued while Nat Map existed.
The progress of metric aerial
photography program may be viewed via this link
(placing the cursor on the slideshow will bring up a controller to manually
view and pause individual diagrams).
|
|
1963-1974
|
|
|
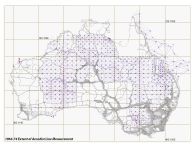
To intensify the existing geodetic
control so that the horizontal ground control was suitable for
photogrammetric mapping at 1: 100 000 scale, ground points were established
at approximately 1 degree of latitude and longitude within each of the
geodetic loops. Using Airborne Distance (Aerodist) measuring equipment and
trilateration adjustment, coordinates for each of these Aerodist stations
were calculated. Initially, the Aerodist line measuring equipment was
installed in a helicopter and ground points were established as the
Aerodist line measuring progressed. To speed up the work the Aerodist line
measuring equipment was installed in an aircraft. The efficiencies were not
achieved, however, as Aerodist station establishment lagged. Dedicated
Aerodist ground marking parties were thus formed and a program of ground
marking ran from 1966-1970. Within this ground marking program, from
1967-1969 private sector contractors established 59 stations in a block
bounded by Charters Towers and Charleville in Queensland to Tennant Creek
and Alice Springs in the Northern Territory.
During the 1963-74 Aerodist program,
473 Aerodist ground stations were established by National Mapping. The Aerodist
system measured some 3 020 lines and 30 separate trilateration adjustments
resulted in the coordinates of a total of 485 ground stations being
calculated. More on the Aerodist program is available here.
The progress of the Aerodist ground
marking and line measuring programs may be viewed via this link (placing the cursor on the slideshow
will bring up a controller to manually view and pause individual diagrams).
|
|
1966-1986
|
|
|
Geodetic activity
continued after 1965. In addition to a couple of geodetic traverses, rapid
traversing for mapping control was undertaken in Western Australia.
From 1967 to 1970, however, the majority
of National Mapping’s geodetic
resources went into refining existing surveys to generate two baselines as
part of the Worldwide Satellite Triangulation Network using PAGEOS
(Passive Geodetic Earth Orbiting Satellite). The Perth-Culgoora baseline
comprised 162 surveyed segments with a final computed length of 3,692
kilometres and the Culgoora-Thursday Island baseline comprised 102 survey
segments with a final computed length of 2,910 kilometres.
From 1970-72 a high precision
traverse connected the Johnston Origin to Adelaide, Melbourne and Canberra.
With its connection to the PAGEOS baselines Perth, Sydney and Brisbane then
became part of this high precision network.
The Central Mapping Authority of New
South Wales requested work to strengthen that State’s earlier coastal triangulation network from Mount Imlay
(about 20 kilometres south west of Eden) to the southern outskirts of
Sydney. The necessary geodetic connections were undertaken between 1972-78.
A coordinated survey using Doppler
satellite receivers was undertaken during 1975-77. Where possible the
Doppler sites were selected at junction points of the geodetic loops. A
total of 106 sites were occupied of which 98 were on the mainland.
To enable the accuracy of AGD66 to
be assessed, in 1979 a readjustment of the Australian Geodetic Survey was
undertaken. This project used computer software and techniques of the day
and included the data from 89 of the Doppler junction points
from the 1975-77 survey. The final database statistics were 3 052 stations,
4 441 observed distances, 1 593 observed Laplace azimuths and 89 Doppler
positions.
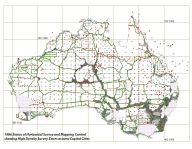
Status of Horizontal Survey and
Mapping Control at 31 December 1986. By now some 500 Class 1 (a minimum of
35 acceptable precise ephemeris passes) Doppler fixes had been observed and
high
density survey zones existed around the capital cities.
This survey activity may be viewed
via this link (placing the cursor on the
slideshow will bring up a controller to manually view and pause individual
diagrams).
|
|
1965-1988
|
|
|
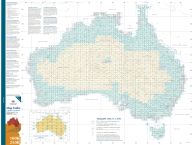
The National Topographic Mapping
Series (NTMS) was initiated in 1965. The program was for the publication of
3 062 1: 100 000 scale map sheets. In 1974 the program was revised to
having only 1 602 of these sheets (generally covering the more populated
areas) printed as 1: 100 000 scale topographic maps but now publish a new
1: 250 000 scale series of 544 map sheets; this new map series would have
contours shown at 50 metre vertical intervals, cover the whole of Australia
and thus replace the R502 series. As the 1: 250 000 scale mapping
progressed, some predominately coastal map sheet coverage was expanded to
include what would otherwise be small segments of terrain on a large blue
map sheet. Such sheets were titled specials and reduced the original
544 total
to 516 map sheets. The NTMS publication program was completed in 1988.
The NTMS was based on the Universal Transverse Mercator
projection in metres.
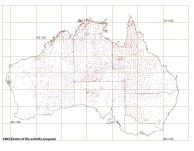
In 1974 revision of the NTMS program
also resulted in the National Mapping Council (NMC) members confirming their contributions to the program. The revised NTMS program and
contributions was all summarised in what became known as the Red Line diagram. The area within
the red line would only be published as line maps at 1: 250 000 scale.
The Red Line diagram appears to be the only document which detailed the areas of survey and mapping responsibility of the Australian mapping agencies. The NMC had no role in coordinating the programs of the Commonwealth Government's Defence and Civilian mapping agencies. In broad terms the NMC's primary coordination role (at inception in 1945) was for the Director of National Mapping to be responsible for the co-ordination of the activities of Commonwealth and State authorities. The NMC was thus being guided by resolutions of the January 1945 meeting of the Commonwealth Survey Committee and State Surveyors General, that recommended the creation of the NMC and the position of Director of National Mapping, specifically : The expression 'coordination of the mapping activities of Australia' shall be subject to the recognised policy of the Services to control their respective mapping activities provided that where practicable the standard of all work shall be not less than the minimum requirements of the National Mapping Council. On page 283 of his 1992 book Australia on Paper, Joe Lines discussing the 1: 250 000 scale, R502 series mapping program (mid 1950s-1968) stated : Army, consistent with its defence obligations, took responsibility for mapping the northern portions of the country, which of course included the then relatively unknown areas of much of Cape York Peninsula, Arnhem Land and the Kimberley region in Western Australia.it was appropriate for the Survey Corps to tackle the mapping of these areas as they had the logistic support of the Navy and RAAF on call, without having to experience the inevitable delays in coping with the unforeseen which a civilian department would have been obliged to bear. Although not mentioned by Lines, also apparently under the umbrella of defence obligations came the Woomera area and the balance of the areas around the State capitals.
The combined NTMS 1: 100 000 and 1
250 000 scale printed Map Coverage Index may be viewed here.
The eras of the completed mapping programs between 1900 and 2000 are shown in this diagram.
Summaries for the mapping format aerial photography and survey and mapping control associated with the completed R502 and NTMS mapping programs between 1945 and 1988 may be viewed via the respective link.
|
Compiled
by Paul Wise, 2020
|
|