|
| Aircraft Support | | Documents | | Operations | | People | | Photos | | Videos |
| ALS/ACRES | | NatMap in PNG |
|
National Mapping's Map Series and Other Products : 1950s to 1990s
|
|||||||||||||||||||||||||||||||||||||||||||||||||||||||||||||||||
|
AERIAL PHOTOGRAPHY ARCHIVE BY FILM TYPE (Indicative only) |
||
|
Film Type |
Quantity |
Note |
|
Monochrome |
3916 |
These unstable acetate films were later duplicated using modern material |
|
K2402 |
112 |
Kodak 2402 film was a monochrome film |
|
K2405 |
2168 |
Kodak 2405 replaced K2402 as a monochrome film |
|
K2412 |
161 |
Kodak 2412 was a monochrome film used during the high altitude operations |
|
K2424 |
137 |
Kodak 2424 was a monochrome film sensitive to infrared radiation and used in sea/land delineation along the coast |
|
K2443 |
35 |
Kodak 2443 was a false colour film sensitive to infrared radiation |
|
K2445 |
1264 |
Kodak 2445 was a colour film used for natural colour representation |
|
Total |
7793 |
This total does not include in excess of three thousand films which had been duplicated for off-site storage |
Aerial photography acquisition was recorded on flight line diagrams which show the aircrafts flight paths (also known as runs), the centre of the photos in relation to ground features, and film reference numbers. Flight line diagrams for the aerial photography archive may be accessed from Geoscience Australia's website at:
http://www.ga.gov.au/earth-observation/accessing-satellite-imagery/aerial-photography.html
Semicontrolled
Photomaps at 1:253,440 scale (4 mile to 1 inch)
In the late 1940s, with national development high on the government agenda the lack of mapping of inland Australia demanded a quick solution. The RAAF had acquired and continued to acquire 1:50,000 scale aerial photography coverage in this region but converting this information into traditional maps would have taken too long. Photomaps were the solution as these interim map products were a very useful assessment tool in the hands of investigators in engineering, mining, earth sciences, town and country planning, agriculture, forestry and not least some social sciences. The distinction between mosaics and photomaps was that photomaps were mosaics of aerial photographs which had marked or indicated boundaries which approximated conventional map sheet boundaries.
A program of Semicontrolled Photomaps commenced in 1950. Average scale was used to determine the map extents into which a perimeter framework of photos was laid down to retain common edges and azimuth. While independent ground control was not required for this process, if any such ground control was available then it was included to improve positional accuracy.
After the perimeter photos were assembled at the required scale, their positions were marked and annotated. The infill photos were then laid down, numbered and had any detail and names inked in. The result was photographed from above and the negative used to then generate copies of the map. (The size of these mosaics necessitated they be laid down on a large flat surface and a suitable floor was ideal.)
By 1960, about 75% of the Australia had been covered by approximately positioned photomaps. In addition, between 1965 and 1972, uncontrolled assemblies of air photographs or photo indices at 1:100,000 scale were also produced.
A complete description of the 1950s Photomapping processes may be found in this article Photomaps - National Mapping's First "Maps" .
In selected (resource rich) areas, photomaps at 1:63,360 (1 mile to 1 inch) were also created.
A section of a Photomap can be viewed here .
Orthophotomaps at 1:100,000 scale
Orthophotomaps were a mosaic of air photographs on which the photographic image had been rectified to its true plan position. They were published at a scale of 1:100,000 and showed the Australian Map Grid by marginal ticks at 10 kilometre intervals and a contour overlay showing contours at 20-metre vertical intervals was produced for each orthophotomap sheet.
As computer assisted technology advanced in the late 1960s it was foreseen that a rapid mapping solution might lie in the form of orthophotomaps. Additionally the push for minerals exploration required a form of map that had the detail of the aerial photograph but from which accurate coordinates could also be derived without the need for an expensive survey, so that mining claims/mineral rights could be appropriately referenced. Again the orthophotomap seemed the answer. However, owing to constraints from the original mapping photography, image quality remained an ongoing issue with a number of the orthophotomaps.
Orthophotomaps eventually gave way to digital mapping and so were only generated for a few areas in the Northern Territory and Queensland.
A section of an Orthophotomap can be viewed here .
Satellite
Imagery
Prior to Australia having direct access to image data from earth orbiting satellites, Nat Map provided satellite imagery in photographic form to various users in industry, government, academia and other research organisations and the general public. The data was derived from multi-spectral scanning equipment initially carried by the United States Earth Resources Technology Satellite (ERTS-1 later re-named Landsat-1) and from later Landsat satellites.
Each Landsat scene covered an area of 185km x 185km on the ground with minimal side overlap due to orbit constraints. A scene consisted of four separate images of the same area in the green, red, near infra-red and far infra-red bands of the spectrum. The scale of images was 1:3,400,000 and enlargements to 1:1,000,000 scale and reconstituted false colour composites of three bands (sample Landsat-2 image here ) as well as black and white images were available.
Nat Map initially provided this service from the mid to the late 1970s. After Australia built direct reception and processing facilities in 1979 both digital and photographic products were provided through the Australian Landsat Station (ALS) then within the Department of Science. In 1984, responsibility for the ALS was transferred to National Mapping and in 1986 the ALS become the Australian Centre for Remote Sensing (ACRES) in preparation for receiving data from new generation satellites from various providers including the French Satellite Pour lObservation de la Terre-SPOT. As these new satellites became operational their data were analysed and where possible integrated into Nat Maps mapping programs.
More information about the current status of Earth Observation and Satellite Imagery may be accessed from Geoscience Australia's website at:
http://www.ga.gov.au/scientific-topics/earth-obs
R502
series at 1:250,000 scale
The 1:250,000 scale R502 series of maps was the first uniform medium scale topographic map coverage of Australia. Each standard map sheet covered an area bounded by 1.5 degrees of longitude and 1 degree of latitude (about 150 kilometres from east to west and 110 kilometres from north to south). The R502 series comprised a total of 540 printed maps.
This series initially commenced around 1950 as the R501 series at a scale 1:253,440 (4 mile to 1 inch). However, after some 23 map sheets were published metric map scales were introduced and these maps were subsequently converted to the R502 series at the 1:250,000 metric scale.
Production of the R502 map series commenced around 1956. The Division of National Mapping and Royal Australian Survey Corps each compiled around 40% of the map sheets. State mapping authorities in Western Australia (17%), Queensland, Tasmania, and South Australia compiled the remainder. The Royal Australian Survey Corps and National Mapping were responsible for printing all of the map sheets with the first printing being done by RA Survey in 1956 and by Nat Map later in 1960. All sheet compilations were finalised by 1966 and printing of all the maps of the series was completed in 1968.
The majority of the horizontal control was provided by Astrofixes and detail was plotted from 1:50,000 scale aerial photography. The spot-heights shown mainly came from the use of barometric heighting techniques, however, the majority of the R502 maps were not contoured and relief was indicated by relief shading.
A simple Transverse Mercator Projection and a corresponding yard grid (Clarke 1858 spheroid) which covered the whole of Australia in 8 zones each 5° of longitude wide with a ½° of common overlap at zone edges was used. There was no provision for a scale factor and each zones true origin was at 34° South. In 1966 when the Australian Map Grid (AMG) was adopted almost half the R502 series maps were overprinted with the 10,000 metre AMG grid.
The
R502 series Map Coverage Index is available here and a section of an R502 series map here. The R501 series map (4 miles to 1 inch scale) of the Australian Capital Territory printed by the National Mapping Office may be viewed here
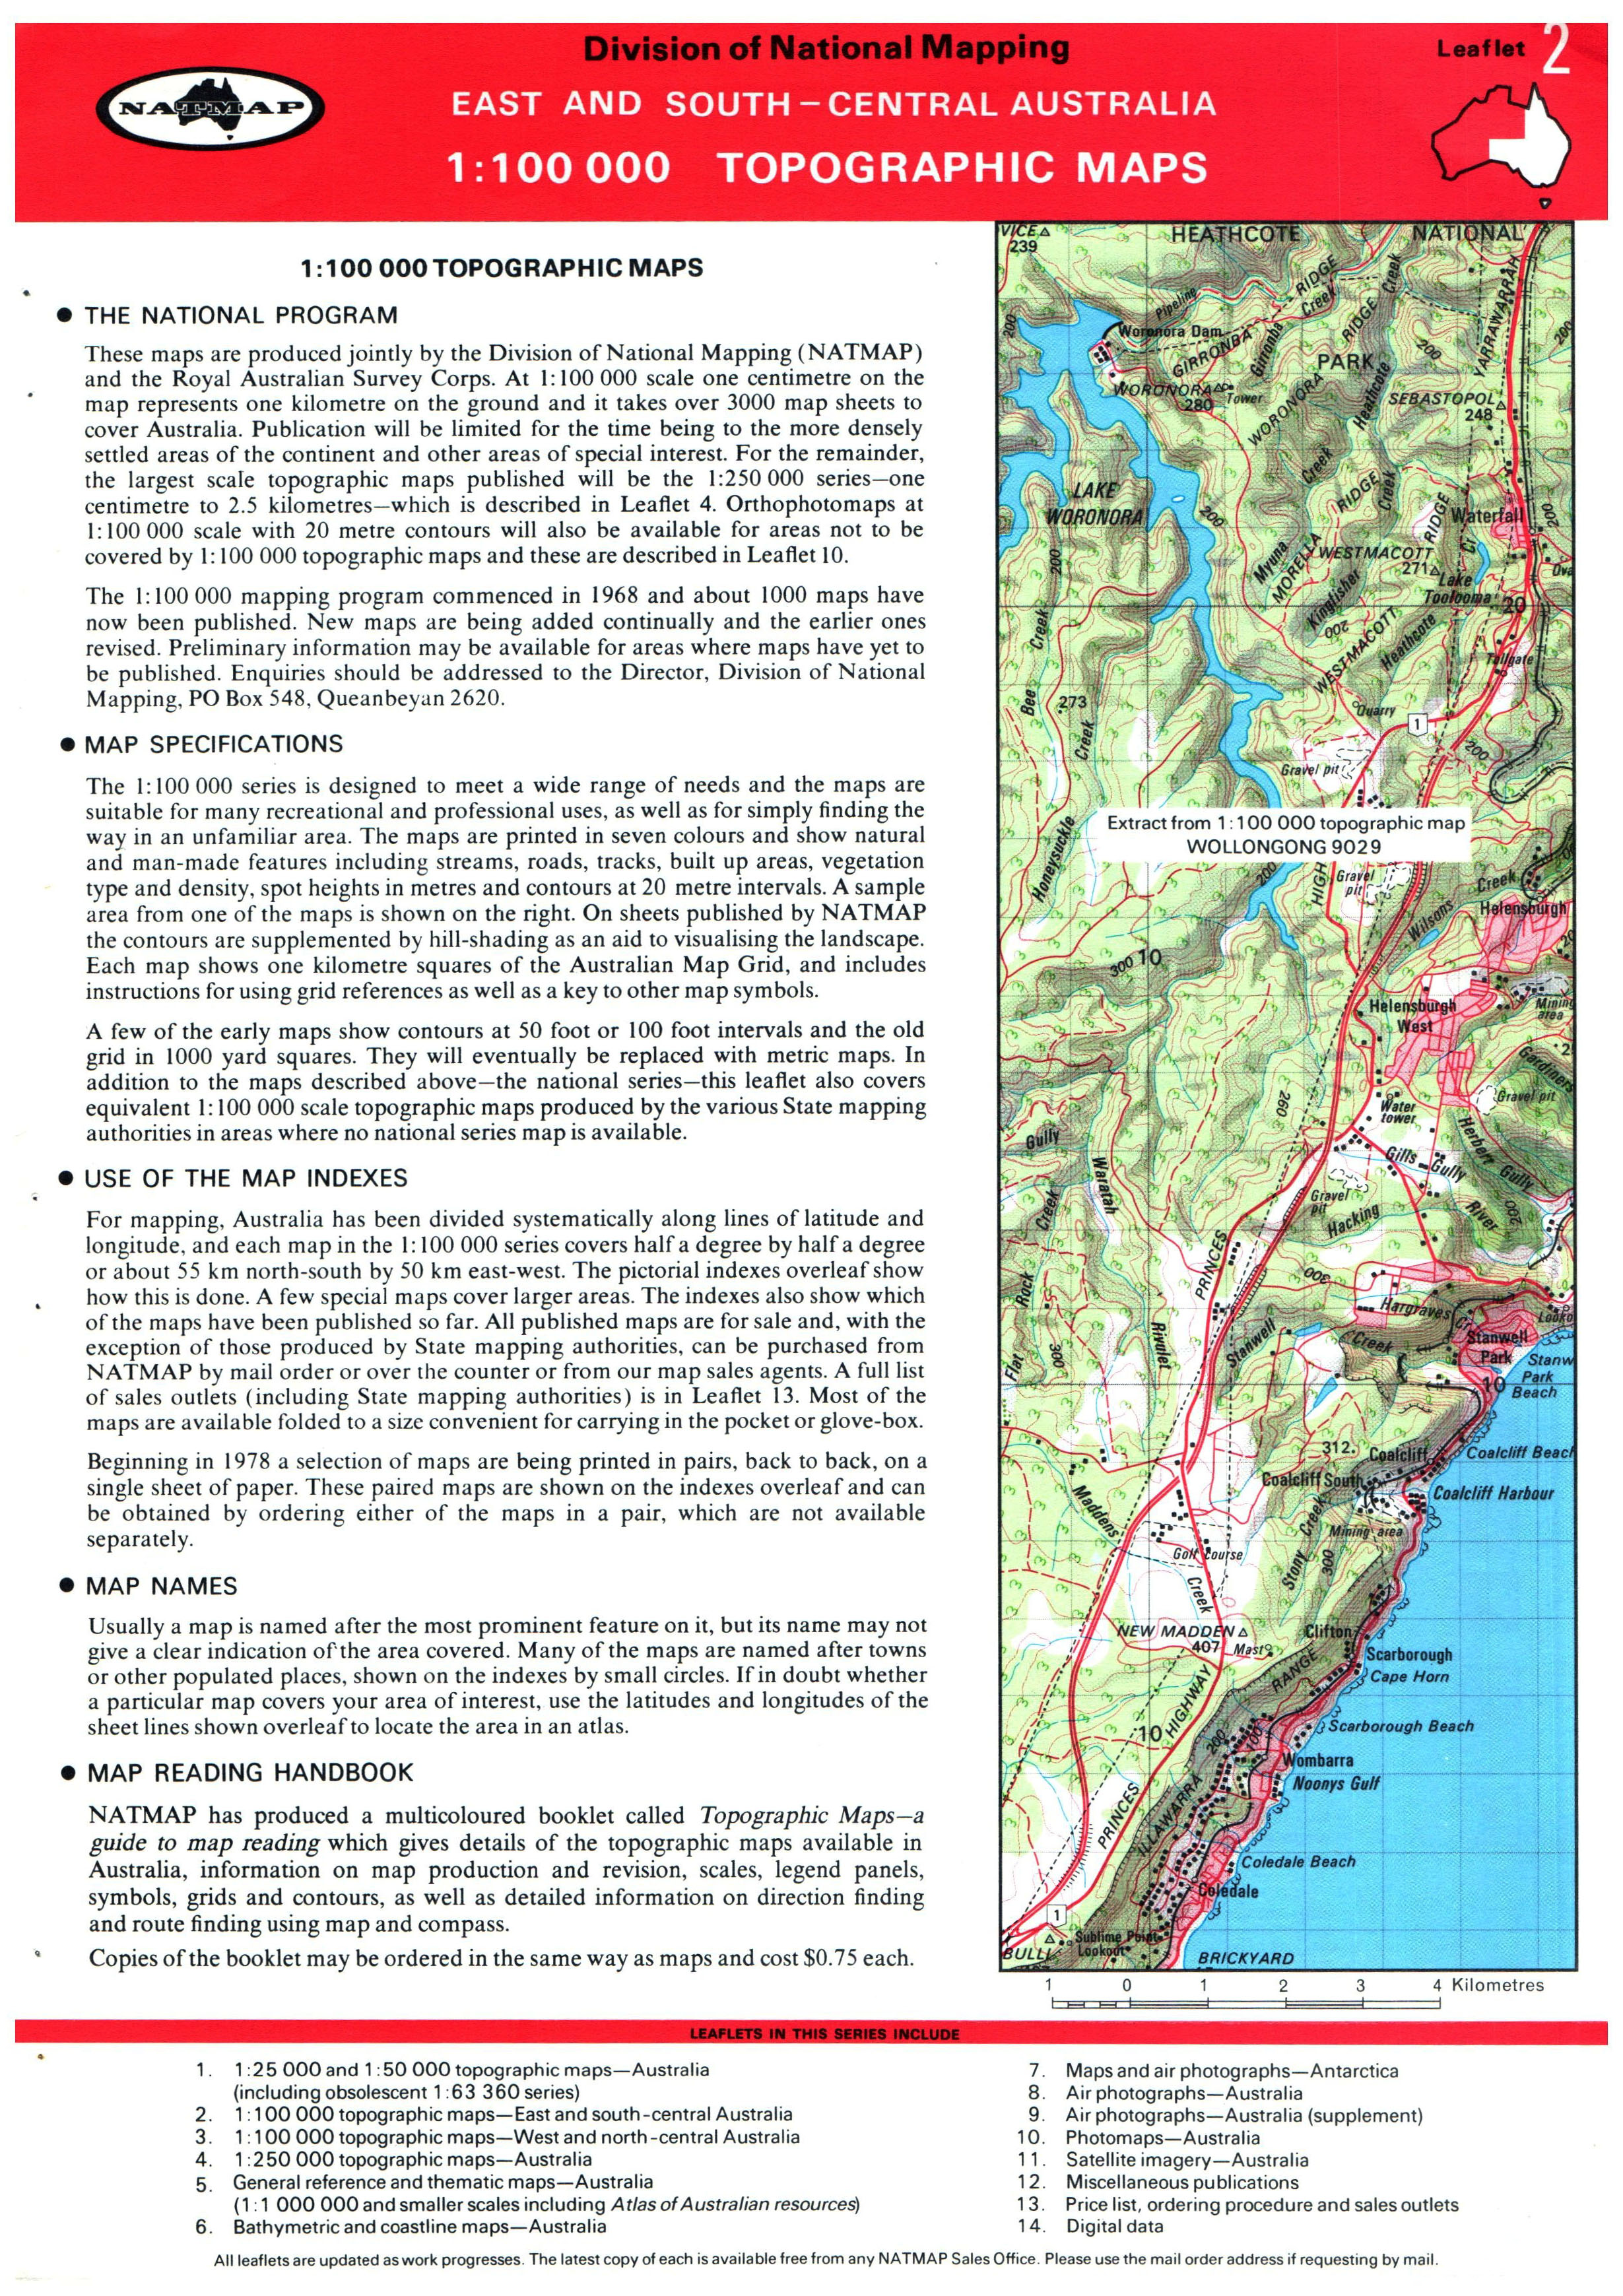
In 1965, the Commonwealth government approved the
acceleration of the national topographic mapping program with the object of
completing mapping coverage of the country at 1:100,000 scale with contours
shown at 20-metre vertical intervals by the end of 1975. Owing
to constrained resourcing the topographic mapping coverage of Australia at
1:100,000 scale was not achieved until 1988. The National Topographic Map
Series (NTMS) program involved compilation of 3,062 sheets (30´ longitude by
30´ latitude) at 1:100,000 scale. However, only 1,602 of these sheets
(generally covering the more populated areas) were printed as 1:100,000 scale
topographic maps. This
mapping program used commensurately accurate horizontal and vertical control to
orient 1:80,000 scale aerial photography from which the map detail was
extracted. The Universal Transverse Mercator projection (Australian National
Spheroid, 1966) was used as the basis of the then new Australian Map Grid with
the Equator as origin and zones 6º of longitude wide with ½º of zone overlap
and 0.9996 point scale factor. Some
of these maps were produced as orthophotomaps (refer to Orthophotomaps above)
using sophisticated aerial photo scanning-plotters (Wild Stereomat and Zeiss
Topocart) but were later converted to traditional line maps. Towards the end of
the program digital techniques for map production were starting to be employed
and a few maps were produced using that technology. The
combined NTMS 1:100,000 and 1:250,000 scale printed Map Coverage Index may be accessed from Geoscience Australia's website at: http://www.ga.gov.au/metadata-gateway/metadata/record/gcat_70199ht The
1:100,000 scale compilations were used to prepare and publish a new 1:250,000
scale series of 544 map sheets (1½º longitude by 1º latitude). This map series
which covered the whole of Australia, replaced the R502 series and had contours
shown at 50-metre vertical intervals. A sample NTMS 1:100,000 scale map may be viewed here and a sample NTMS 1:250,000 scale map here . More information about the current 1:100,000 and 1:250,000 scale mapping of Australia may be accessed from Geoscience Australia's website at: http://www.ga.gov.au/topographic-mapping.html In
1975, the Division of National Mapping published in conjunction with the
Australian Government Publishing Service a gazetteer of the place and other
feature names that appeared on the various 1:250,000 scale map sheets in the
R502 topographic map series. For each listed feature this gazetteer provided
information that included feature name, type of feature, the state and the map
sheet on which it appeared and its geographical coordinates. The gazetteer was
produced in a 220mm by 310mm format with hard board covers and comprised 1097
pages. In
1982, the Division of National Mapping released a master names file that listed
the place names and other geographical names from the 1:250,000 scale and
1:100,000 scale National Topographic Map Series. The master names file was
provided to general users as a microfiche product comprising 36 microfiche
negatives of 110mm by 150mm format and an accompanying 1 sheet negative of the
codes used for the designated topographic features. In
the days prior to the ready availability of hand-held GPS navigation units, the
Division of National Mapping published a guide to topographic maps that was
titled: Topographic Maps a guide to map reading. This guide was a 115mm by
210mm format booklet with 28 pages of text, illustrations and topographic map
extracts. Topics included: grids and map references, map scale, contours,
relief shading, map interpretation, map symbols, direction finding, the
magnetic compass and its use and route finding. This
guide was first released in 1979 and reprinted with minor amendments in 1981. It was based on a similar publication by the then New
Zealand Department of Lands and Survey and was reproduced with the permission
of New Zealands Surveyor General. Illustrations, map extracts and some text
were modified to suit Australian users. Nat Maps guide was provided to users
free of charge. In 2000, after hand-held GPS receivers had become readily available, the Australian Surveying and Land Information Group published a second edition guide that was titled: Map Reading Guide: How To Use Topographic Maps. This booklet was in 100mm by 242mm format and contained 27 pages of text, illustrations and topographic map extracts. Topics in this edition included: what is a topographic map, who makes topographic maps, how to read a topographic map, planning a trip, using a GPS, the magnetic compass, simple uses of a map and a glossary. Included in a pocket inside the rear cover of this guide was a 91mm by 155mm clear plastic map card that had colour coded line scales for reading distances from maps at scales of 1:250,000; 1:000,000; 1:50,000; and 1:25,000. The map card included a grid reference guide, a compass rose and a bearing guide. In 2000, this edition of the guide had a recommended retail price of $2.00. Information on the latest version of the guide is available via this link. National Mappings Bathymetric Mapping program commenced in
1971. Its aim was to survey the sea floor out to the edge of the Continental Shelf
and publish contoured maps of the sea bed. The program was moved to the Royal Australian
Navy's Hydrographic Service as of 1 July 1988 and was concluded around 1992‑93. After signing the Conventions on the Territorial Sea and the
Contiguous Zone and on the Continental Shelf in 1963, Australia sought to learn
as much as possible about the nature and extent of its own Continental Shelf.
This knowledge was to ensure the region could be delineated and any
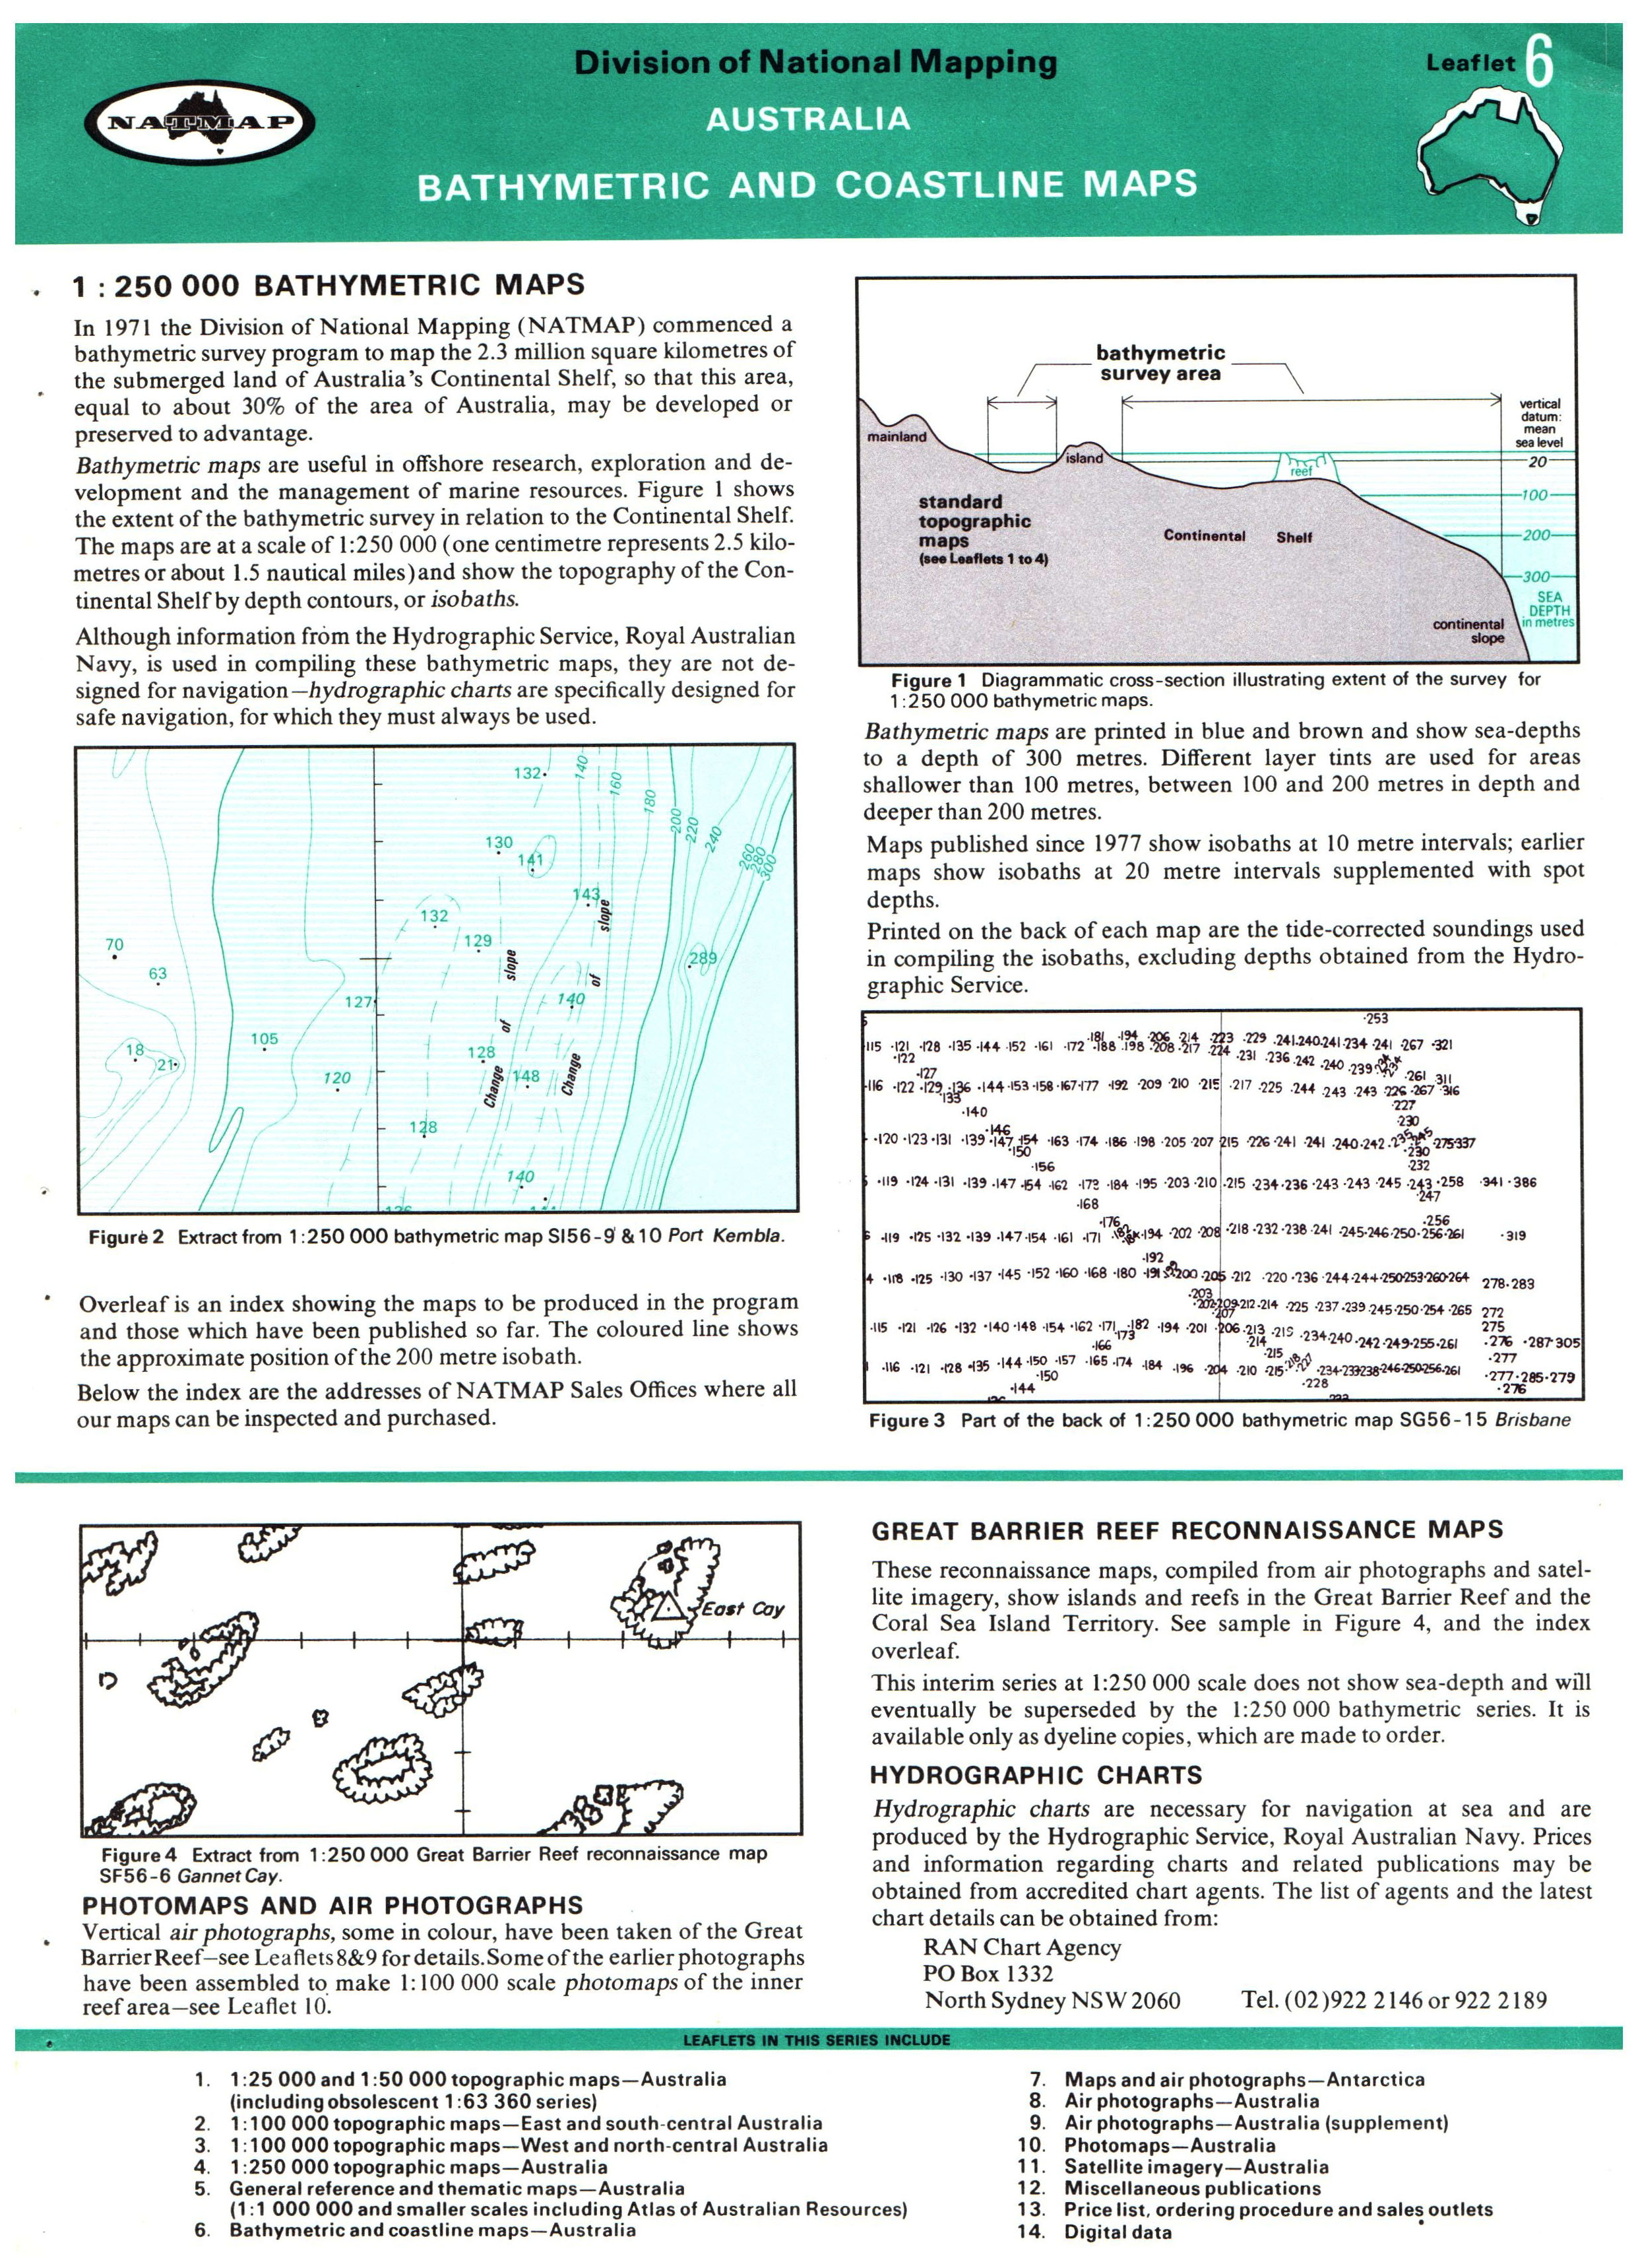
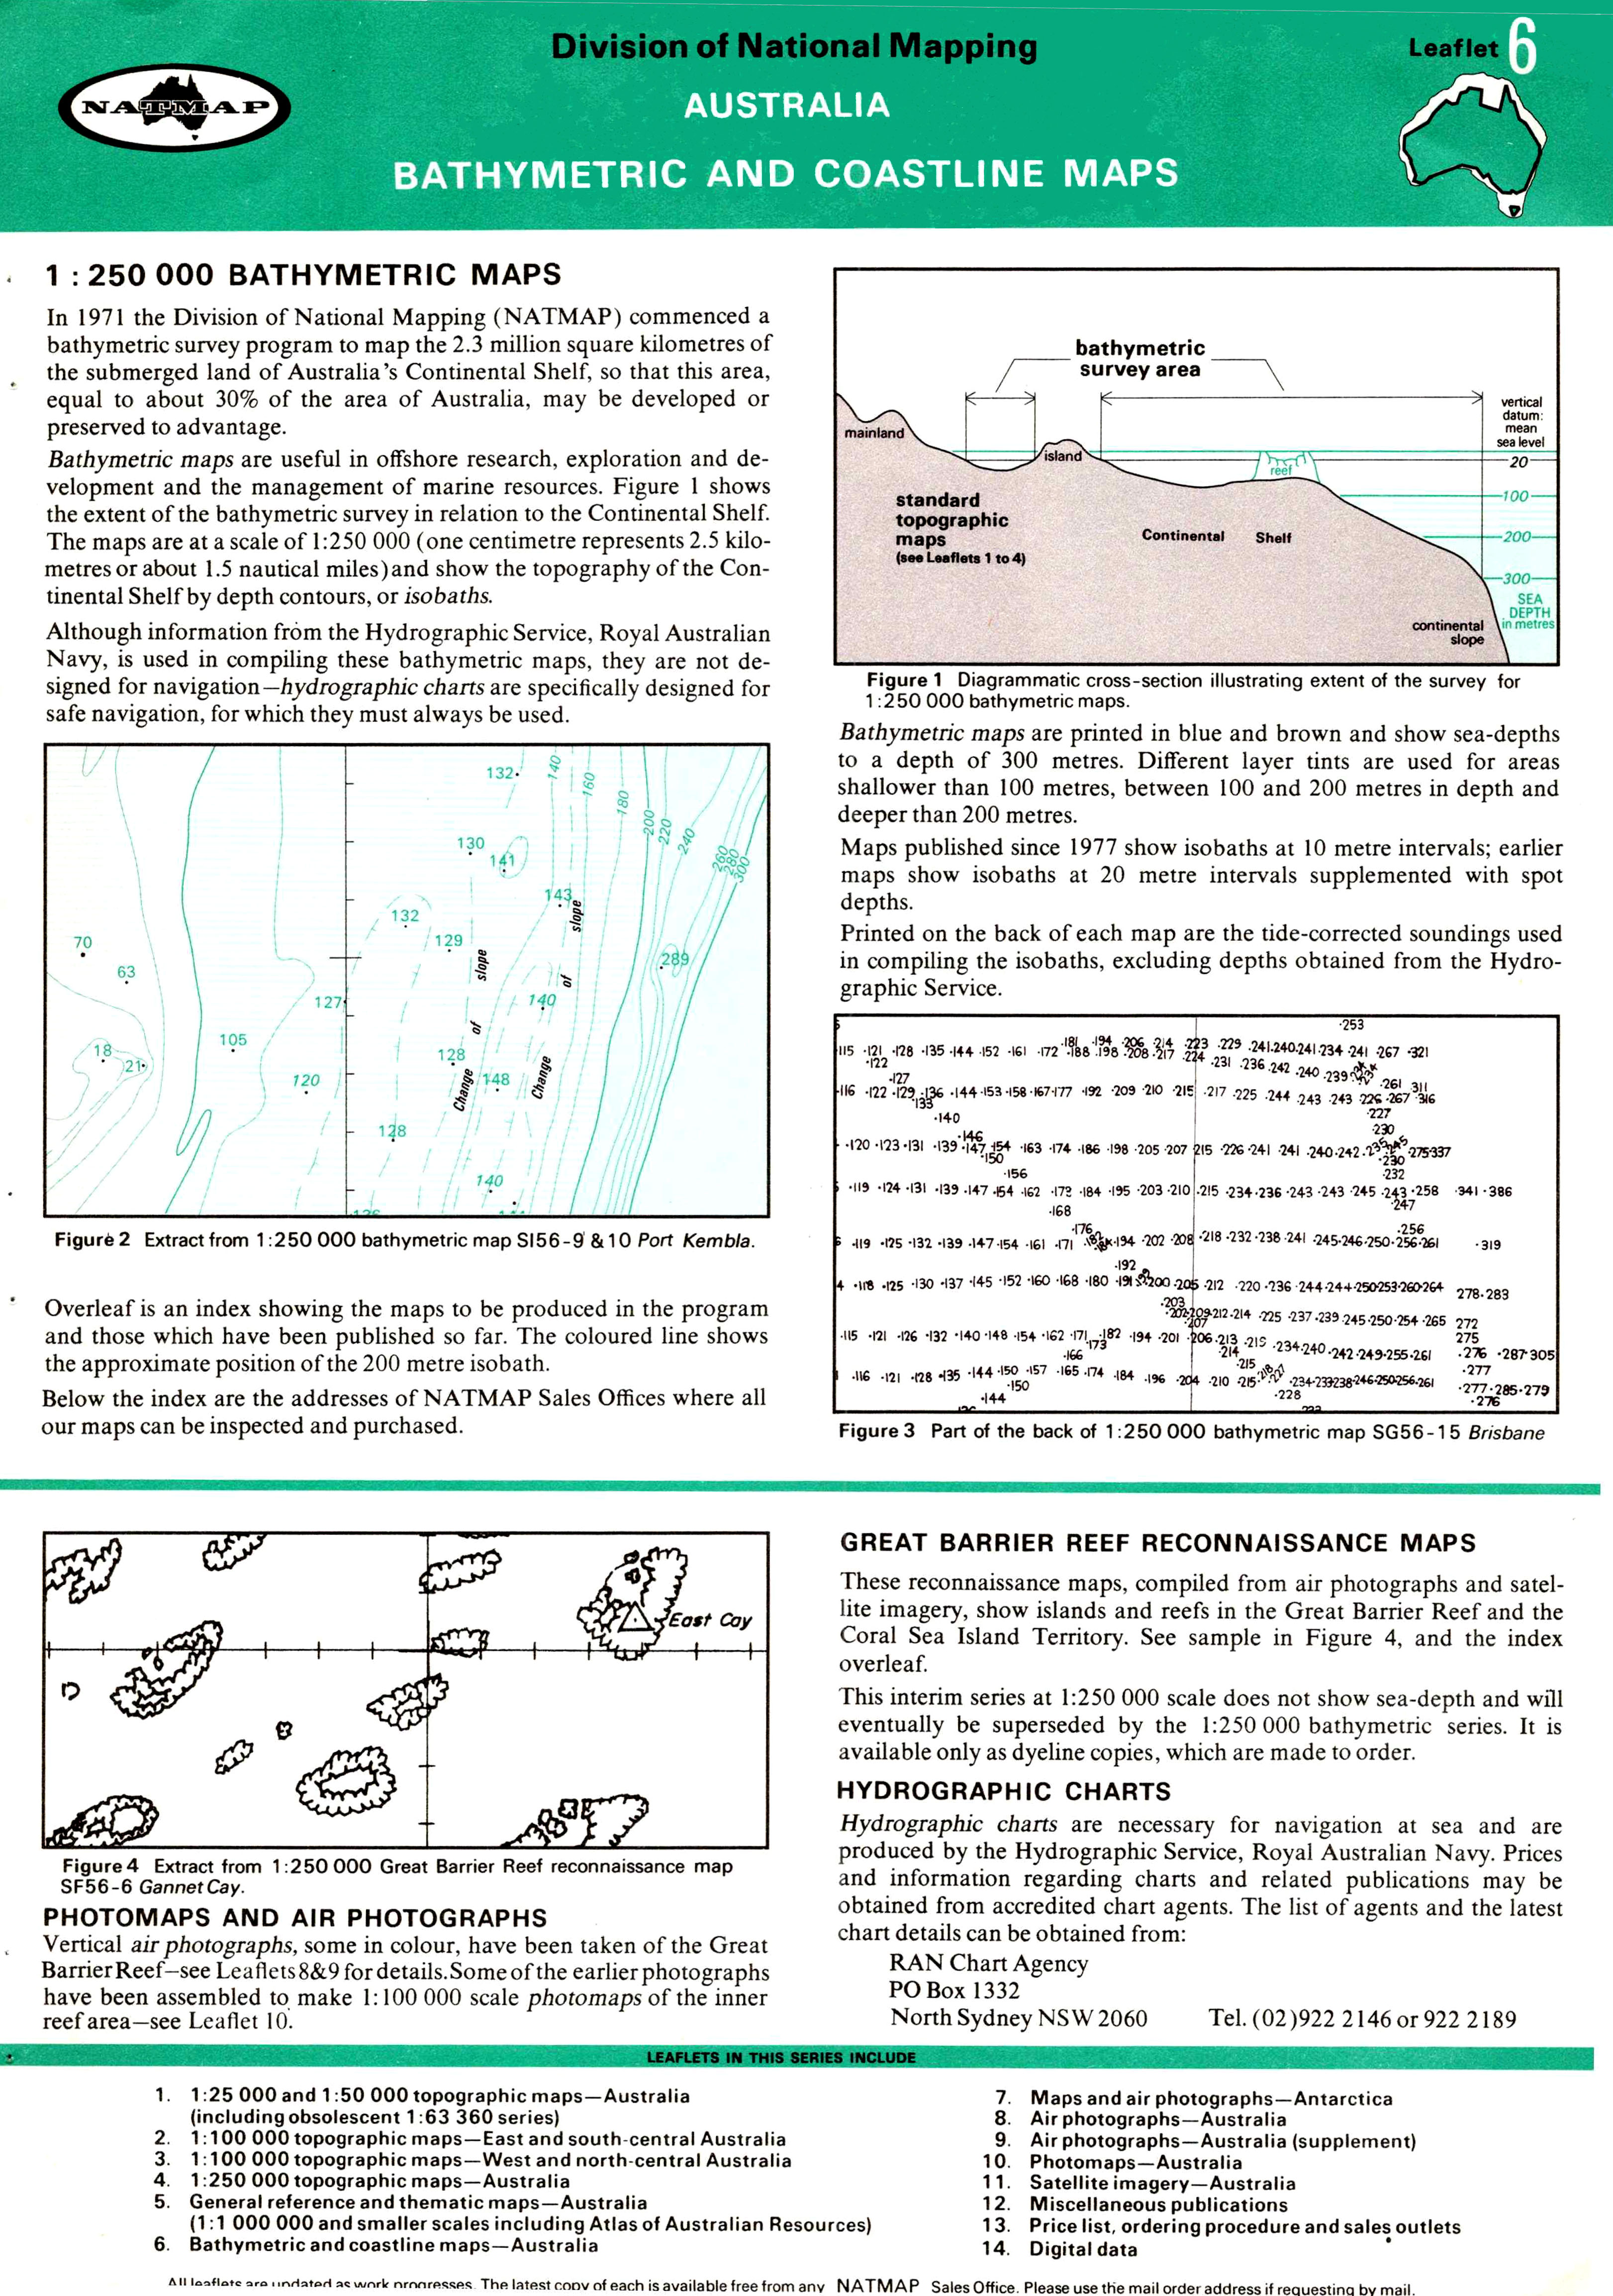
exploitation adequately controlled. Bathymetry is the measurement of the depth of large bodies of
water. In a surveying sense, bathymetry is not only measuring the depth at a
location but also fixing the position of that location. Bathymetric maps then portray these positions and depths as
contours of the sea floor or isobaths along with features such as islands,
reefs and cays which break the surface of the sea. For this reason printing
colours are restricted to brown for the land and blue with layer tints for the
offshore elements. A scale of 1:250,000 was adopted to maintain continuity with
the similar land-based topographic series. The isobath interval originally
adopted was 20 metres but from 1977 this was reduced to 10 metres. Depth
soundings and related positions were obtained from inshore depths of 20 metres
to depths of 300 metres on the outer edge of the Continental Shelf. Tide gauges
were operated at various locations to adjust the raw depth sounding data for
tidal movements. Bathymetric maps carried an important Caution Note to the effect, as
outlined above, that they were not produced for navigation purposes as, unlike
hydrographic charting, no effort was made to indicate possible hazards to
shipping or depict navigational information, nor were the depths related to the
type of datum used for hydrographic charts. Traditional hydrographic
charts do not depict the topographic relief of the area. They are designed to
portray matters relating to navigation and provide a plot sheet on which the
navigator can plan his route and plot his progress. Hydrographic surveys place emphasis on examining an area to ensure
that no reefs, shoals or pinnacles exist which may constitute a hazard to
shipping or, where these do exist, to show their relationship to landmarks or
navigation aids. The vertical datum to which depths are reduced is usually
related to the level of the lowest tide expected in the area. In open waters,
deeper than the draught of vessels likely to sail there, only a general
indication of water depth is usually shown. As stated above, the bathymetric maps maintained continuity with
the topographic series. Thus the Universal Transverse Mercator projection was
its basis and the specifications were those of the Australian Map Grid. Some
280 map sheets are believed to have been published generally in the 1½º
longitude by 1º latitude format. A few sheets were expanded east or west to
save the effort in publishing a sheet with only a small amount of information
on it. At least thirteen coastal sheets were published in the combined format
showing both topographic and bathymetric information. The
Bathymetric and Coastline Maps data sheet is available here. The
Bathymetric Map Coverage Index is available here (it is the latest available). A sample of a bathymetric map is available via this link. A sample of a composite topographic/bathymetric map is available via this link, and here is the reverse side of the composite map showing the individual sea-floor depths. National Topographic Map
Series (NTMS) at 1:100,000 scale
National
Topographic Map Series (NTMS) at 1:250,000 scale
1:250,000
Scale Map Series Gazetteer
Master
Names File
Topographic
Map Reading Guides
National Bathymetric Map
Series (NBMS) at 1:250,000 scale
Thematic
Mapping
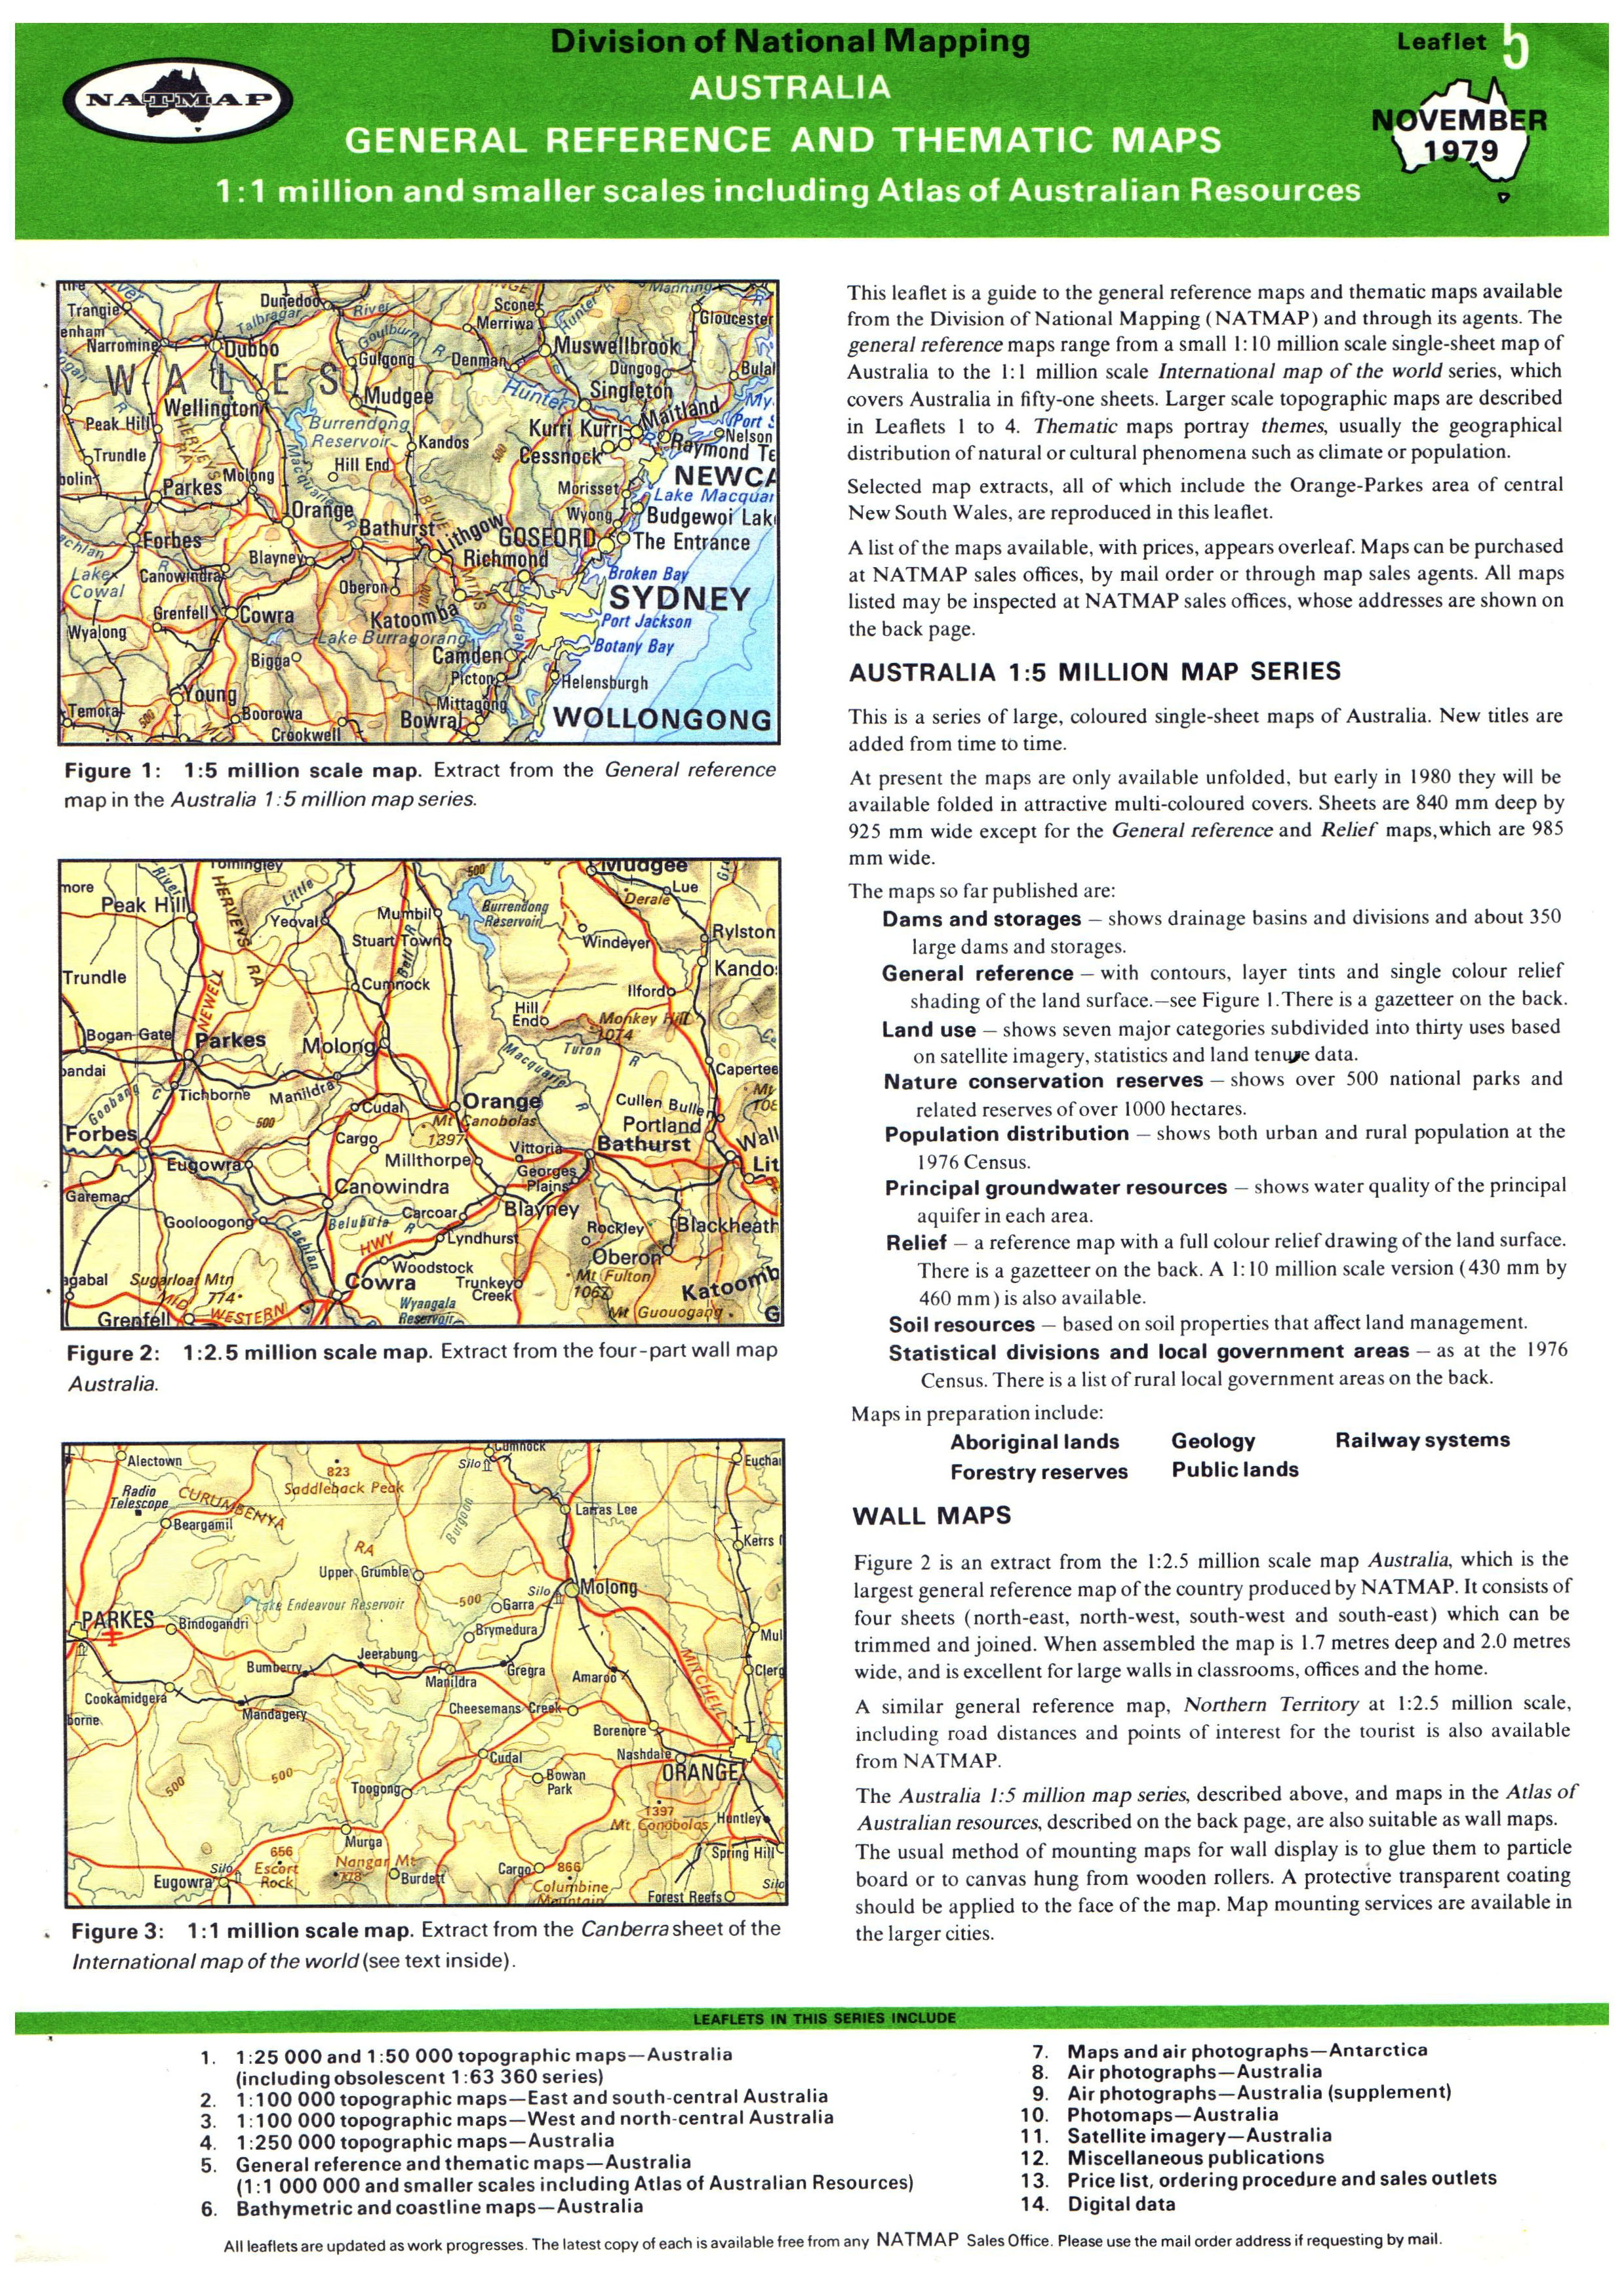
A thematic map reflects a particular theme, for example natural, political, cultural or agricultural features of an area. Symbols, pictures and colours are used to represent whatever is being mapped.
The data is generally gathered and plotted on larger scale maps before being generalised for portrayal in the thematic map. In such a process small regions of detail may be excluded as being irrelevant at the map scale being produced.
After1972, when Australia started to archive data from earth orbiting satellites (first Landsat then SPOT etc) these data showed themes (land use, vegetation, urban boundaries, landforms etc) suitable for thematic mapping. The satellite data was more timely and accurate and thus became integrated into Nat Maps thematic mapping program where possible.
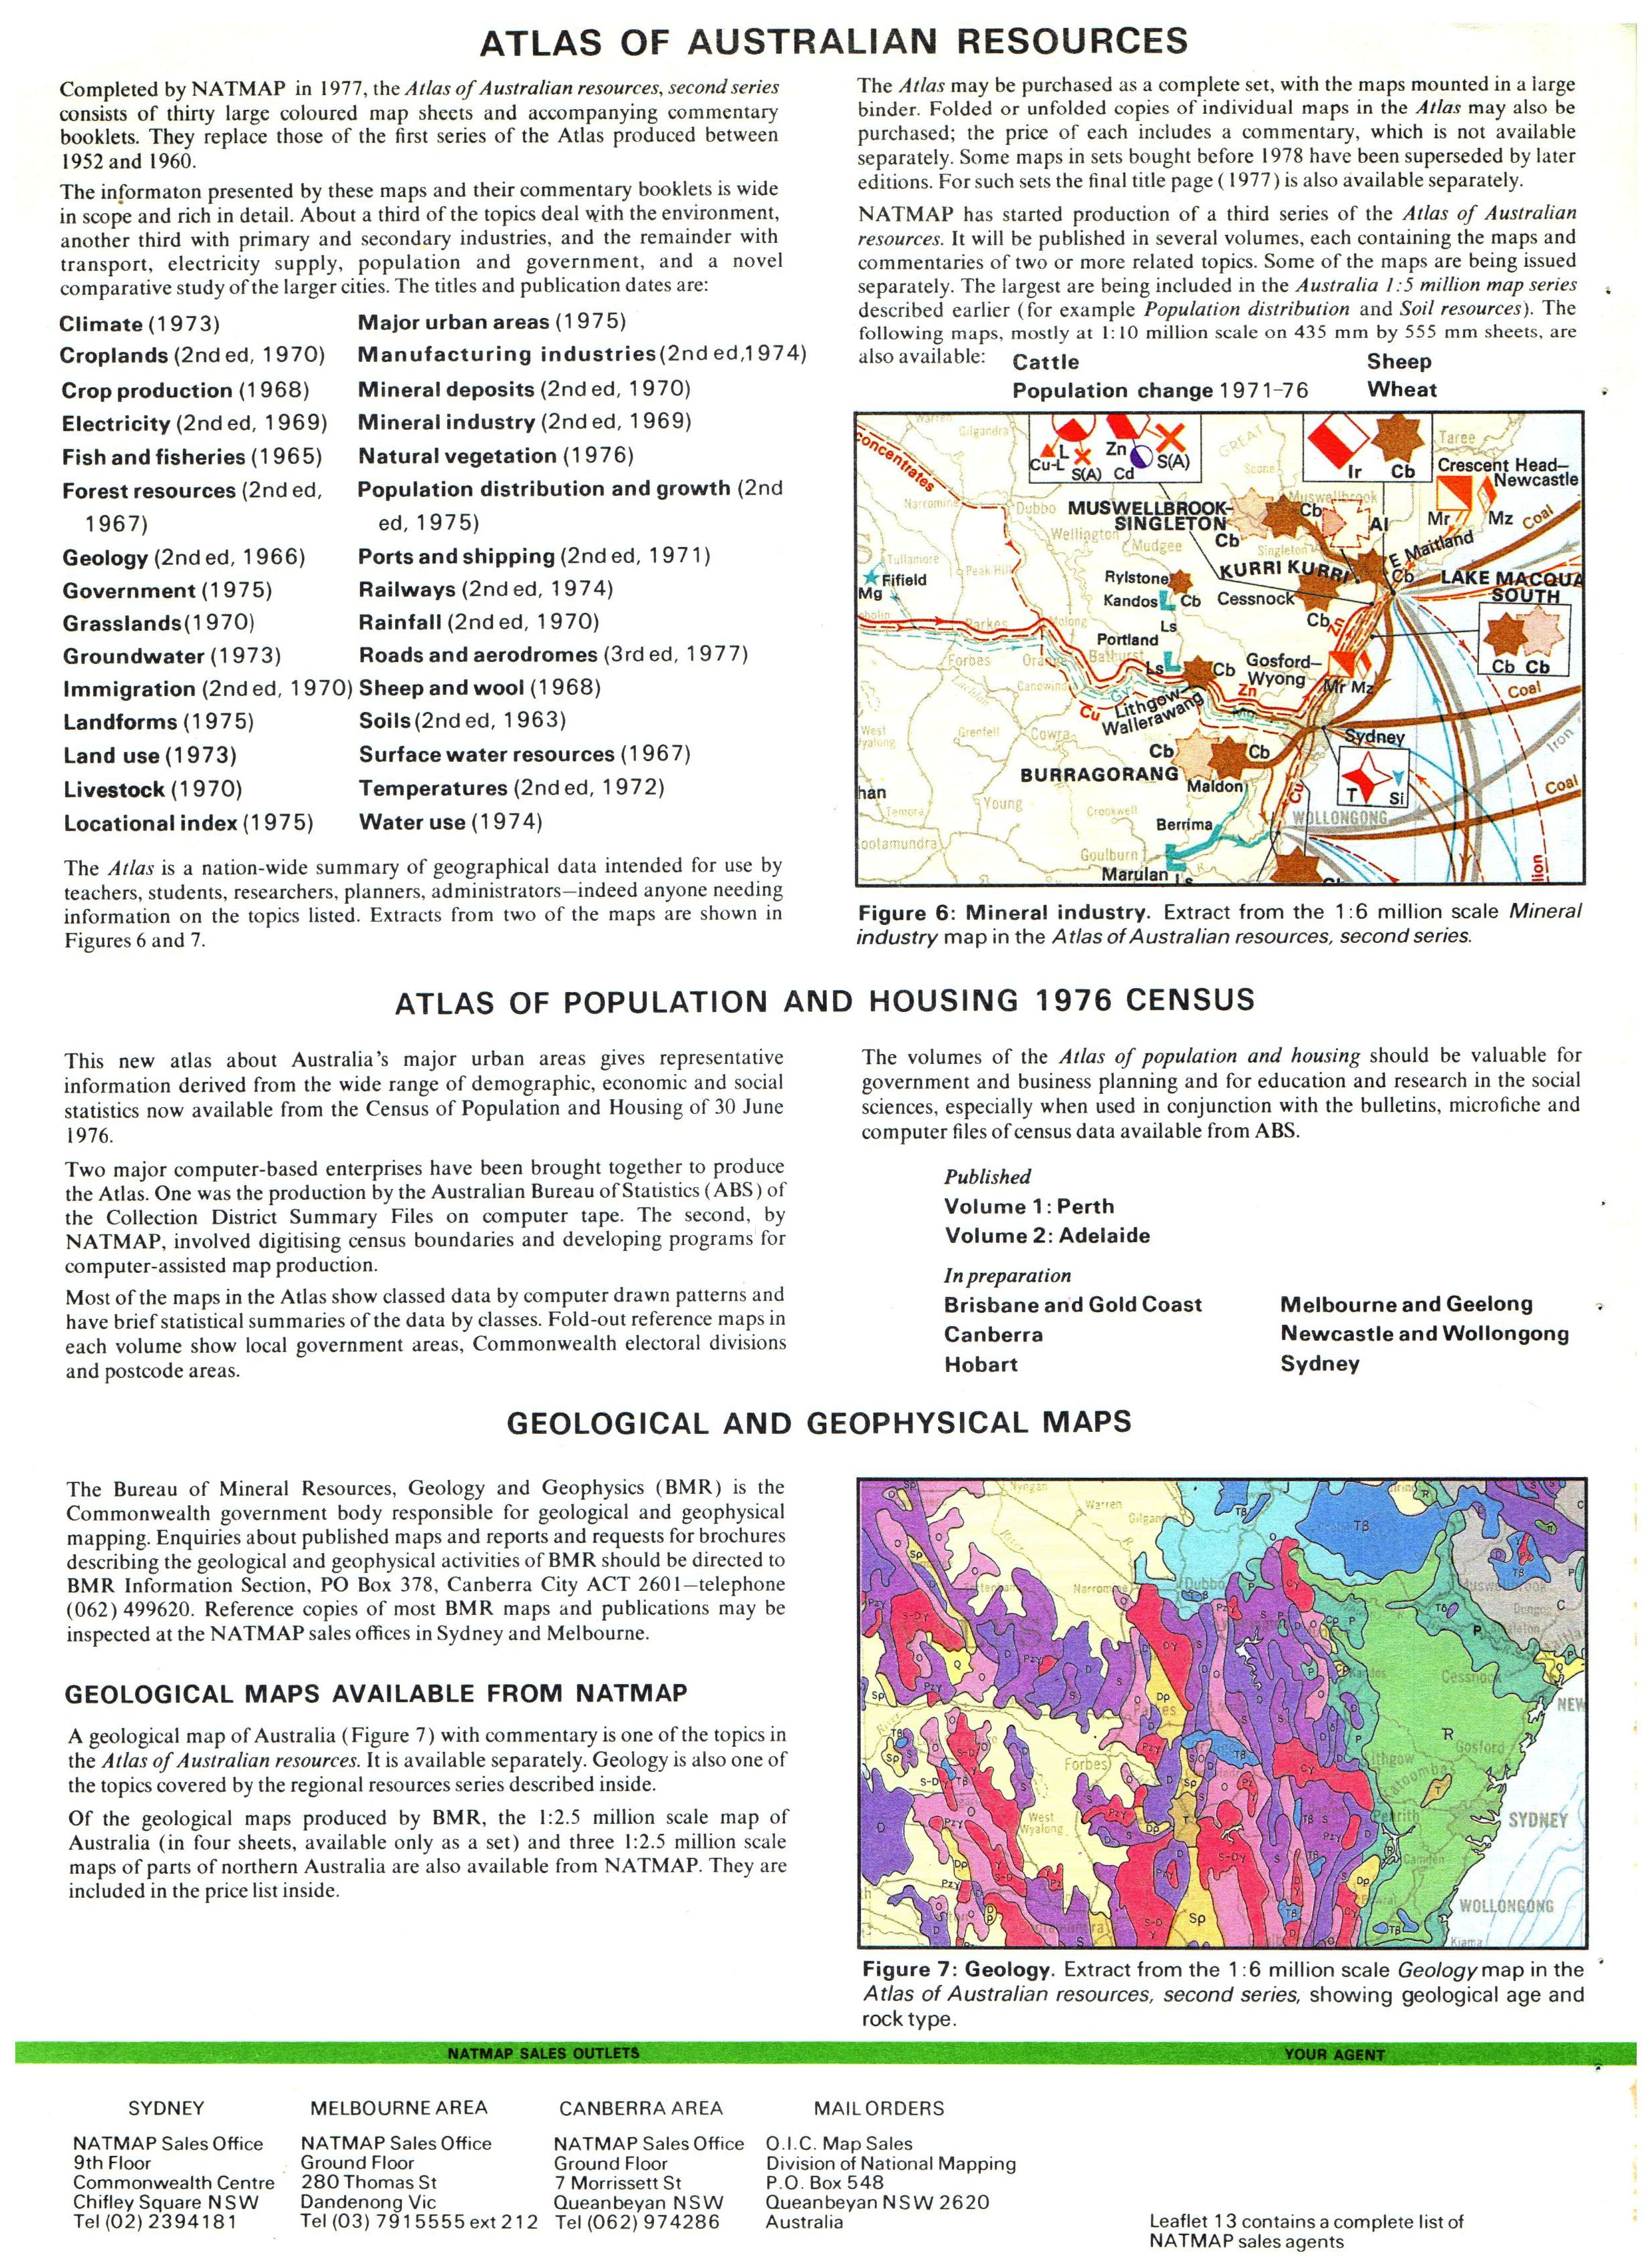
Atlas of Australian Resources
This atlas was conceived soon after World War II to provide maps and accompanying commentaries to describe the locations and characteristics of Australias natural resources. Impetus for the atlas was from a national development and economic planning perspective.
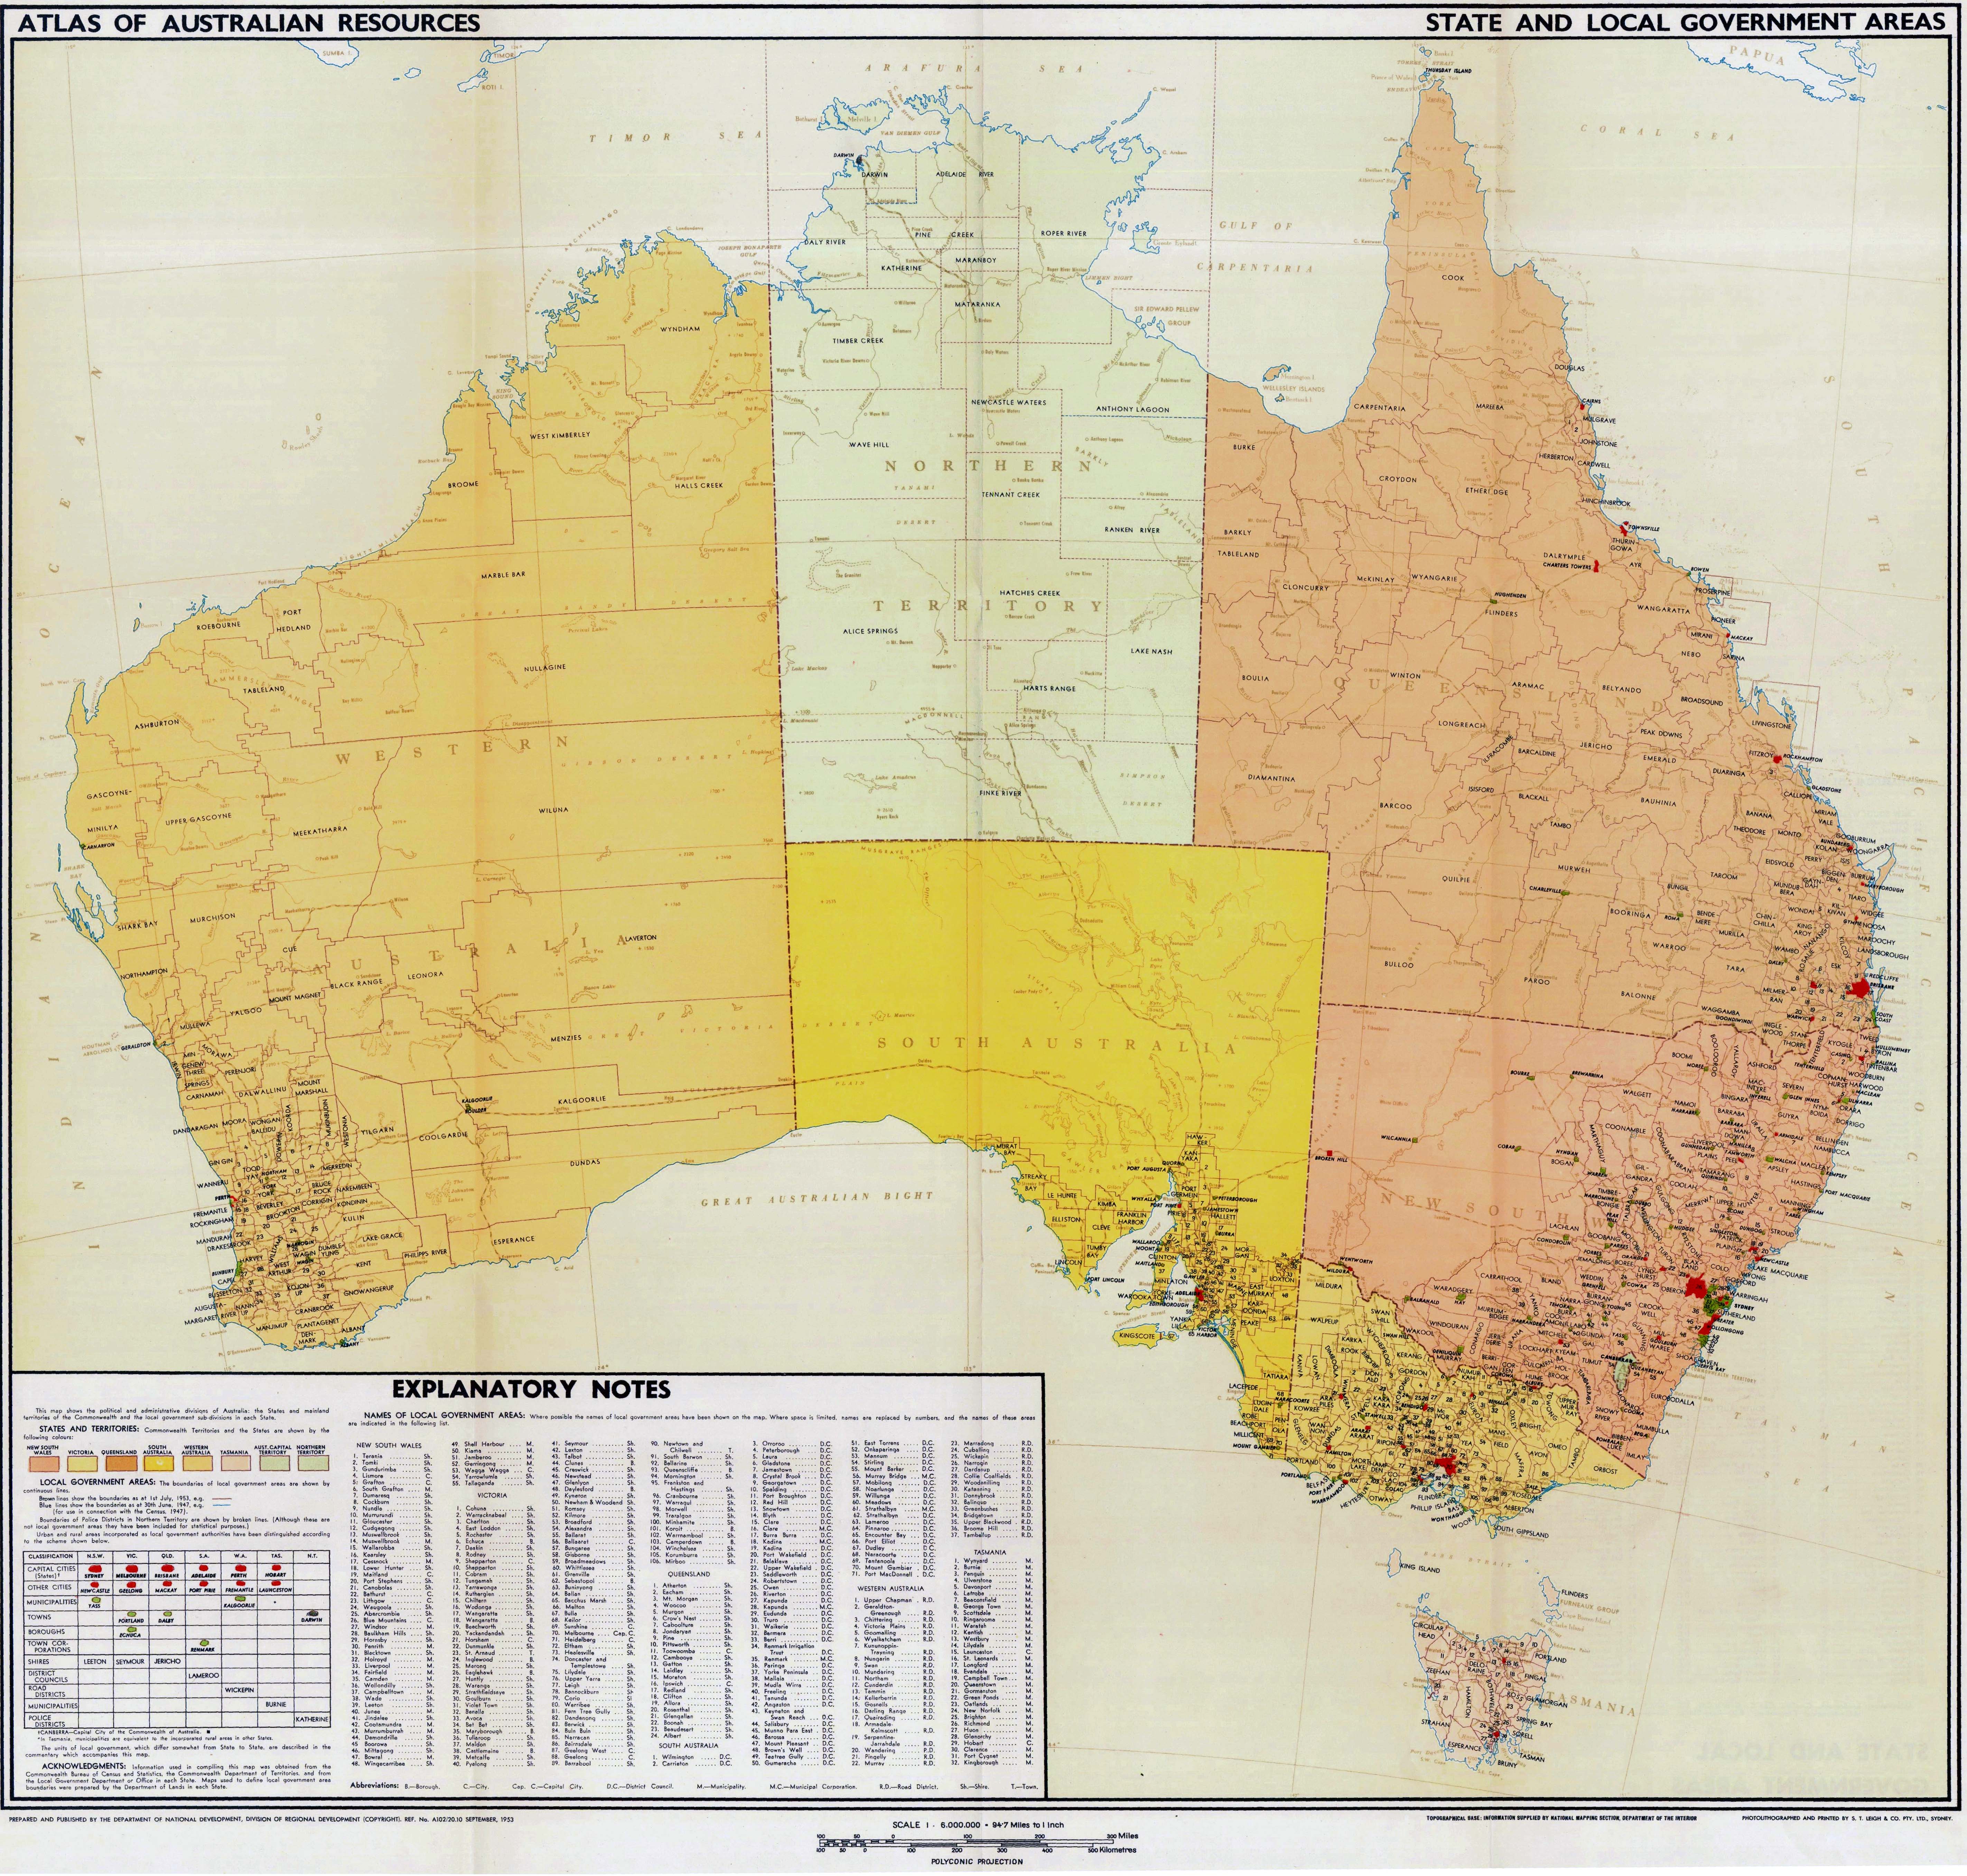
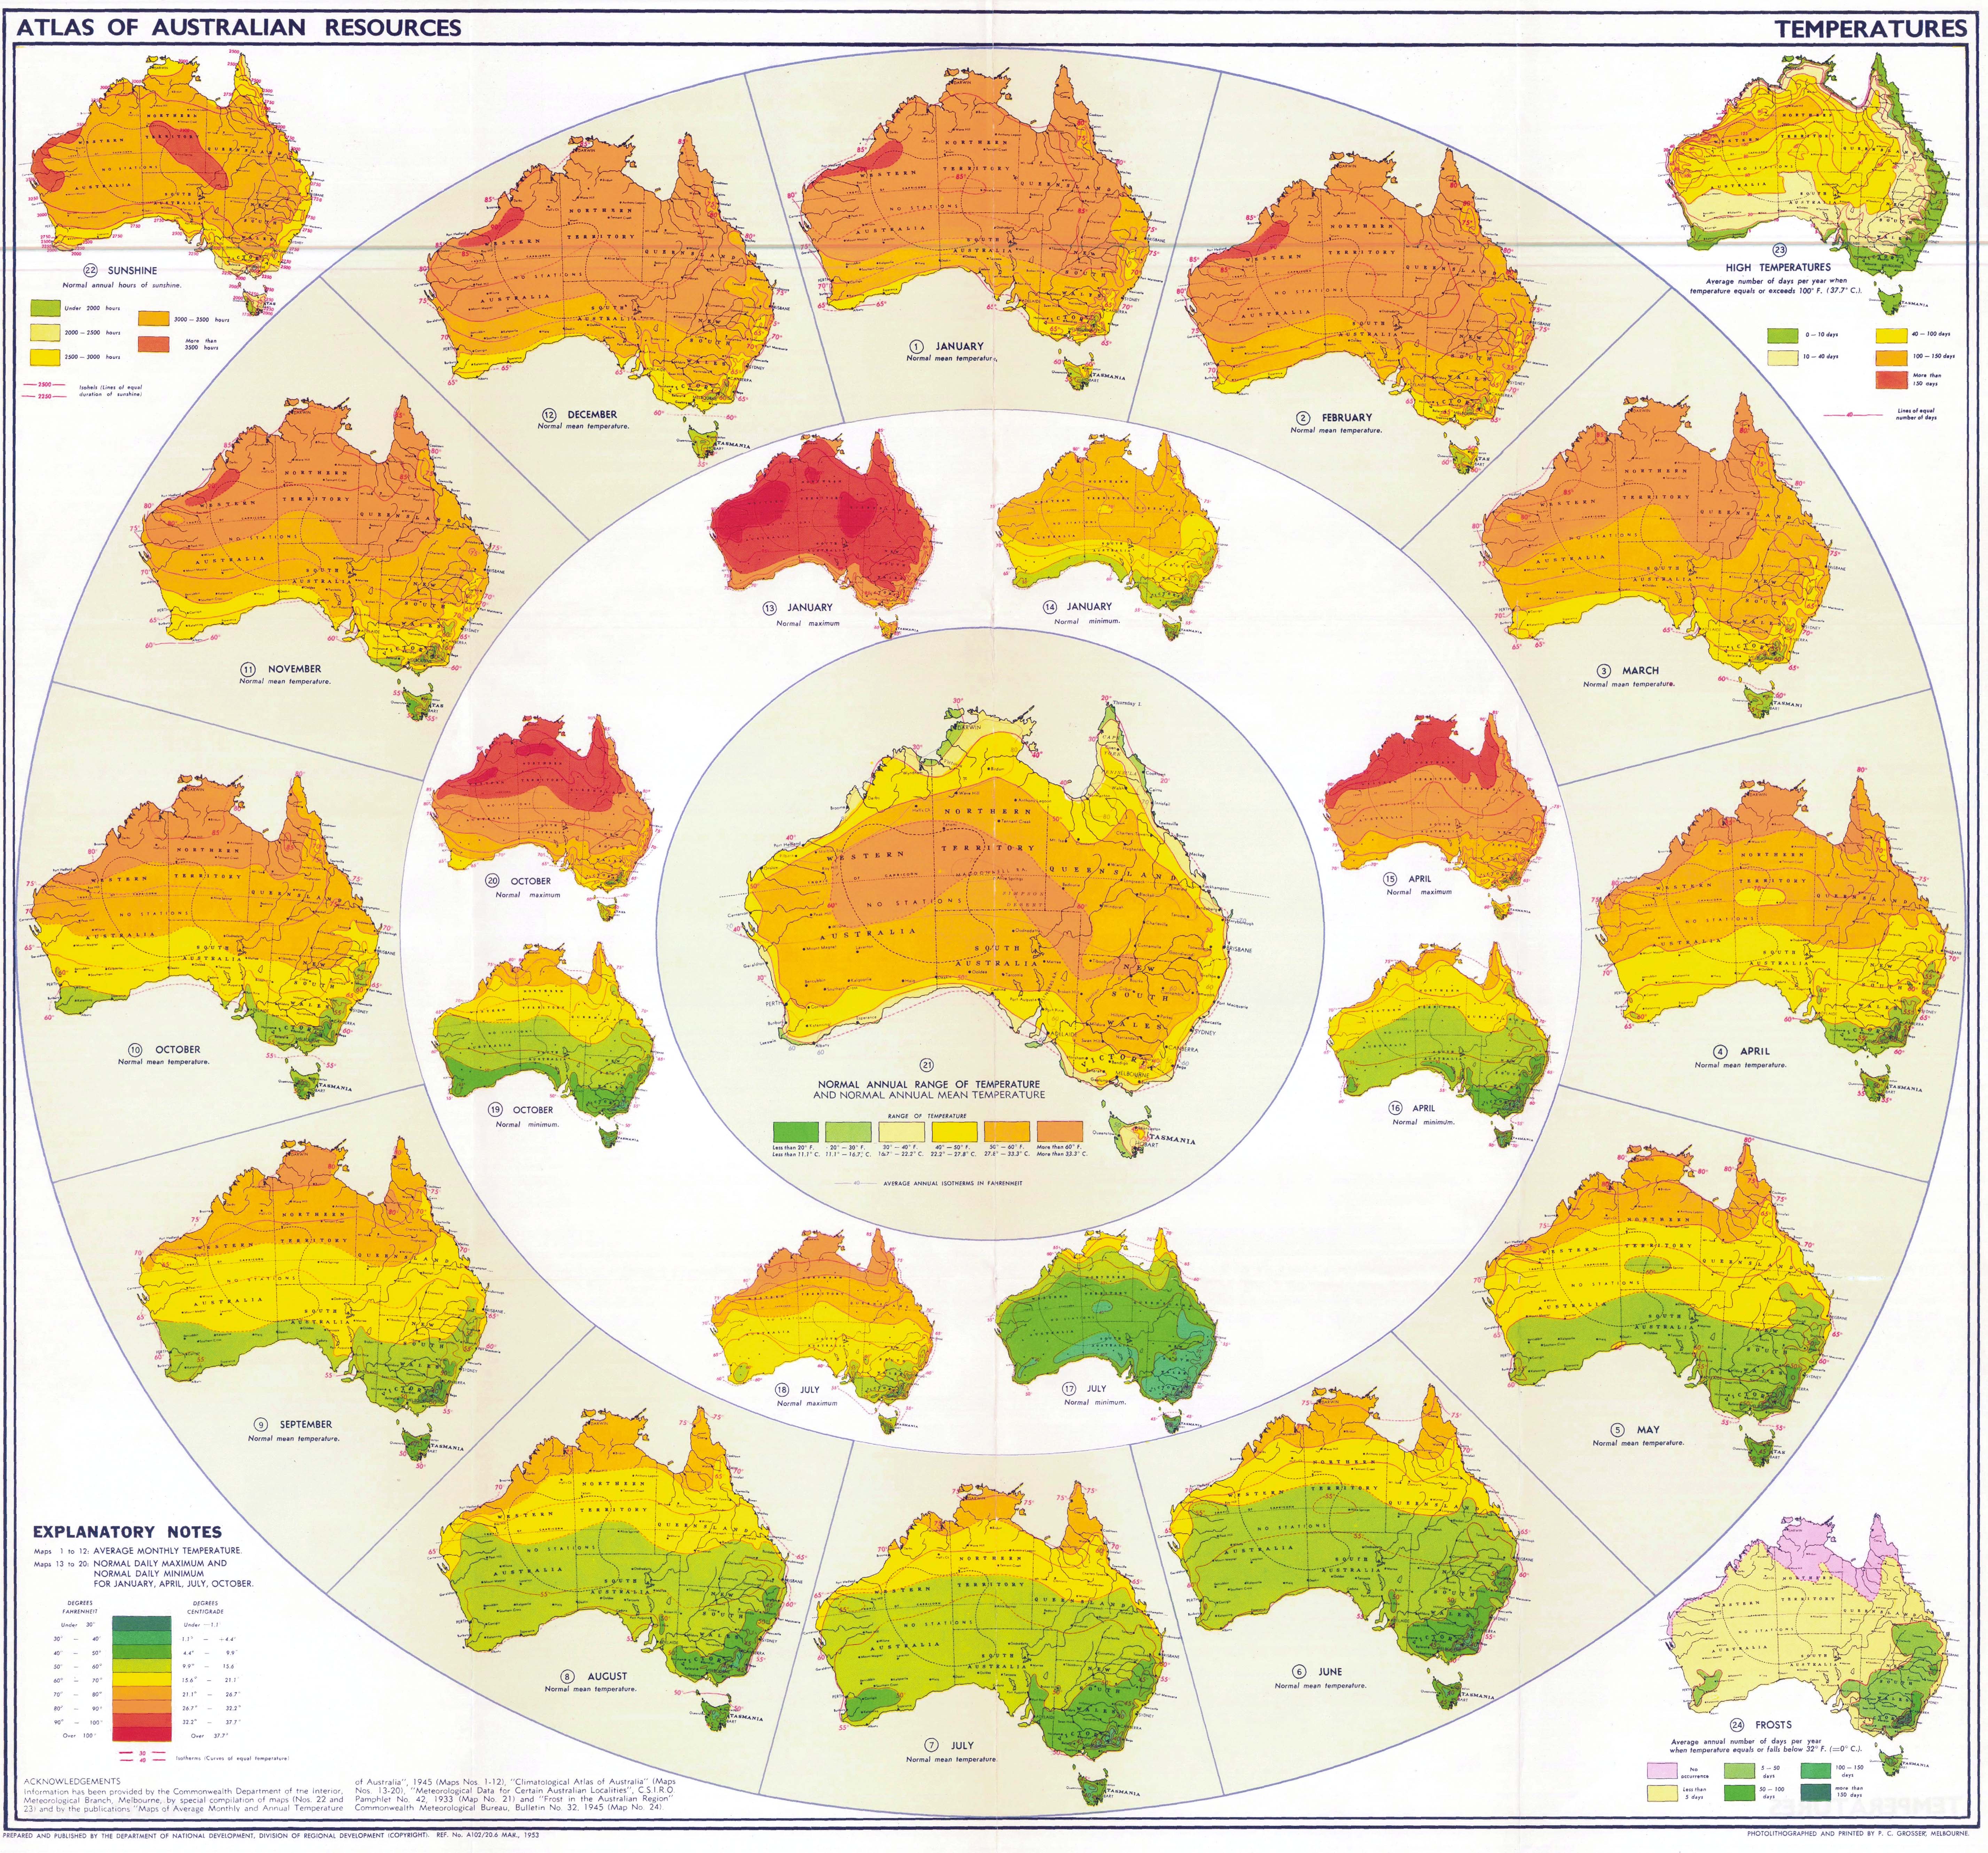
The atlas went into three editions (or series). The first edition was published between 1953 and 1960 and was planned to cover 42 separate natural resource topics, including: rainfall; temperatures; climate regions; underground water resources; mineral deposits; dominant land use; agricultural production; distribution of stock; croplands; state and local government areas; population density and distribution; population increase and decrease; and major development projects.
Maps for the various topics were mostly produced at a scale of 1:6,000,000 (view a sample via this link) and were available as separate sheets unfolded, folded or linen-strip mounted. For some topics there were up to four separate maps. The accompanying commentary for each map topic was available as a separate booklet; typically of 8-10 pages in small format. Linen covered hard board folders were available to contain sets of the separate commentaries.
The first edition (or series 1) of the Atlas of Australian Resources was edited by Dr Konrad Frenzel (1902-1992) from the later Federal Republic of Germany. It was prepared by the Department of National Development with cartography and base mapping initially undertaken by the Department of the Interior in which the National Mapping Office was located until 1956. The first edition was published by Angus & Robertson Limited, Sydney.
Further historical sample maps from Volumes 1 & 2 :
State and Local Government Areas 1953;
Temperatures 1953;
Roads and Aerodromes 1953;
Underground Water 1953;
Physical Features 1954;
Railways 1974.
The second edition (or Second Series as it became known) of the Atlas of Australian Resources was published between 1962 and 1977 and comprised thirty coloured map sheets of 720mm by 750mm format covering separate topics together with accompanying commentary booklets of 240mm by 175mm format. Topics in the Second Series were: landforms; geology; mineral deposits; climate; rainfall; temperatures; surface water resources; groundwater; water use; soils; natural vegetation; land use; croplands; crop production; grasslands; livestock; sheep and wool; forest resources; fish and fisheries; mineral industry; electricity; manufacturing industry; population distribution and growth; immigration; railways; roads and aerodromes; ports and shipping; government; major urban areas and a location index. As with the first edition, some topics had more than one map. The Second Series could be purchased as separate maps (with commentaries) or as binder set or as a boxed set
Volumes in the Atlas of Australian Resources Third Series were released progressively from 1980. This series was initially planned to be released as 10 separate bound volumes containing maps and commentaries sometimes on two or more related topics. Each volume was presented in a large portrait format (approximately 305mm by 435mm) and contained maps at various scales including 1:500,000; 1:5,000,000; 1:10,000,000 and 1:40,000,000. The various volumes contained diagrams, statistical tables and colour images as well as maps with the larger scale maps being folded inside the rear covers. The volumes ranged in length from 23 to 64 pages and eventually six separate volumes were released as follows :
Volume 1 Soils and Land Use (1980)
Volume 2 Population (1980)
Volume 3 Agriculture (1982)
Volume 4 Climate (1986)
Volume 5 Geology and Minerals (1988)
Volume 6 Vegetation (1990).
Volumes 1 to 3 in the Third Series of the Atlas of Australian Resources were edited by Trevor Plumb and Volumes 4-6 were edited by Geoff Parkinson; both of Nat Maps Geographic Branch.
Census
Mapping
A range of maps (view a sample via this link) were produced pre and post-Census as required by the Australian Bureau of Statistics in connection with the national population census that was generally conducted on a five-yearly basis. Some are listed above others included large scale maps of census collection districts that aided the planning and carrying out of the distribution and collection of census forms. Census collection districts are the basic unit for the processing of census data and typically average around 220 dwellings in urban area; there are usually over 35,000 such districts for each census.
Atlas of Population and Housing
After the 1971 census the Australian Bureau of Statistics made available for the first time computer tapes containing a wealth of information about each census collection district. The massive amount of data available made analysis, comprehension and the drawing of inferences a formidable task even for large organisations with considerable computer capacity and the necessary skilled staff. Thus for the 1976 census data, Nat Map and the Australian Bureau of Statistics worked together to produce a 7-Volume Atlas of Population and Housing that covered the 11 major urban areas of Australia that had populations of over 100,000 people. Some 65 percent of the nations then 13.9 million people were concentrated in these 11 areas.
The 1976 census Atlas was released between 1979 and 1981 as follows :
Volume 1-Perth
Volume 2-Adelaide
Volume 3-Brisbane and Gold Coast
Volume 4-Newcastle and Wollongong
Volume 5-Canberra and Hobart
Volume 6-Sydney
Volume 7-Melbourne.
Each volume was spiral bound in 300mm by 420mm format and typically contained 20 to 30 medium scale maps that were computer drawn for each city to show the characteristics of their populations and dwellings, for example demographic, ethnic, socio-economic and housing structures.
For the 1981 census Nat Map again worked in association with the Australian Bureau of Statistics to produce a further series of the Atlas of Population and Housing. Nat Map gathered a team of staff geographers, cartographers and computer experts to prepare the maps for a 7-Volume series that covered the capital cities in which 58 percent of Australias then population was concentrated.
Planning for this series commenced in 1981 with a view to achieving a more timely release of the Atlas which was completed by late 1983 as follows :
Volume 1-Canberra
Volume 2-Sydney
Volume 3-Melbourne
Volume 4-Brisbane
Volume 5-Adelaide
Volume 6-Perth
Volume 7-Hobart.
However, volume numbers were not shown on the covers of the various volumes of the Atlas. Instead each volume went under the banner of a social atlas for the particular capital city, for example: Canberra a social atlas 1981 Census.
Again each volume was spiral bound in 300mm by 420mm format and contained a number of medium scale maps that were computer drawn for each capital city to show the following characteristics: demography, ethnicity and socio-economic status as well as dwellings details and reference maps and tables.
For the 1981 Atlas, Dr Colin Adrian of the Australian National University convened in each capital city a member of the Urban Studies Group of the Institute of Australian Geographers to write commentaries on each map. These commentaries and other text were included in the Atlas.
For the 1986 and all following censuses, the Australian Bureau of Statistics has continued to release census of population and housing data under the banner of social atlases for the various capital cities.
Atlas
of the Australian People
Following the 1986 census, the then Australian Surveying and Land Information Group produced a set of small scale thematic maps that depicted the ethnic characteristics of Australias five largest urban areas. These maps were part of a joint project with the Department of Immigration, Local Government and Ethnic Affairs for the then Joint Commonwealth, State and Territory Australian Population and Immigration Research Program. The project was managed by the Population Research Section of the Department of Immigration, Local Government and Ethnic Affairs. Significant technical contributions were made by AUSLIGs Susie Salisbury and Murray de Plater.
The mapping part of the project was released in 1989 as a 5-Volume Atlas of the Australian People 1986 Census. With each volume carrying the name of the particular capital city, namely: Brisbane, Sydney, Melbourne, Adelaide and Perth. The format was spiral bound 300mm by 420mm. Each volume contained a series of maps at 1:150,000 scale that depicted: total population, total overseas born, birthplace, recent arrivals, second generation, poor English proficiency, languages other than English and religion together with a reference map.
No commentaries were provided with the maps. However, as part of the overall project Dr Graeme Hugo of Flinders University headed a research team that analysed data from the 1976, 1981 and 1986 censuses. The outcome of this work was eight separately published commentary reports at state and territory level and a national report that drew together aspects of the research work.
Australian
Small Scale Thematic Map Series (1:10,000,000 scale)
Maps in this series (view a sample via this link) depicted various themes that were often related to topics in the Atlas of Australian Resources. These themes included :
Coal Resources
Cattle
Climate of Capital Cities
Commonwealth Election Results
Croplands
Electricity
Energy Resources
Farm Types
General Reference
Grazing Density
Groundwater
Groundwater Use
Manufacturing Industries
Median Annual Rainfall
Monthly Temperatures Native Pastures Overseas Born Population Population Change Population Distribution and Major Urban Areas Sheep Sown Pastures and Fodder Crop Production by Value Surface Rock Types Surface Water Use Value of Agricultural Production Value of Mine Production Maps in this
category (view a sample via this link) included : Aboriginal Land and Population Forestry Reserves Public Lands Geology Dams and Storages Land and Seabed Relief Nature Conservation Reserves Population Distribution Statistical Divisions and Local Government Areas Election Results Census Information Maps of New
Guinea showing Vegetation, Forest Resources, generalised Geology, Population,
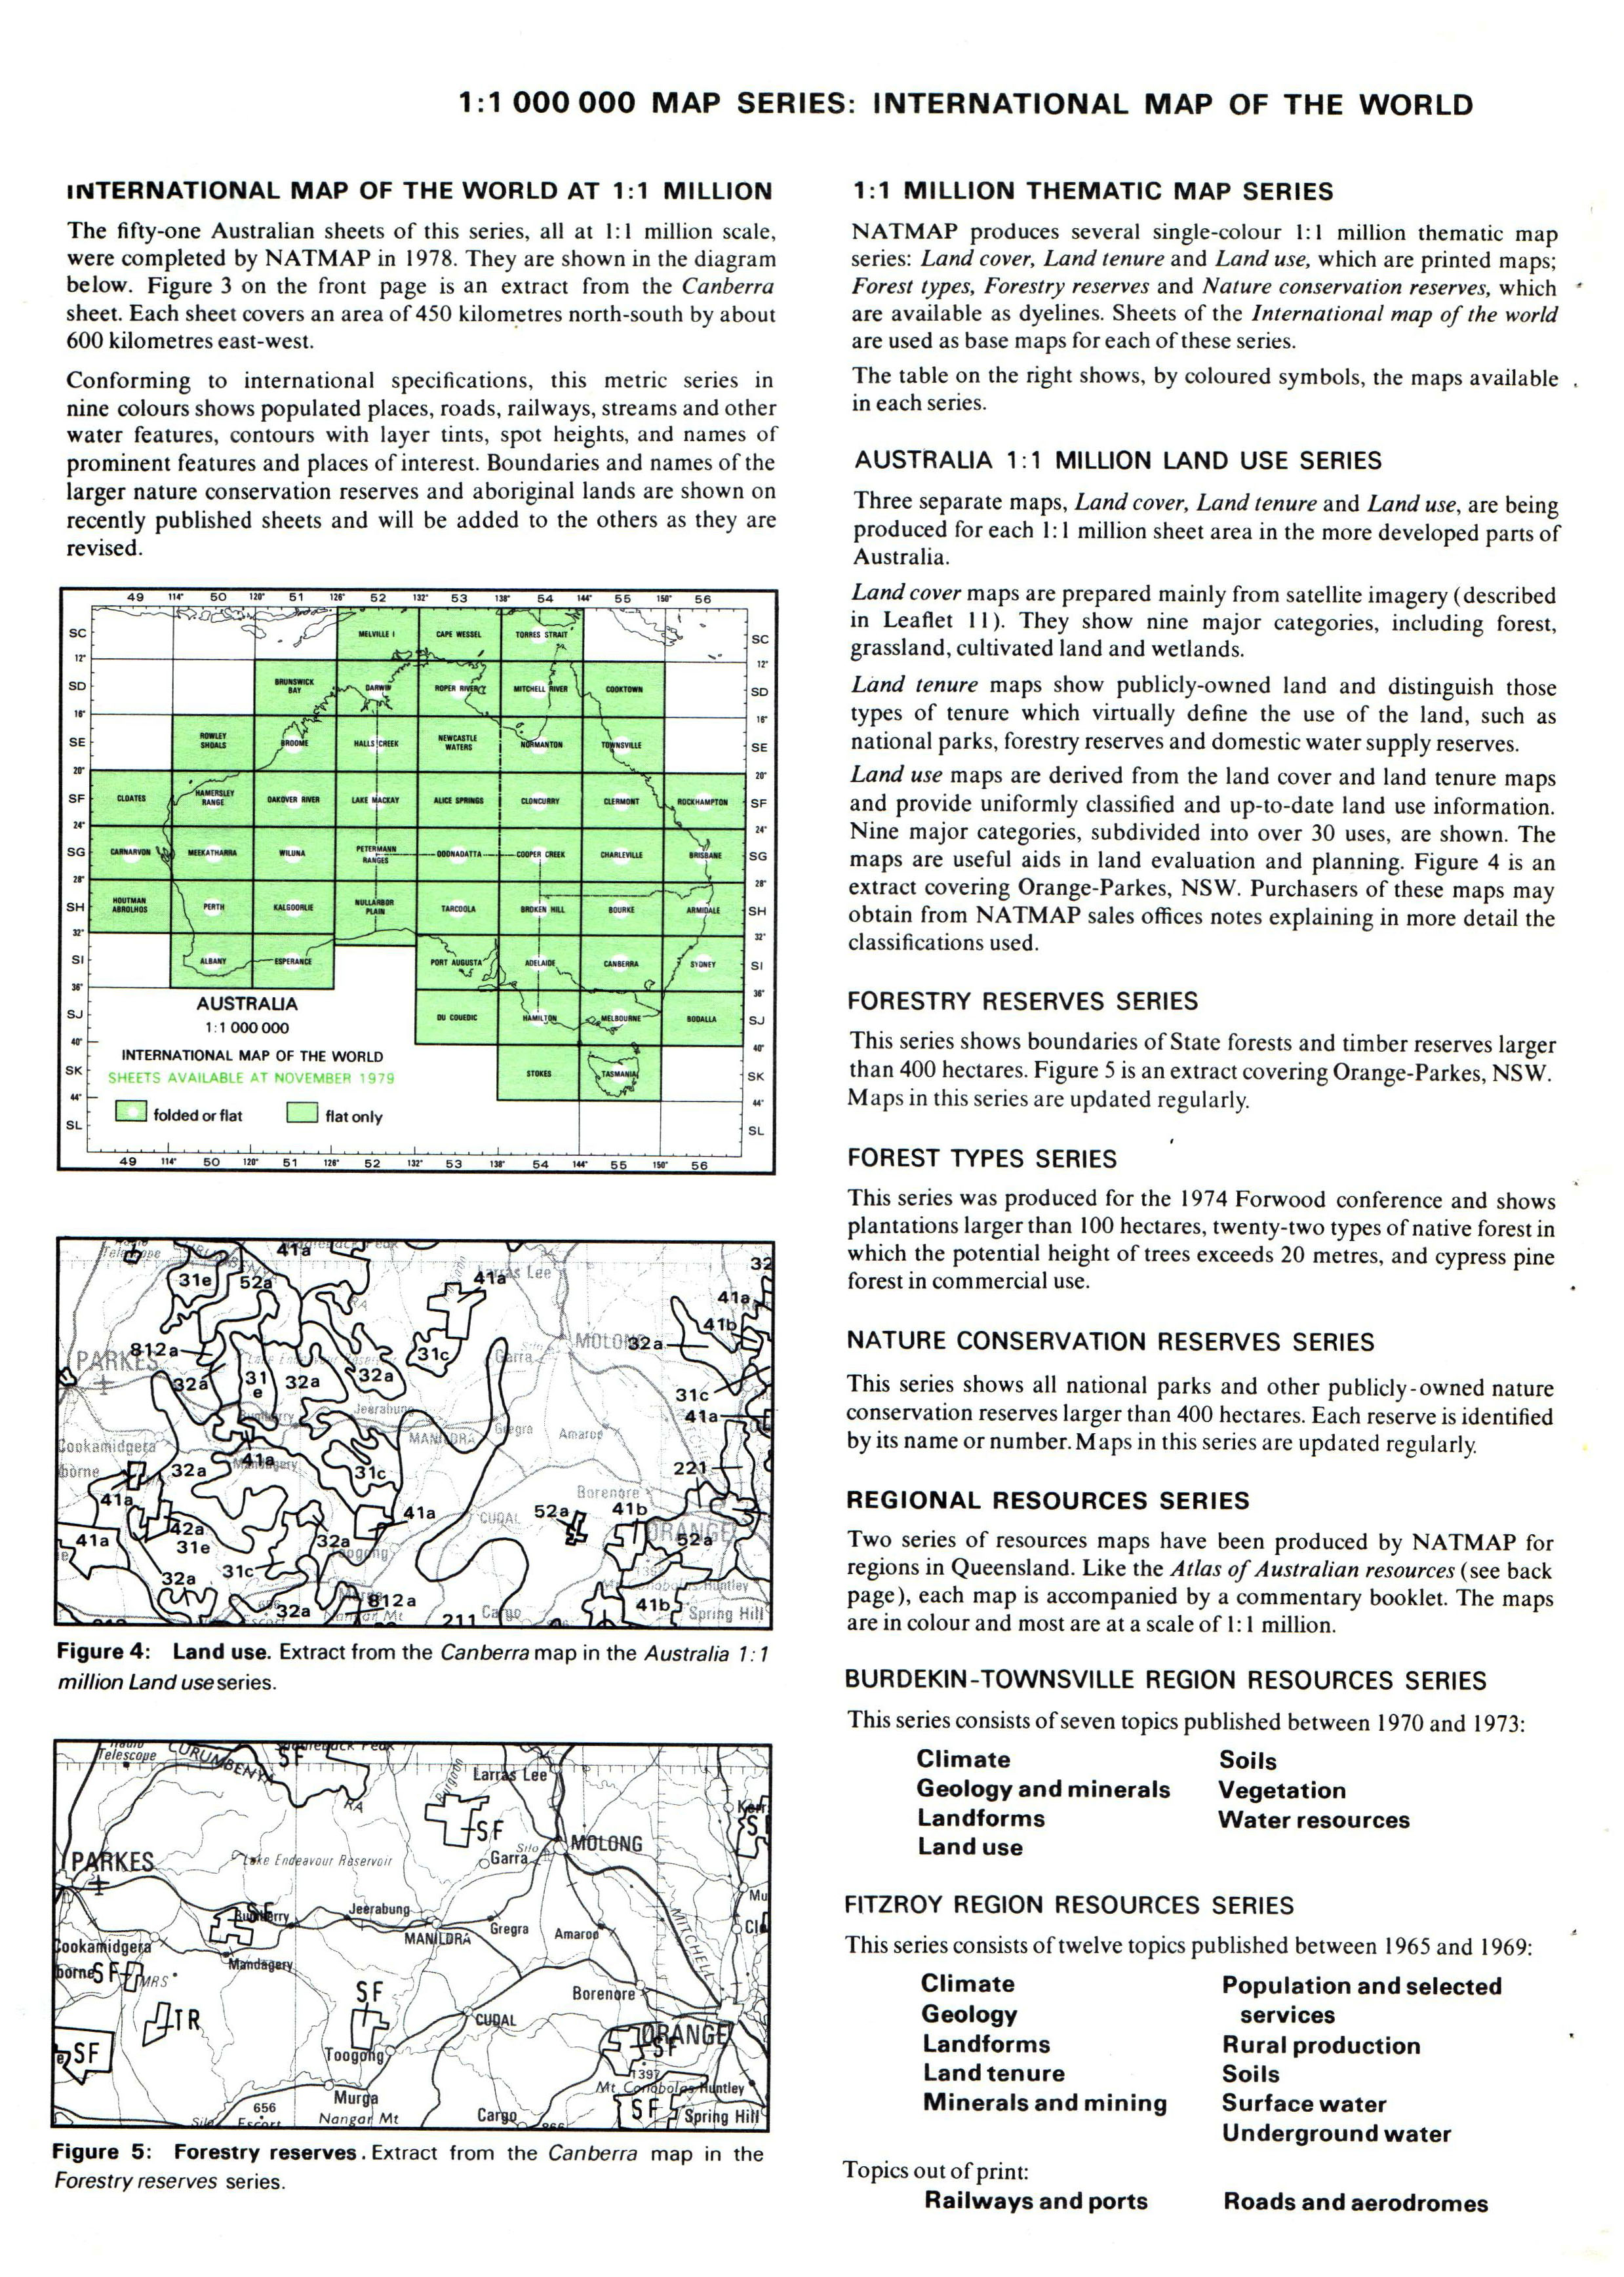
Transport and Rainfall. For selected
1:1,000,000 scale map sheet areas three single colour reconnaissance maps were
published. The maps were titled, Land Cover, Land Tenure and Land Use. Australian Capital Territory Northern Territory Australia Ocean Islands Various These
maps of Australia were suitable for inclusion in reports, school projects,
exhibitions etc and ranged from just the coastal outline of the continent to
coloured maps with topography and infrastructure (view a sample via this link). These maps were produced at varying scales including 1:10,000,000; 1:5,000,000; and 1:2,500,000. The last
mentioned map was provided as four separate sheets and up to the early 1980s
was also supplied as a wall map mounted on linen backing with top and bottom
wooden rollers. The specifications for
these maps were determined by the requesting agencies. Such maps were produced
for, among others : Australian Landsat Station: Satellite Coverage Path/Row map Australian
Nature Conservation Agency : various locations and scales Australian
National Parks and Wildlife Agency : various locations and scales Great
Barrier Reef Marine Park Authority : various scales Murray-Darling
Basin Commission : Murray-Darling Poster (view a sample via this link) Australian
Capital Territory Government Services : 1:100,000 scale satellite image map of
the ACT The
Asia Pacific Economic Cooperation Economies poster - a joint project with
Bakosurtanal (Indonesias Mapping Agency). Specialist Mapping of Commonwealth Territories for other Government Departments and Agencies. In
July 1985, Natmap began the production of what was then believed to be the
world's first national atlas for the blind, the Tactual Atlas of Australia. The
maps were derived largely from the Atlas of Australian Resources Third Series.
Byrne Goodrick, by then retired from Nat Map where he was an Assistant
Director, was an internationally acknowledged expert on tactual mapping. He worked
as a consultant with Nat Map staff cartographers and geographers. The Tactual
Atlas contained maps at varying scales, mainly 1:17,000, 000 and 1:31,000,000.
The format was 300mm by 420mm with two 280mm books of commentaries. In
1985, National Mapping released A National Specification for Tactual and Low Vision Town Maps under the
auspices of the National Mapping Council as NMC Special Publication 11. Byrne Goodricks A Map
User Guide to Reading Tactual and Low Vision Maps was published towards the end
of 1986. Also in 1986 National Mapping released a related publication Symbols
for Tactual and Low Vision Town Maps. Volume
1 of the Atlas contained world, regional and Australian general reference maps
and a comprehensive range of maps on Australia's physical environment as well
as commentaries and explanatory text in braille. Volume 2 contained maps and
commentaries on Australia's people and industries. Publication of the Atlas was
completed in 1988. Part of the Division of National Mappings role as a government
agency was to provide advice on relevant matters to various other commonwealth
government departments. In fulfilling this role, Nat Map provided advice on the
location of maritime boundaries and other related matters to the Department of
the Attorney-General and to the then Department of Foreign Affairs. Being an
island continent, Australia has sovereign rights (including fishery, mineral
and petroleum resource rights) over a vast area of ocean. Australia has
contiguous maritime boundaries with several other nations, namely: Papua New
Guinea, Indonesia, New Zealand, New Caledonia, Solomon Islands, Timor Leste and
France. Determining and agreeing maritime boundaries can involve complex diplomatic
and other inter-government negotiations as well as consideration of
international law and conventions such as the United Nations Convention on the
Law of the Sea. By way of example from the early 1970s Nat Map
senior executives Len Turner and later Con Veenstra provided advice on maritime
boundary matters during negotiations that led to the signing of the Torres
Strait Treaty by Australia and Papua New Guinea in 1978. Amongst other matters,
this treaty (which came into force in February 1985) set the international
maritime boundary between Australia and Papua New Guinea in the Torres Strait.
As well as the Australian and Papua New Guinea governments, treaty negotiations
also involved the Queensland government and representatives from the Torres
Strait Island communities. The boundaries determined under the treaty involved
a number of elements, including: A
series of maps has since been produced in consultation with the
Attorney-General's Department and the Department of Foreign Affairs and Trade
to illustrate Australia's maritime limits. The standard scale for this map
series was 1:1,500,000. The
maritime limits depicted on these maps were derived from the Australian
Maritime Boundaries (2006) digital data updated to include the result of the
2008 recommendations by the United Nations Commission on the Limits of the
Continental Shelf on Australia's submission for consideration of an extended continental
shelf. The data reflected the location of the coastline within the constraints
of available source material at the time of production. More information about Australia's marine jurisdiction may be accessed from Geoscience Australia's website at: http://www.ga.gov.au/scientific-topics/marine/jurisdiction In
addition to the Maritime Jurisdiction map series, a number of non-standard
special maps have been produced. These maps have been produced to illustrate
particular elements of the Australian maritime jurisdiction that did not fit
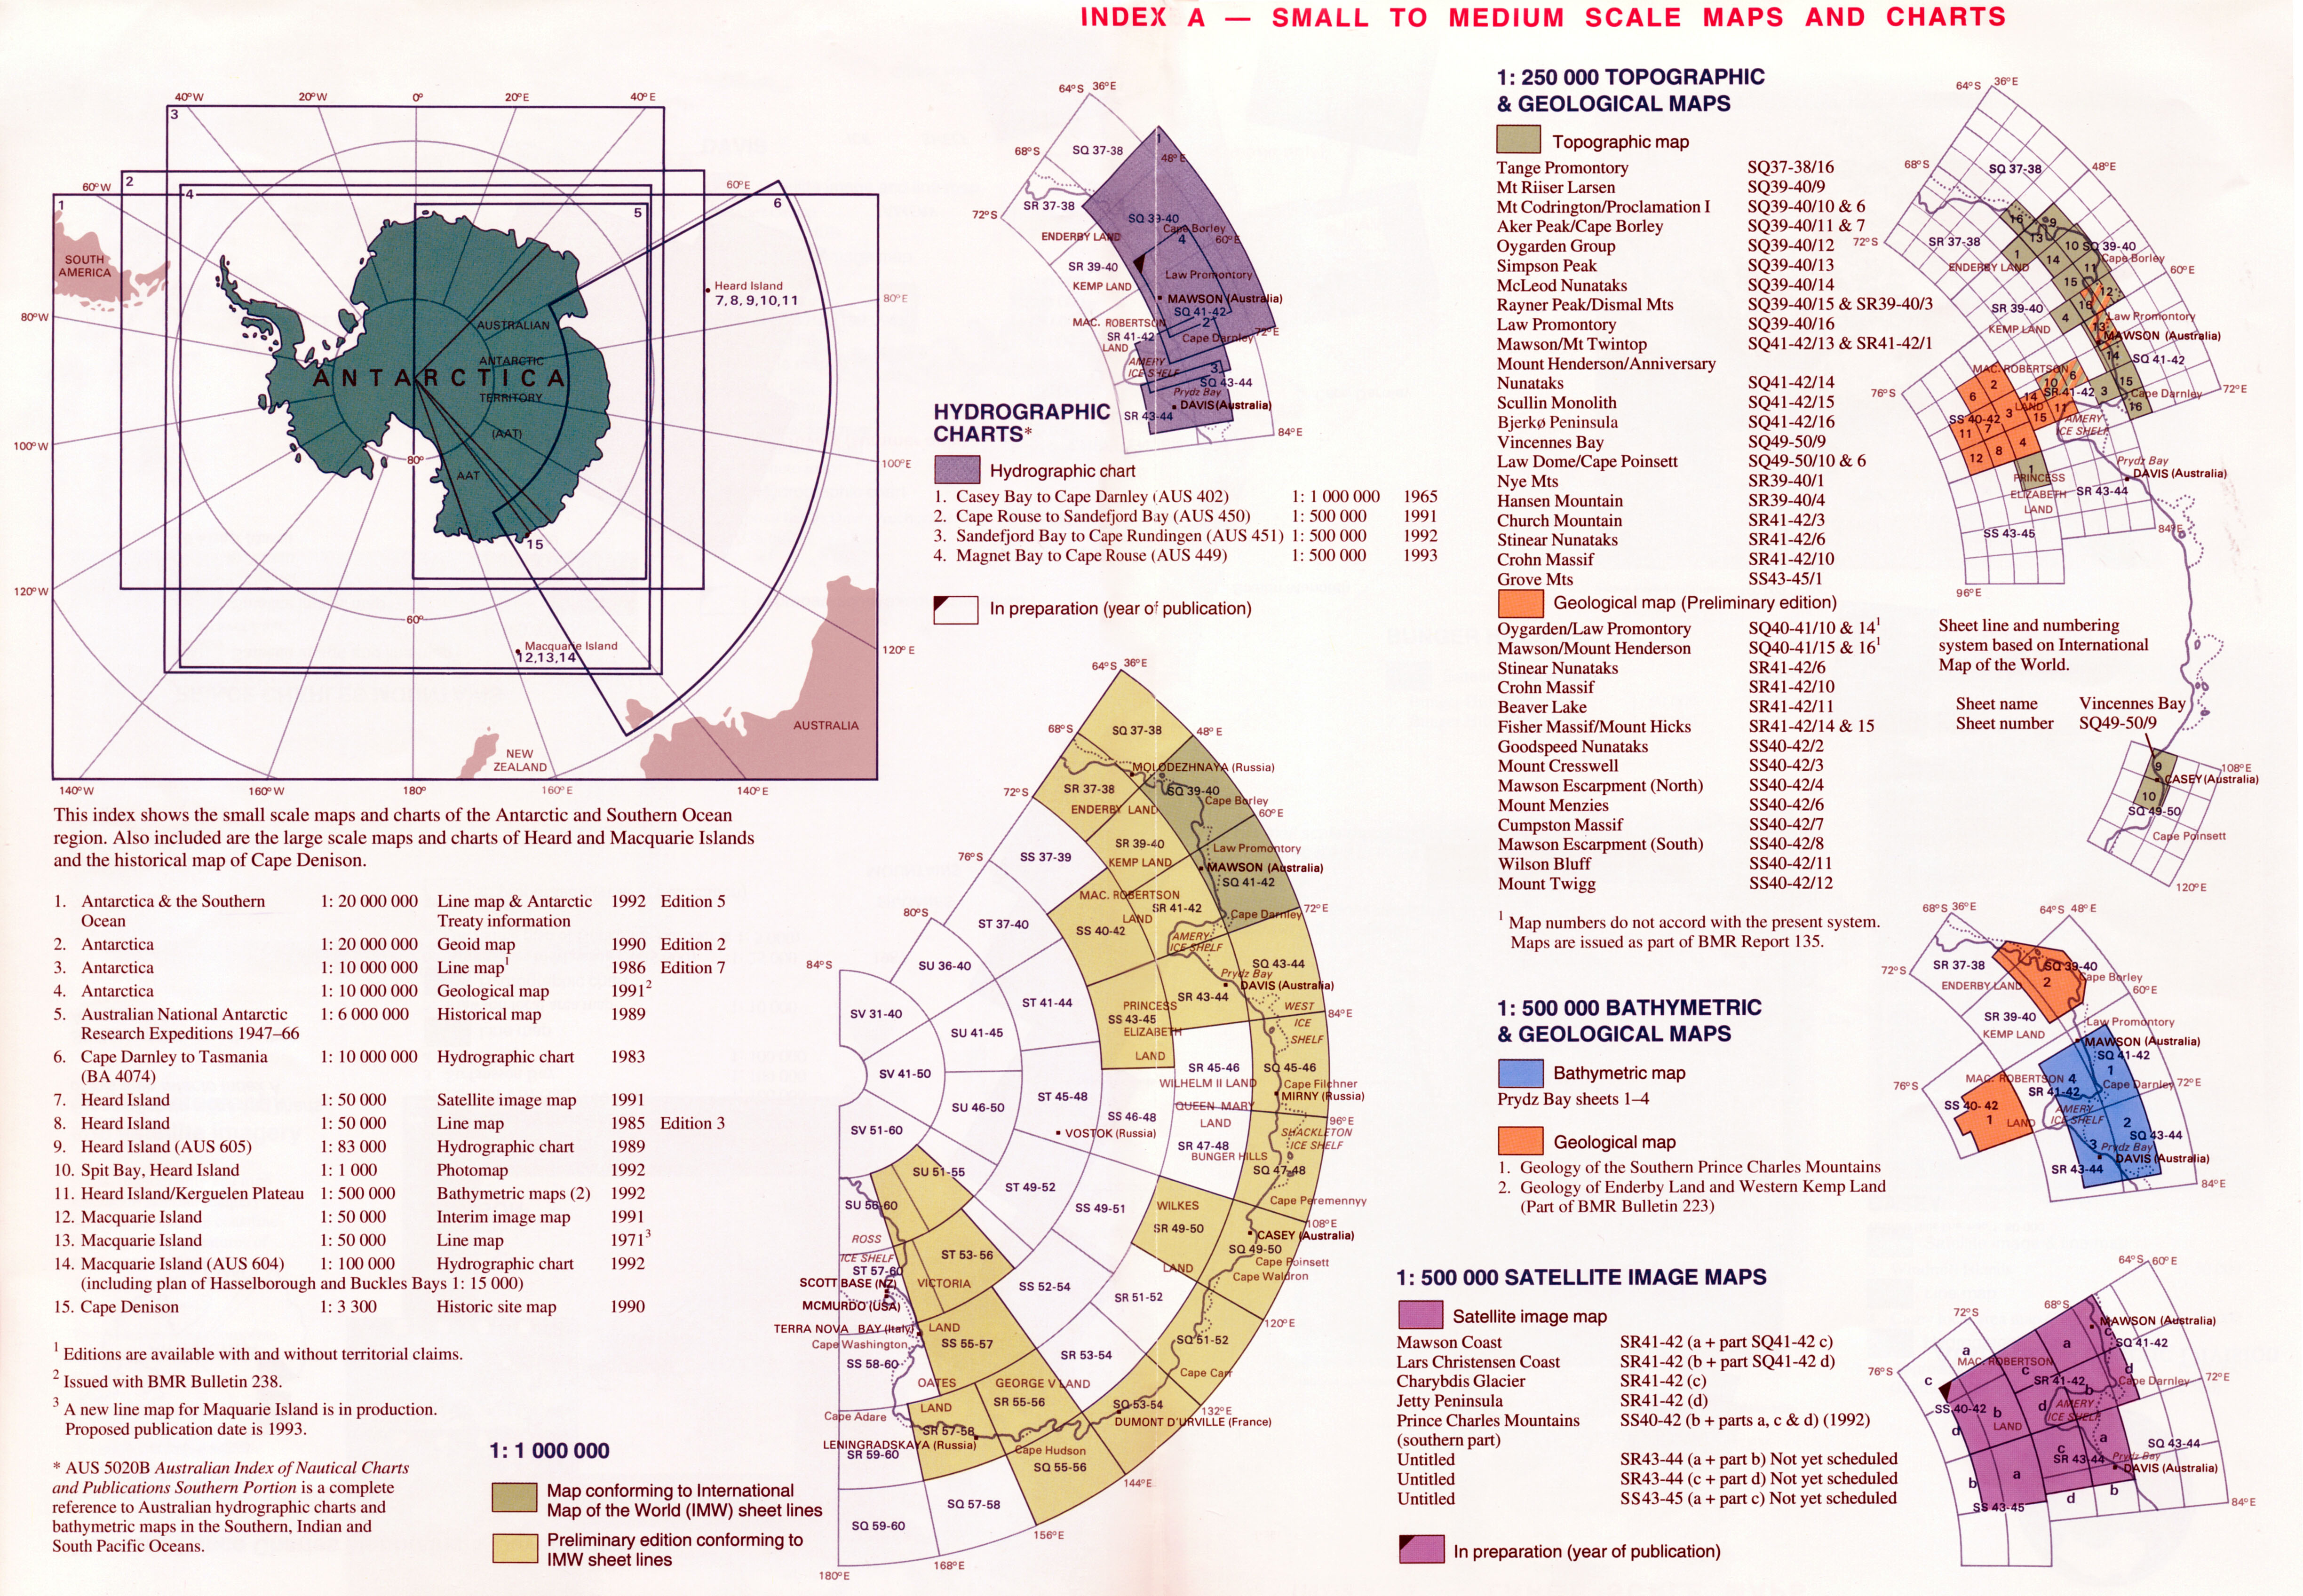
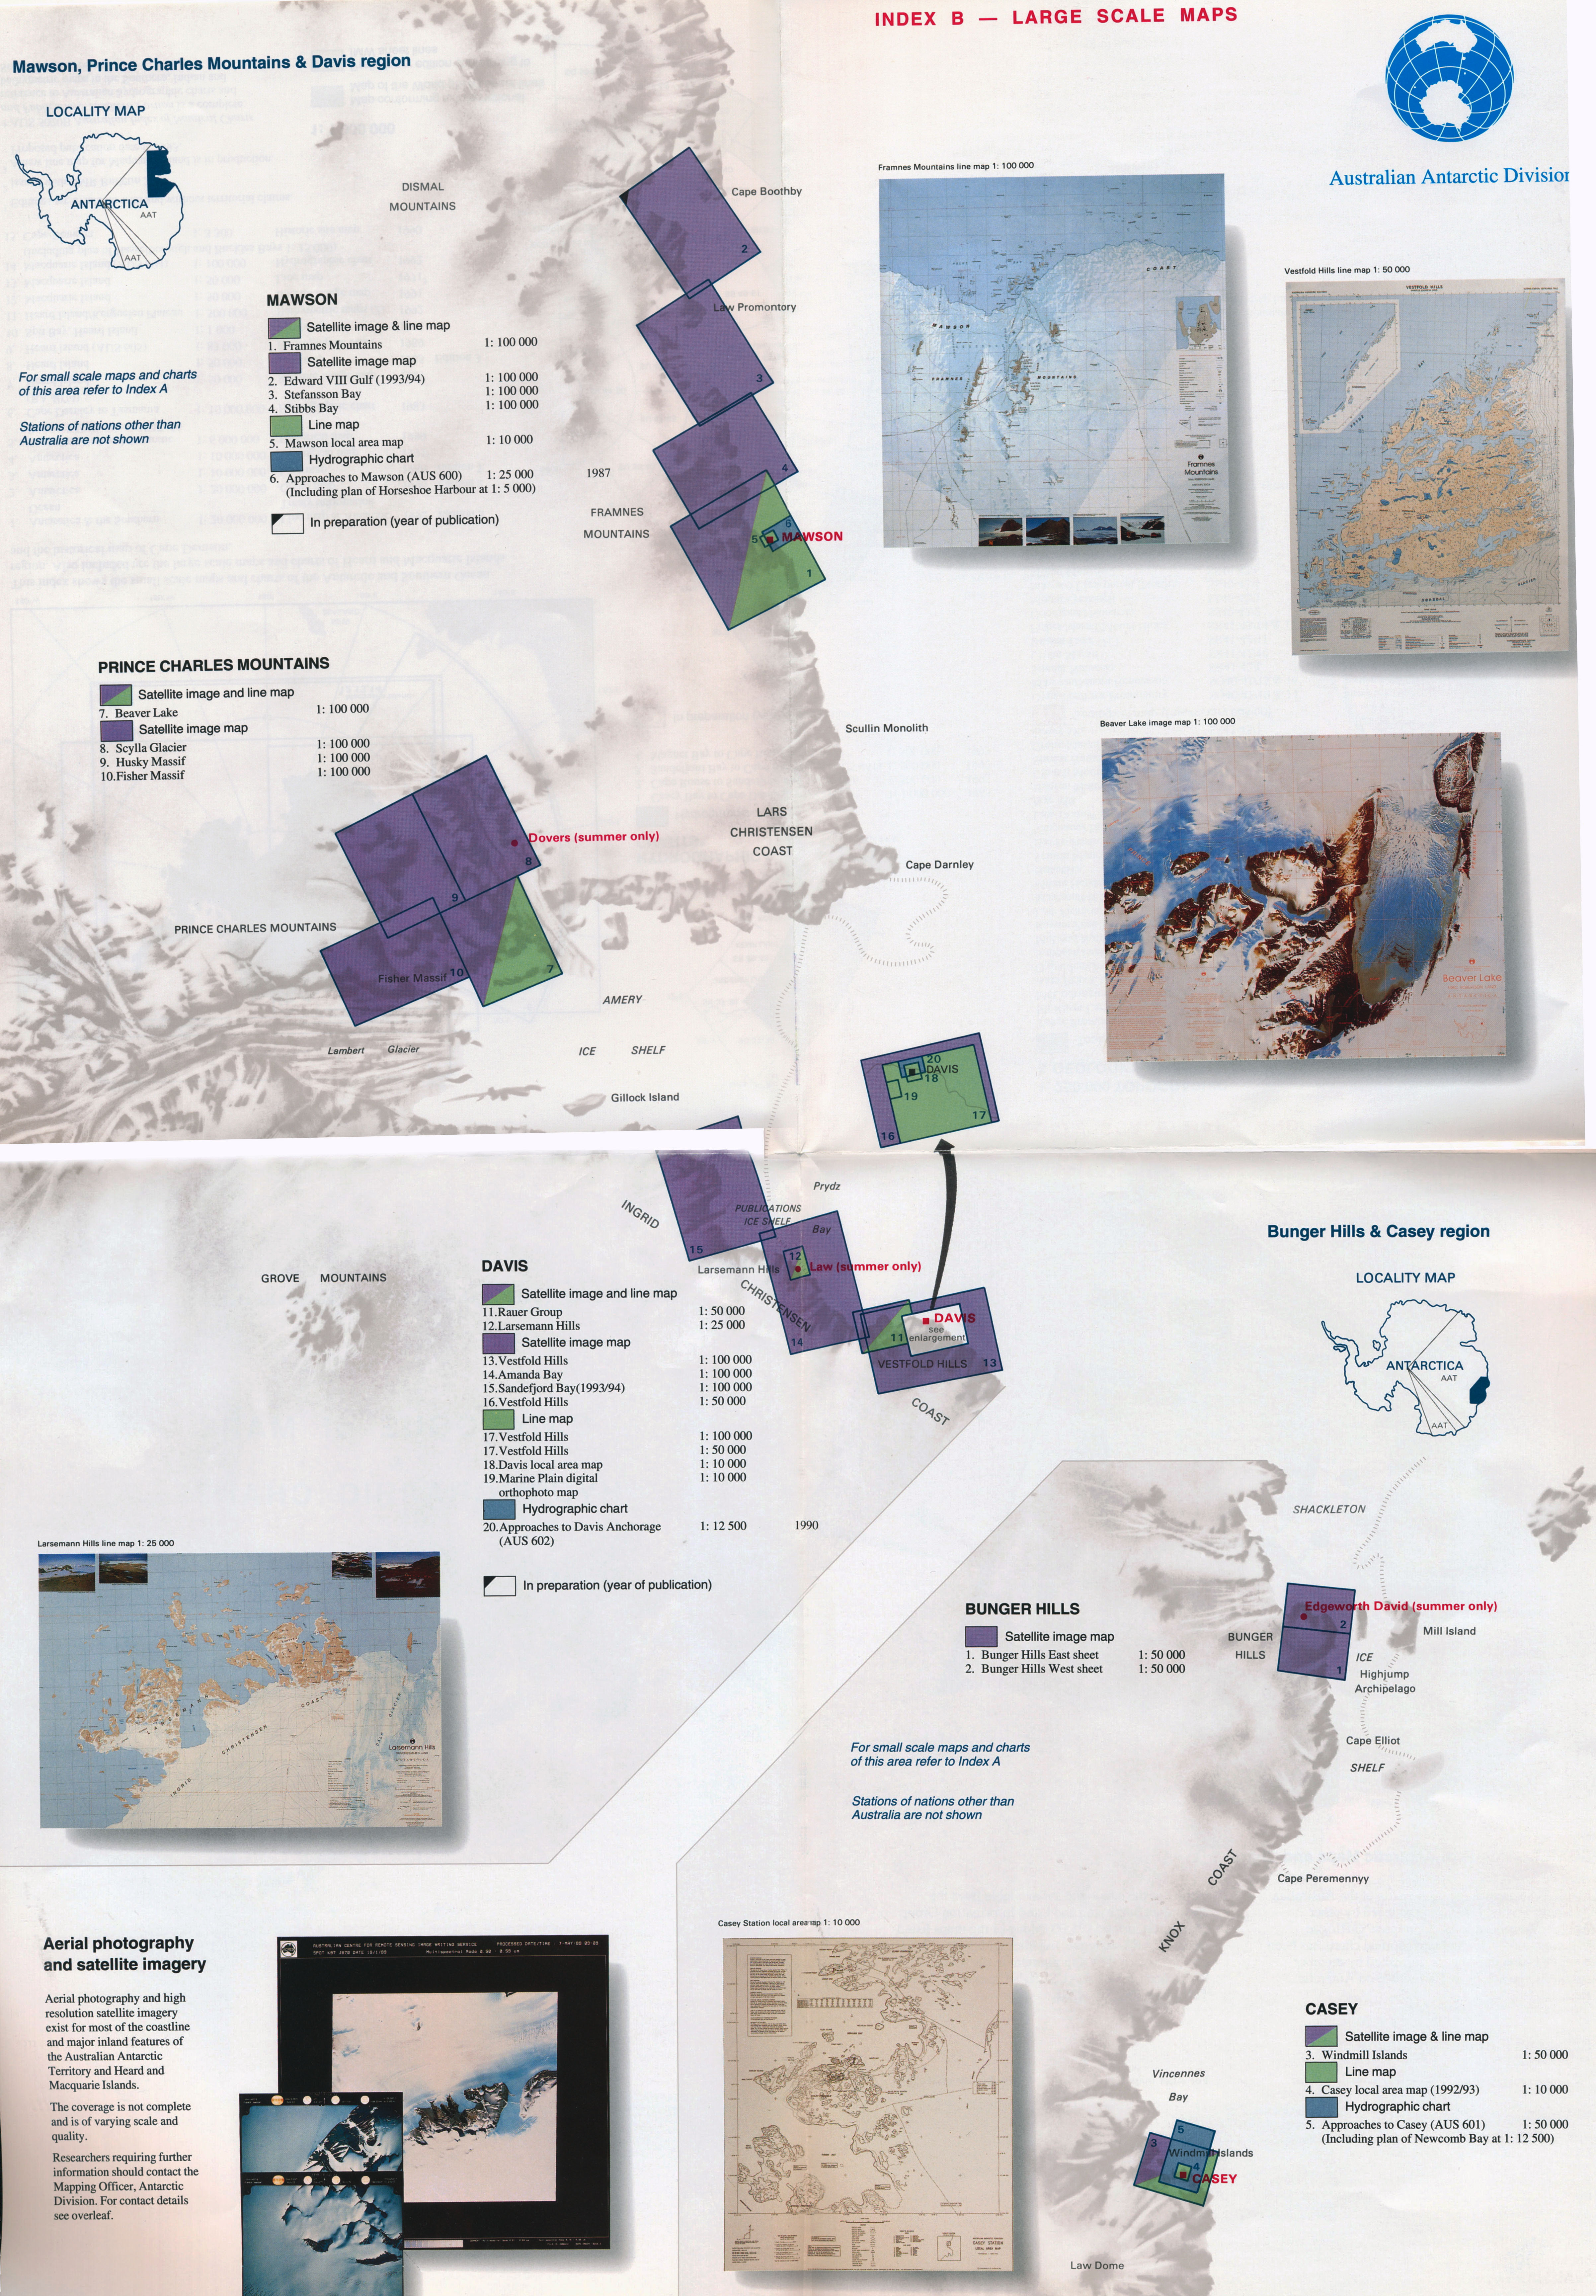
within the constraints of the 1:1,500,000 scales standard series. A range of map products
were published for the Australian Antarctic Territory for which Australia was
responsible, as well as other Australian offshore territories. These products,
which may not have provided full coverage, included : Topographic
Maps of the Australian Antarctic Territory at 1:250,000 scale (view sample map here ). International
Map of the World of the Australian Antarctic Territory at 1:1,000,000 scale Selected
geographical areas, for example, Vestfold Hills, Frammes Mountains, Beaver
Lake, Bunger Hills, Larsemann Hills at larger scales (view sample map here ). Areas covered by the above map series are shown in this 1992 Australian National Antarctic Research Expedition (ANARE), Catalogue of Maps and Hydrographic Charts showing small to medium scale maps and charts and large scale maps. Maps
of the Antarctic continent were also published at scales of 1:10,000,000 and
1:20,000,000. Maps
of Macquarie Island and of Heard Island and the nearby McDonald Islands were
published at suitable scales. In the mid-1970s Nat Map started to equip itself for digital
mapping. The aim of its digital mapping program was to create and maintain
digital databases of topographic and thematic data to be used within Nat Map
for map and atlas production and by the public and private sectors in a wide
range of applications. Also in the mid 1970s, to facilitate the exchange of digital map data between agencies, National Mapping's Dr Claude King in collaboration with the Royal Australian Survey Corps and other National Mapping Council organisations developed a standard for the exchange of topographic information on magnetic tape. By the early 1980s major mapping agencies and other interested parties further developed this standard into a national protocol for the exchange of digital map data. This protocol was developed under the auspices of the then Standards Association of Australia and promulgated as Australian Standard 2482 Interchange of Feature Coded Digital Mapping Data in 1981. This standard was revised in 1984 and again in 1989 and continued in force until 2015. In addition to the topographic and thematic data bases other
digital data sets that Nat Map compiled included : Topographic information from the World Aeronautical Charts Digital elevation model spot heights on a national grid with
spacings of 18 arc seconds (approx 500 metres) Census boundary data digitised from collection district
boundaries Geographic data - topographic data and nature conservation reserve boundaries for
all of Australia from 1:1,000,000 scale data Coastline data - the coastline was digitised from 1:100,000 scale data in
conjunction with determining and digitising the territorial sea baseline Place names the Australian National Gazetteer for the National Mapping Council. More information about digital mapping products may be accessed from Geoscience Australia's website at: http://www.ga.gov.au/topographic-mapping/digital-topographic-maps.html As
part of its national coordination role under the auspices of the National
Mapping Council, the Division of National Mapping maintained the National
Geodetic Database that contained up-to-date coordinate values and other
information for all horizontal and vertical survey control stations that were
deemed to be of value for national geodetic purposes. In accordance with National
Mapping Council Resolution 382 of 1979, other state, territory and commonwealth
government mapping agencies contributed details of any such control stations
within their jurisdictions to the National Geodetic Database. Information
from the National Geodetic Database was distributed to National Mapping Council
member organisations and also made available to the general public; usually
survey professionals. On
behalf of the National Mapping Council, the Division of National Mapping
maintained summaries of all first, second and third order horizontal survey
control stations. Typically for each such control station the summary contained
details of establishment and later occupation, field book references, access
details, ground mark and reference mark details together with details of any
levelling connection as well as any spot photography information. Initially
each station summary contained coordinate values for the relevant station
together with details of connections to adjoining control stations. However, in
later years as survey adjustments were periodically refined this information
was recorded separately. In
accordance with National Mapping Council Resolution 322 of 1968, other state,
territory and commonwealth government mapping agencies provided copies of any
such control station summaries within their jurisdictions to the Division of
National Mapping. Nat Map made copies of any such station summaries available
to other National Mapping Council member organisations as required. Station
summary copies were also made available to the general public; usually survey
professionals. Between
March 1963 and 1984, officers of the Division of National Mapping published technical reports to record
details of important technical developments, major programs or surveys which
were too lengthy for publication in professional journals. Some of these reports
were co-authored by leading academics or other technical experts. Listed by number, the reports were : The
Division of National Mappings chief executive was designated the Director of
National Mapping and was ex-officio the Chairman of the National Mapping
Council. The council was a national coordination forum whose members were the
heads of commonwealth, state and territory government mapping organisations.
The council held some 44 meetings between September 1945 and November 1986.
During this period, the council was advised from time-to-time by a technical
sub-committee, later by a technical advisory committee and by a permanent
committee on tides and mean sea level as well as by numerous ad hoc working
parties that addressed discrete technical matters. As
part of its national coordination function, the Division of National Mapping
provided a secretariat that supported the activities of the council and its
various sub-committees. Over the four decades of the councils operations, Nat
Map published on the councils behalf its numerous meeting minutes and other
reports of an administrative or technical nature including the councils
special publications (see details below). Generally, Nat Map distributed
National Mapping Council administrative documents only to council member
organisations but in later years also lodged copies of these documents with the
National Library of Australia. The style and structure of the councils annual
reports evolved over the years and in the mid-1980s the structure was as
follows : ·
Part
1-Summary of Proceedings (of the councils annual meetings) ·
Part
2-Reports by Council Members (of their organisations activities for the
relevant financial year) ·
Part
3-Consolidated Forecasts of Topographic Mapping (by council member
organisations for the coming year) ·
Report
of the annual meeting of the Technical Advisory Committee. Special
publications prepared and distributed by the Division of National Mapping were
as follows : Special
Publication 1 Special
Publication 2 Recommended Procedures for Recording of Nomenclature on a National Basis Special
Publication 3 Standards of Map Accuracy (The second edition of 1975 was revised by the Intergovernmental Committee on Surveying and Mapping (ICSM) and the current version is available via this link)
Special
Publication 4 Special
Publication 5 Standard Definitions of Terms Used in Photogrammetry, 1963 version (At its 1985 meeting the National Mapping Council decided to discontinue this Special Publication and instead use the American Society of Photogrammetry's (1984) Multilingual Dictionary of Remote Sensing and Photogrammetry that was edited by Dr George Antonovich Rabchevsky (1936-2005) Special
Publication 6 Standard for the Exchange of Topographic Data on Magnetic Tape (was superceded by SP12 but an overview is given here from 8th United Nations Regional Cartographic Conference for Asia and the far East, Bangkok 1977, pp.274-276, accessed at : https://unstats.un.org/unsd/geoinfo/RCC/docs/rccap8/8th_UNRCCAP_econf.68_8_Add1.pdf) Special
Publication 7 The Australian Map Grid Technical Manual Special
Publication 7A The Australian Map Grid : Tables for co-ordinate transformation,
geographic to grid (now superceded by computerised methods) Special
Publication 7B The Australian Map Grid : Tables for co-ordinate transformation,
grid to geographic (now superceded by computerised methods) Special
Publication 7C The Australian Map Grid : Latitude functions for the Australian
National Spheroid (now superceded by computerised methods) Special
Publication 8 The Australian Height Datum (AHD) (1979) [Single page list of the Junction Points and more detailed map of their location and AHD height] Special
Publication 9 Recommended Operating Procedures for Tide Gauges on the National Network (prepared by Permanent Committee on Tides and Mean Sea Level) Special
Publication 10 The Australian Geodetic Datum Technical Manual (1986) Special
Publication 11 A National Specification for Tactual and Low Vision Town Maps Special
Publication 12 Un-numbered Standard Topographic Map Symbols, 1962 version (Replaced by the Intergovernmental Committee on Surveying and Mapping (ICSM) set of nationally consistent topographic map symbols available via this link [the Specifications for : Topographic Map Series Australia : 1:100 000 & 1:250 000 Scale or similar, which were in A4 size folders in Commonwealth Green, have been replaced by Geoscience Australia's Version 5.0 of 2007 available via this link]) National Mapping Bulletin
Other regular and periodic publications by National Mapping
included : National Mappings Annual Statement of Activities Periodic Activities and Products brochures Australian Landsat Station brochures Periodic Thematic Mapping and Electronic Survey Computing
Bulletins Quarterly Report, Orroral Observatory Folder for 1987 Bushfires and the Australian Environment Symposium Standard Symbols for use on Topographic Maps of Antarctica
prepared on behalf of the Scientific Committee on Antarctic Research
Australian
1:5,000,000 scale Map Series
Australian
1:1,000,000 scale Land Use Series
Special Maps
1:100,000 scale Topographic
1:2,500,000 scale General
1:2,000,000 scale Pastoral Map that depicted the names and
boundaries of pastoral leases and various other land tenures in the non-urban
areas of the Northern Territory.
1:5,000,000 scale Relief
1:5,000,000 scale Dams and Storages
1992 Cocos (Keeling) Island 1:50,000 scale;
1992 Christmas Island 1:50,000 scale;
1987 Norfolk Island 1:15,000 scale;
1996 Ashmore Reef.
1991 Southern Kakadu;
1993 Murray Darling Basin;
1995 Antarctica & Southern Ocean, 1:20M scale.Australian General Reference Maps
Mapping
for Commonwealth and Government Authorities
Tactual
Atlas of Australia
Maritime
Boundaries Mapping
Maritime
Jurisdiction Mapping
Special
Map Series
Australian
Antarctic Territory Mapping
Digital
Mapping Program
National
Geodetic Database
Survey
Control Station Records
XNATMAP's List of the Division
of National Mapping Technical Reports
National
Mapping Council Reports and Publications
Standard Specifications for Horizontal and Vertical Control by the National Mapping Council, were published in 1953 (NMO/53/11.2), at a time when triangulation was still the predominant survey technique.
Between May 1950 and April 1960 the Director of National Mapping prepared and distributed on behalf of the National Mapping Council a series of National Mapping Bulletins. These Bulletins contained articles on technical surveying, mapping, photogrammetry and related topics that were generally reprinted from overseas professional journals. A total of 14 such Bulletins were prepared. The format was 205 by 330 mm. Typically the Bulletins varied in length from about 30 to 70 pages. Some issues included images and diagrams.Other National Mapping Publications